
Trump says they’ve got a deal. Iran says they’ve got a deal. The Strait of Hormuz says, “Welcome back, oil tankers!” But let’s not pop the champagne until the ink is dry-and even then, keep the cork handy.
Today’s signal
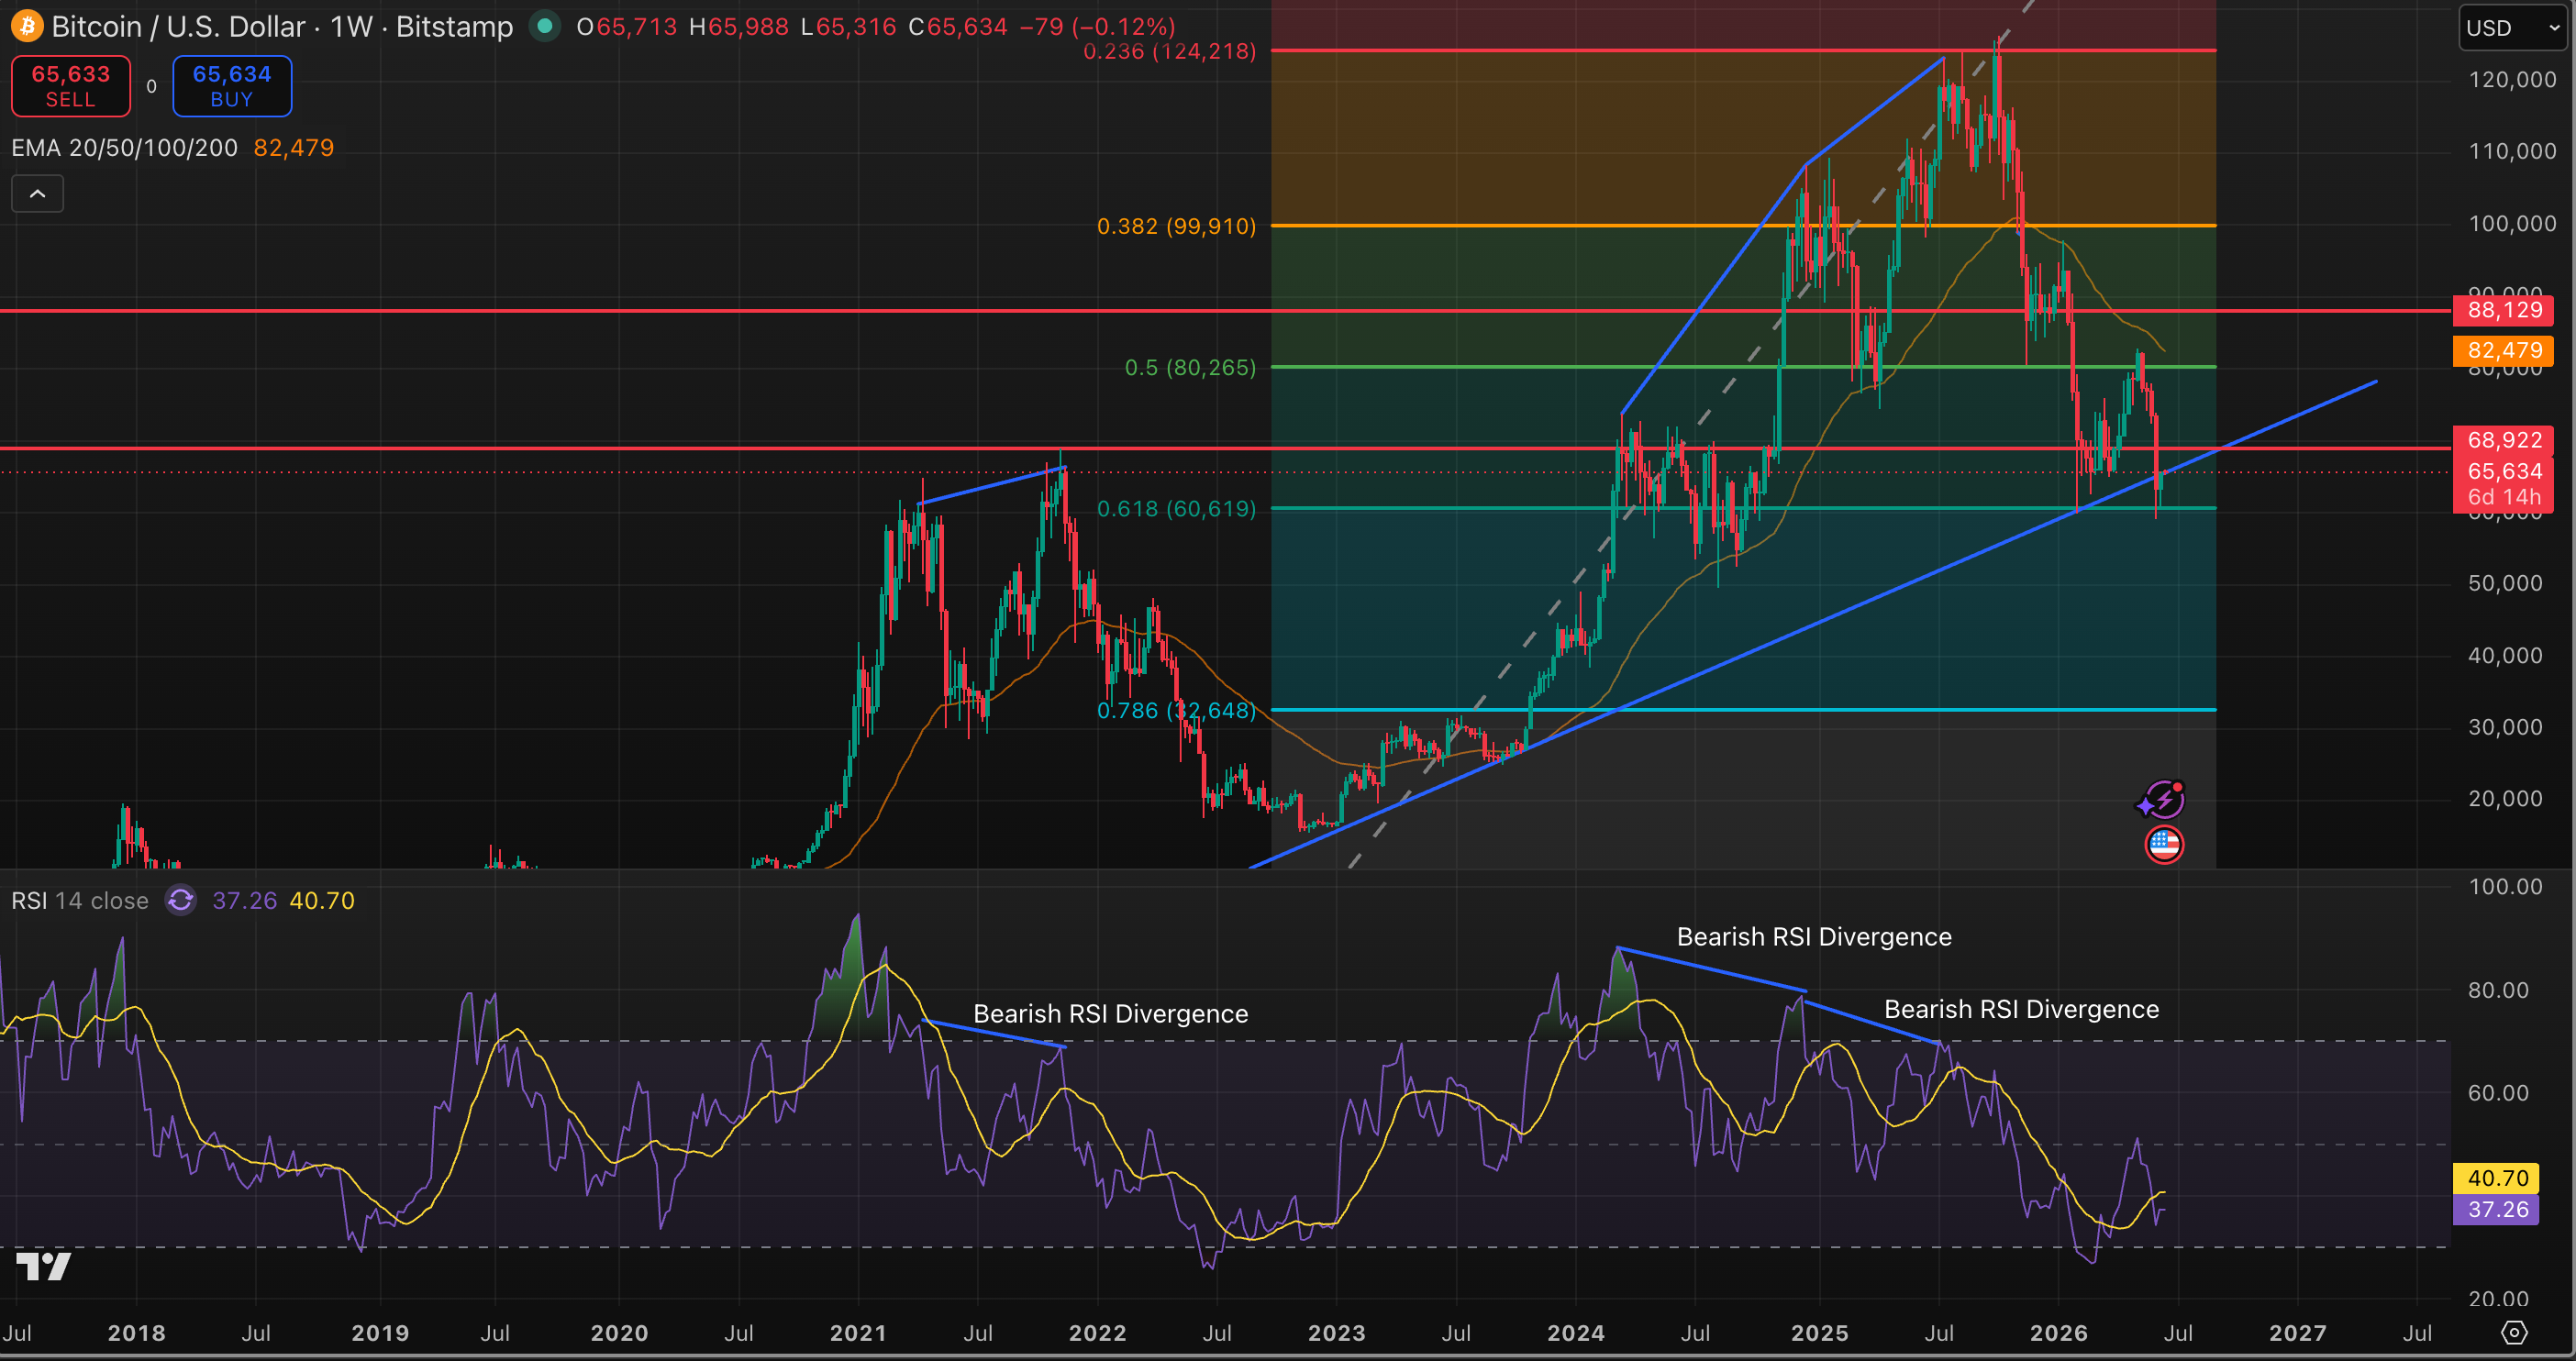
Behold, the chart of Bitcoin’s weekly price change, complete with Fibonacci levels and RSI. It’s like a financial Rorschach test-what do you see? A rebound from $60,000? A downtrend of lower highs? Or just a bunch of squiggly lines? The RSI is weak at 37, but if Bitcoin closes above $66,000, it might just reclaim its throne. Fail to reach that, and $60,000 is still in the crosshairs. Next stops: $68,900, then $80,000-$82,500. Strap in, folks-it’s gonna be a wild ride.
Read More
- Off Campus Season 1 Soundtrack Guide
- Netflix’s Little House On The Prairie Reboot: Release Date, Cast & Everything We Know
- Gold Rate Forecast
- Infinity Nikki Candlelight Reverie Challenge and Rewards Guide
- Brent Oil Forecast
- Prime Video’s New R-Rated Spy Thriller Is Officially No.1 On Streaming Despite Poor Reviews
- Silver Rate Forecast
- EUR ZAR PREDICTION
- The Hunting Wives Star Teases “Wild” Major Character Death in Season 2
- 24 Jump Street in the works with Jonah Hill and Channing Tatum set to return
2026-06-15 15:07