Shiba Inu has fallen below a recent support level and remains in a weak position. While the price decrease has slowed down a bit, the recent drop confirms that sellers are still dominating the market.
Throughout April and the beginning of May, the price of SHIB had been slightly increasing, forming a narrow wedge pattern. However, recently the price dropped below this pattern. This caused a quick decline, pushing the price below its recent short-term moving averages and erasing the small gains it had made during the earlier increase.
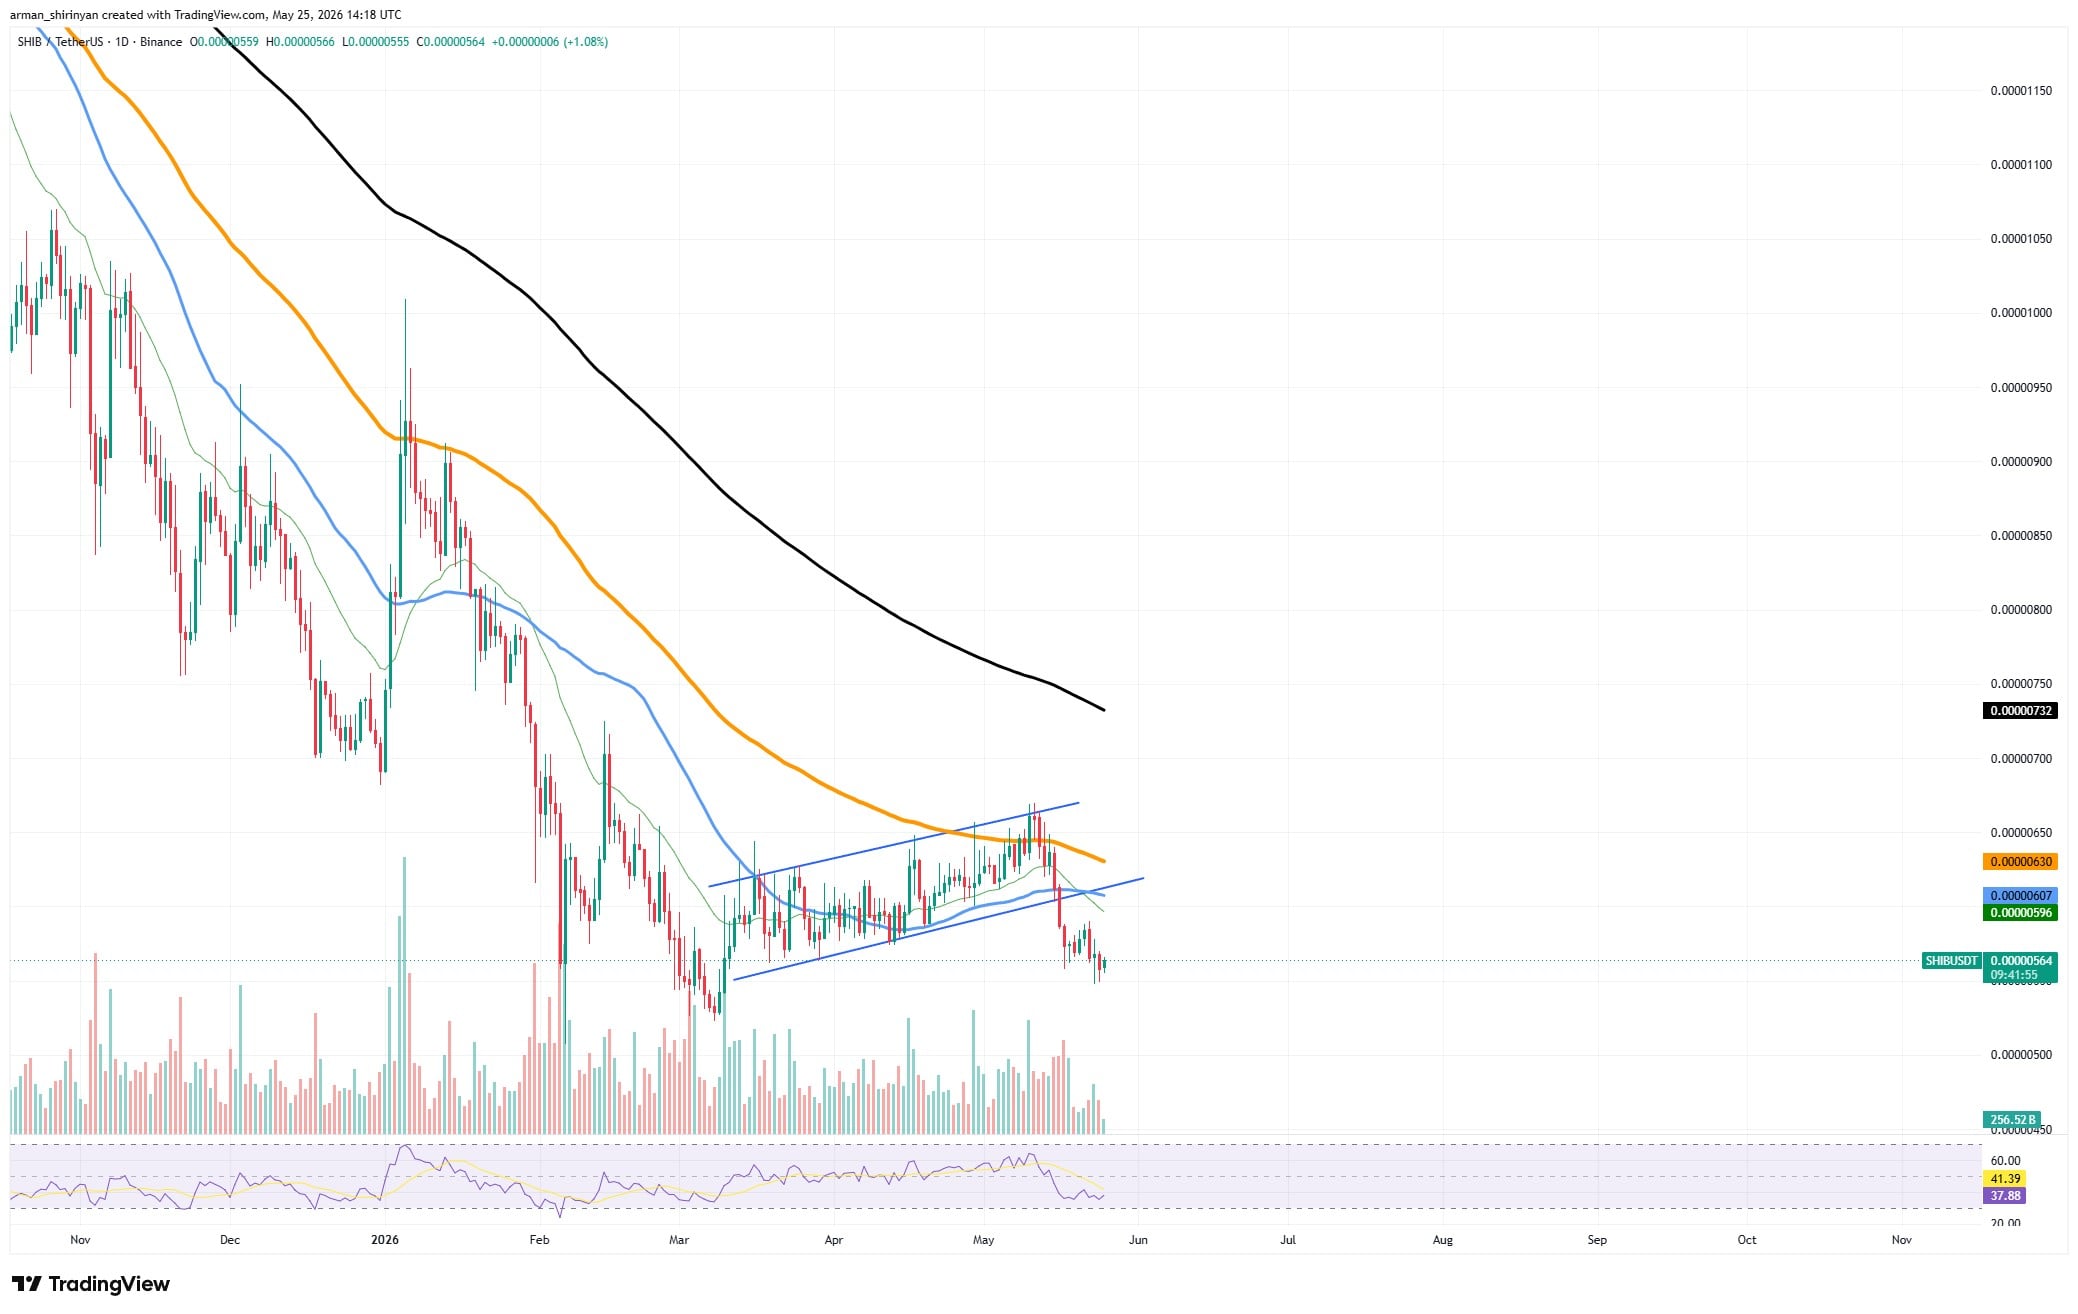
Currently, the market seems to be finding a floor around $0.00000550. However, trading volume remains low, which is a concern for those hoping for price increases. Recent attempts to recover have quickly lost steam, suggesting traders are selling at higher prices instead of buying. The Relative Strength Index (RSI) is also weak, hovering around the low 40s, meaning the upward trend is slowing down, but hasn’t yet reached a point where it’s considered extremely oversold.
Shiba Inu (SHIB), XRP, Hyperliquid (HYPE) and Bitcoin (BTC) Price Analysis for May 26: Risk Brings Profits
Schiff: Investors Will Buy Tokenized Gold Instead of Crypto
SHIB could potentially enter a deeper downtrend. If selling continues and the price falls below its recent low, it might drop back to around $0.00000500, a key support level. Falling below this level would significantly increase the risk of a larger price decrease.
For the price to start going up, it needs to break above the resistance level between $0.00000600 and $0.00000630 and regain its upward trend. Until then, the current downward trend is likely to continue.
XRP’s momentum wanes
XRP is nearing a key support level after struggling to stay above a declining resistance point. While the price is still moving within a narrow range, the chart patterns now suggest a likely continuation of the downward trend rather than a price increase.
The main issue is that the price keeps falling back down after briefly rising to around $1.47, an area marked by the 50-day moving average. Each time the price tries to go up, it quickly loses momentum. At the same time, the price is generally trending downwards and approaching a support level around $1.30, where it might find some stability.
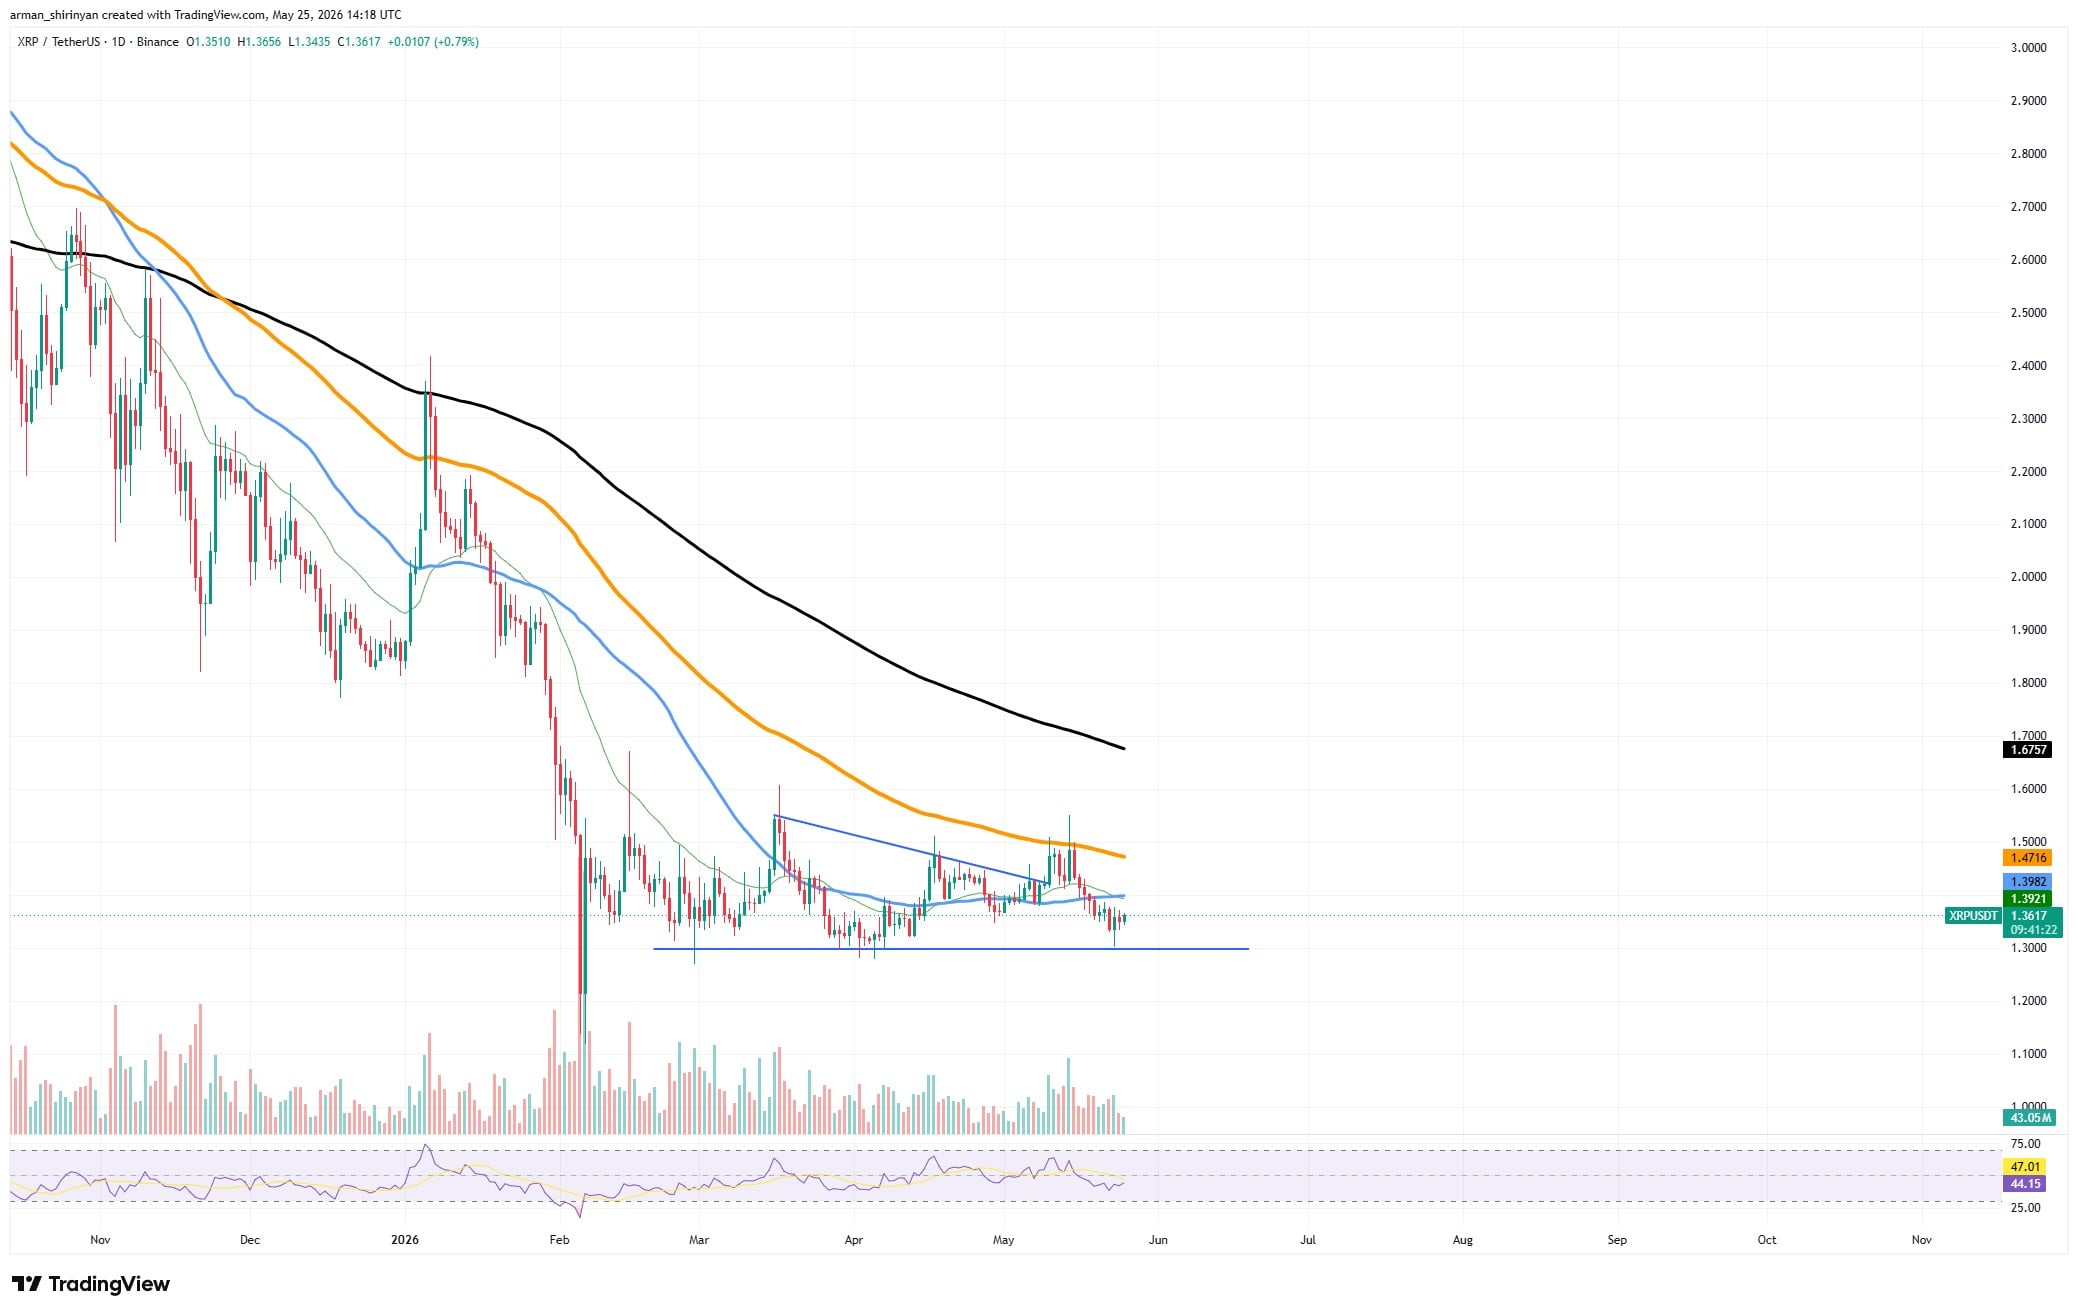
This creates a potentially dangerous scenario. If XRP falls below $1.30, it could trigger a significant price drop, breaking out of the trading range it’s been in for months. Trading volume has been declining during this period of sideways movement, which often happens before a large price swing.
Currently, technical indicators aren’t giving a clear signal. The Relative Strength Index (RSI) remains below a neutral level, showing neither strong buying pressure nor consistent accumulation. However, XRP hasn’t fallen apart completely. A key support level to watch is $1.30, as it successfully prevented further declines on multiple occasions between March and May.
XRP might not fall further in price and could instead move sideways if buyers can push it back up, particularly around the $1.45 to $1.50 range. Despite this possibility, the overall trend still looks like it’s heading downwards unless we see evidence to the contrary.
Hyperliquid’s performance looks unmatched
Hyperliquid remains a strong performer in the crypto market, but its price has risen very quickly and may be due for a pullback after recently surging past $60. While the price is still trending upwards, traders should be aware that a significant drop is becoming more likely after such a rapid increase.
HYPE has experienced a remarkable and rapid price increase. In just a few trading sessions, it surged from around $45 to reach record highs, easily breaking through resistance levels with little pausing. Currently, the price is significantly above all key moving averages, and the 20-day average is quickly climbing to follow the upward trend. This pattern usually indicates strong momentum and a volatile market.
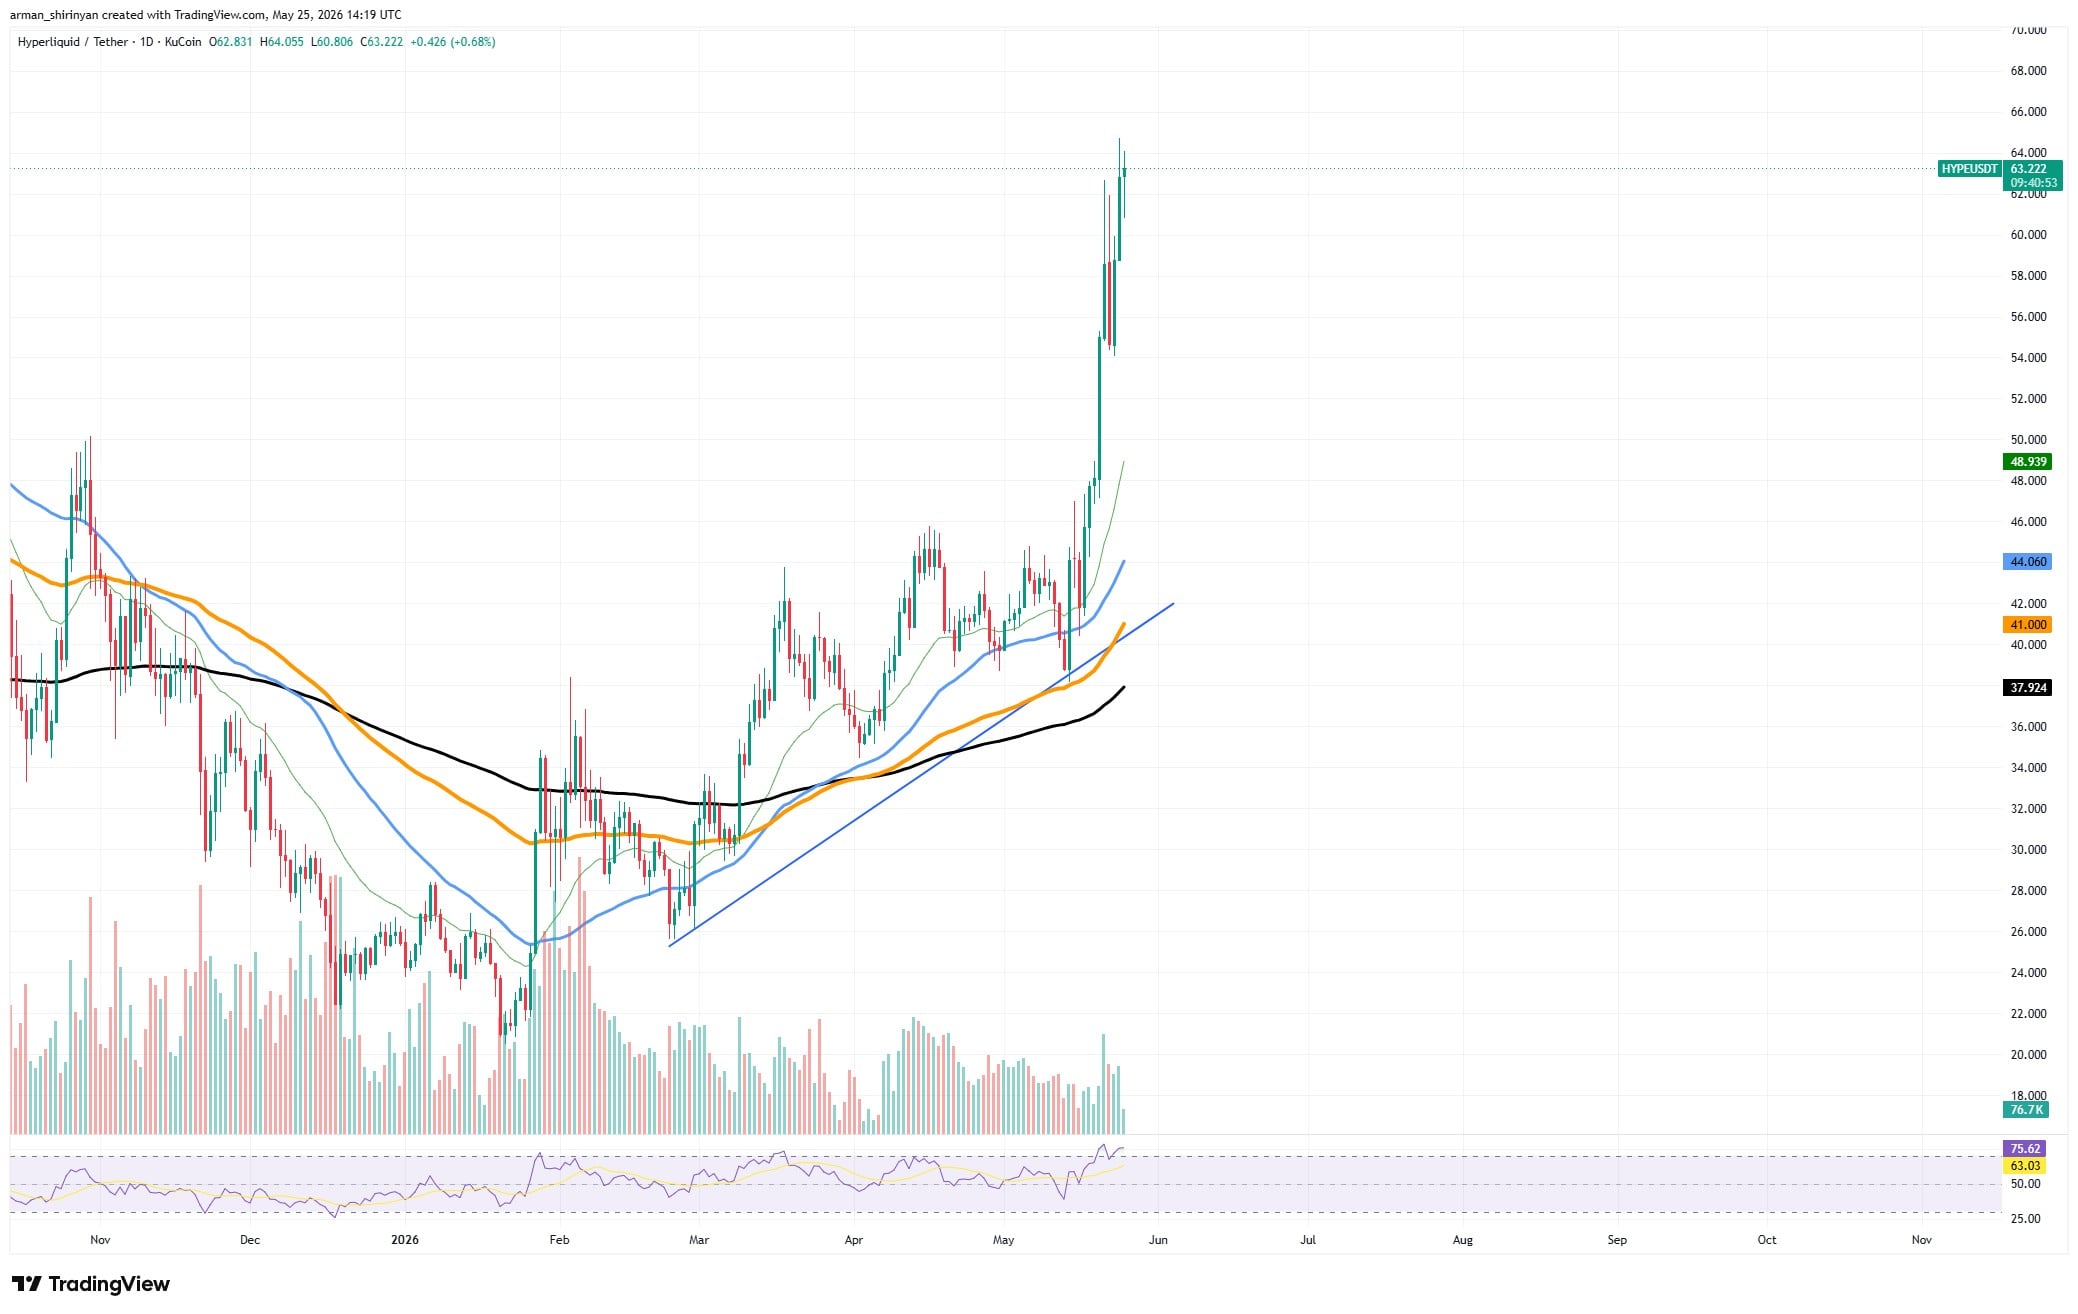
Lately, price charts have been showing more frequent instances of price increases followed by declines, particularly near the recent highs. At the same time, the Relative Strength Index (RSI) was already indicating the price had risen too quickly. This often suggests that some investors are starting to sell their holdings to secure profits after a rapid price increase.
Despite recent gains, bears are struggling because there’s little opposition left. The market outlook remains strongly positive as long as HYPE stays above the $55-$57 level, where it previously broke out. Investors are quickly buying any price drops, seeing Hyperliquid as a rapidly growing platform rather than just a risky cryptocurrency.
If the current upward trend continues, the price is likely to face resistance around $70. However, if this recent increase slows down, a drop back towards the $45-$50 range – near the 20-day moving average – is also quite possible.
Bitcoin hits the ceiling
Bitcoin is currently facing a key challenge as it approaches a major price level it’s struggled to break through this year. While the price has bounced back strongly from its April low, that upward movement is now slowing down, right under the $81,000 mark – a level that’s proven difficult to surpass. From a technical analysis perspective, this resistance is noteworthy.
Bitcoin’s price recently dropped after it couldn’t stay above its recent peak. This caused it to fall below a short-term upward trend. Now, the price has landed around the $76,000-$77,000 range, where it’s meeting support from the 50-day and 100-day moving averages, and buyers are trying to prevent further declines.
Momentum indicators aren’t showing a clear trend, suggesting the market is pausing. While the Relative Strength Index (RSI) had been climbing with the recent recovery, it’s now settled at a neutral level. Trading volume has also dropped considerably as investors seem to be waiting for major economic news – particularly the upcoming reports on U.S. GDP and inflation – before making any big moves.
Bitcoin’s current trend looks cautiously positive as long as it stays above $75,000. If it can break past the $80,000-$81,000 level again, we could see another strong price increase. However, if broader market pressures increase and Bitcoin falls below its current support, it could drop back down to around $72,000.
Read More
- Netflix’s Little House On The Prairie Reboot: Release Date, Cast & Everything We Know
- Off Campus Season 1 Soundtrack Guide
- Gold Rate Forecast
- Infinity Nikki Candlelight Reverie Challenge and Rewards Guide
- Prime Video’s New R-Rated Spy Thriller Is Officially No.1 On Streaming Despite Poor Reviews
- Silver Rate Forecast
- Brent Oil Forecast
- EUR ZAR PREDICTION
- 24 Jump Street in the works with Jonah Hill and Channing Tatum set to return
- KPop Demon Hunters Meets Avatar: The Last Airbender In Netflix’s 3-Part Fantasy Series
2026-05-26 03:24