- Bitcoin price started a downside correction from the $72,800 zone against the US Dollar.
The price is now trading above $68,000 and the 55 simple moving average (4 hours).
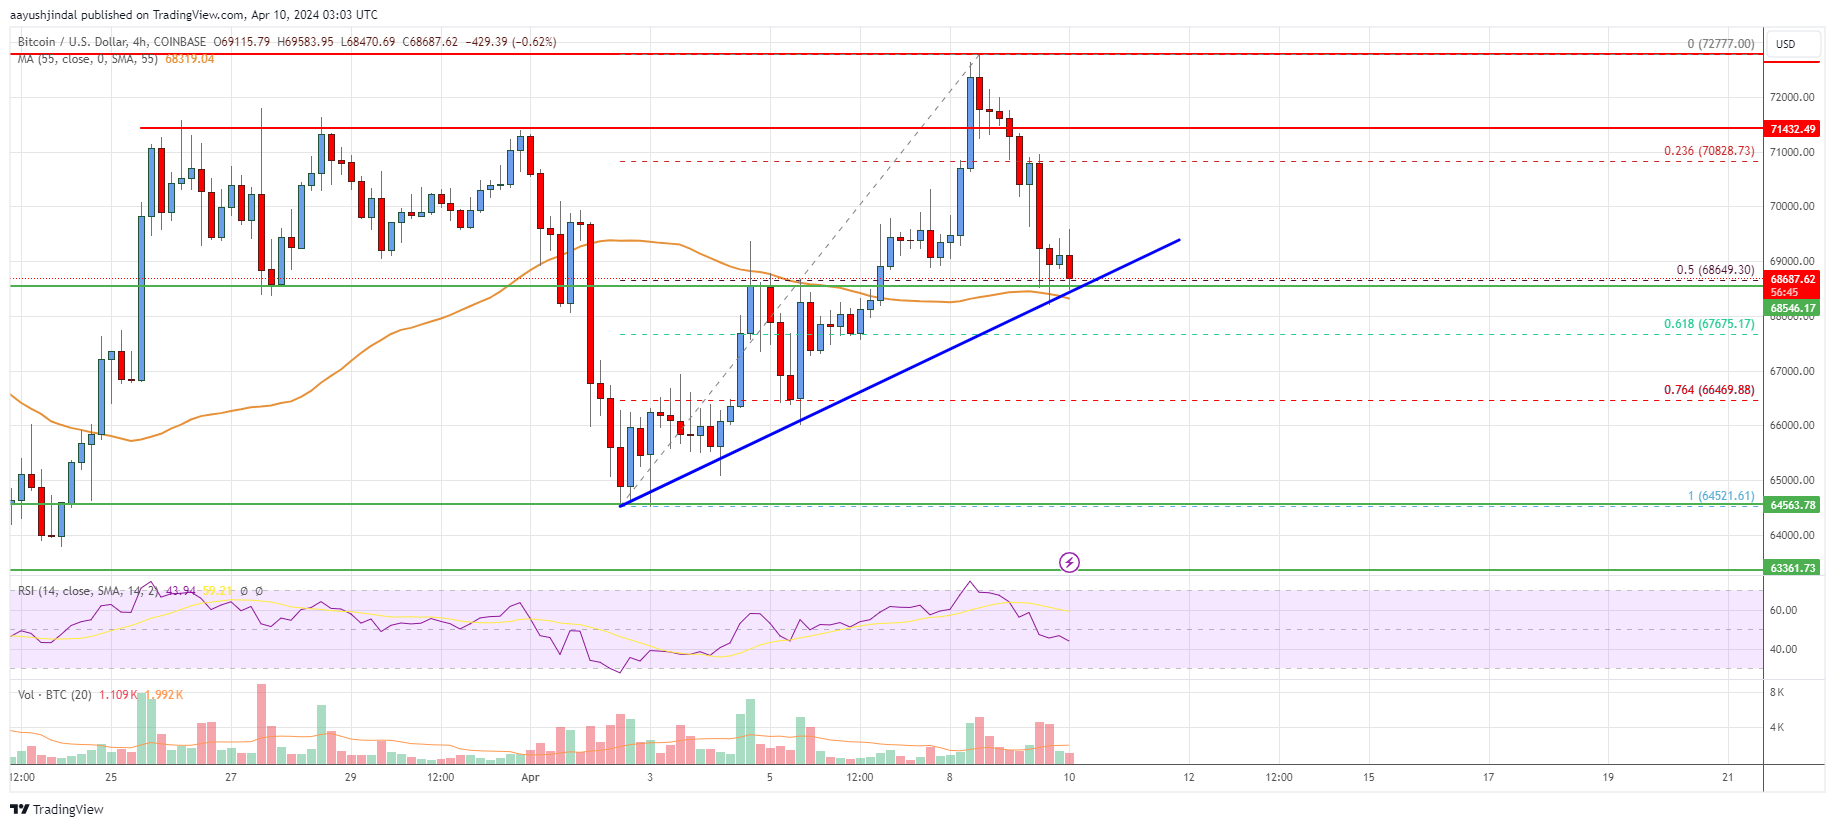
There is a key bullish trend line forming with support at $68,500 on the 4-hour chart of the BTC/USD pair (data feed from Coinbase).
The pair could start a fresh increase if it stays above the $68,500 support zone.
The price of Bitcoin is currently dropping beneath $70,000 versus the US Dollar. If the bulls continue to be active above the $68,500 level, Bitcoin may experience another rise.
Bitcoin Price Analysis
The price of Bitcoin continued climbing, surpassing $70,500 and approaching the resistance point at $72,500. Nevertheless, bears were still present around $72,800, trying to push the price back down.
Before the price began to decline, a peak formed around $72,777. The market then broke through the resistance levels at $72,000 and $70,000. The bears successfully drove the price down below the 38.2% Fibonacci retracement mark of the rally from the $64,521 trough to the $72,777 peak.
The price dipped under $68,500 before rebounding, with Bitcoin currently being bought and sold above this mark and the 4-hour 55 simple moving average. Additionally, a significant bullish trend line is emerging on the 4-hour BTC/USD chart, providing support near $68,500. This level is close to the 50% Fibonacci retracement point of the price increase from $64,521 to $72,777.
Close to $70,000 is where you’ll encounter strong resistance if Bitcoin attempts to go up. The next significant hurdle could be around $71,400. If Bitcoin manages to surpass this barrier, it may push the price towards $72,500. Beyond that, the price could continue climbing, potentially reaching $73,500.
If the price continues to rise, it could reach the $75,000 mark. However, if there’s no further increase, the price may drop back down towards $68,500.
$67,650 is the first significant support level. The price may encounter its next important resistance around $66,400. If the price falls below this level, it could potentially drop faster towards $64,500. Should further losses occur, the price might slide down to $63,500.
Based on the chart’s analysis, Bitcoin’s price currently hovers above $68,000 and the 4-hour 55 simple moving average. If this trend continues, there is a possibility for a new upward price movement if the support at $68,500 holds firm.
Technical Indicators
4 hours MACD – The MACD is now gaining momentum in the bearish zone.
4 hours RSI (Relative Strength Index) – The RSI is now below the 50 level.
Key Support Levels – $68,500 and $66,400.
Key Resistance Levels – $70,000, $71,200, and $72,500.
Read More
- WLD PREDICTION. WLD cryptocurrency
- BTC EUR PREDICTION. BTC cryptocurrency
- ZBC/USD
- Top gainers and losers
- MEME PREDICTION. MEME cryptocurrency
- PRISMA PREDICTION. PRISMA cryptocurrency
- PRMX PREDICTION. PRMX cryptocurrency
- AGLD PREDICTION. AGLD cryptocurrency
- Brent Oil Forecast
- Bitcoin Likely to Drop After the Halving, JPMorgan Says
2024-04-10 06:34