Recently, Ethereum (ETH) has shown strength, holding above the important level of $3,200. This stability has resulted in a quiet market phase with only small changes in price.
Despite some signs suggesting an increase in demand for Ethereum in the coming months, which could push its price beyond its $4.1K annual high.
Technical Analysis
By Shayan
The Daily Chart
Examining Ethereum’s daily price chart reveals its resilience against heightened selling, as it consistently bounces back from the $3,200 area. This significant support level aligns with important Fibonacci retracement levels, at $3190 (0.5) and $2972 (0.618). The 100-day moving average, which sits at $2972, also adds to its robustness in this zone.
The intersection of these various support levels implies that sellers may encounter substantial resistance when trying to push prices down, suggesting a strong buying force and high demand for Ethereum as it falls in value.
Despite the present flat trend of ETH, there’s a strong belief among traders that it will bounce back and surpass its annual peak of $4,100 in the upcoming months.
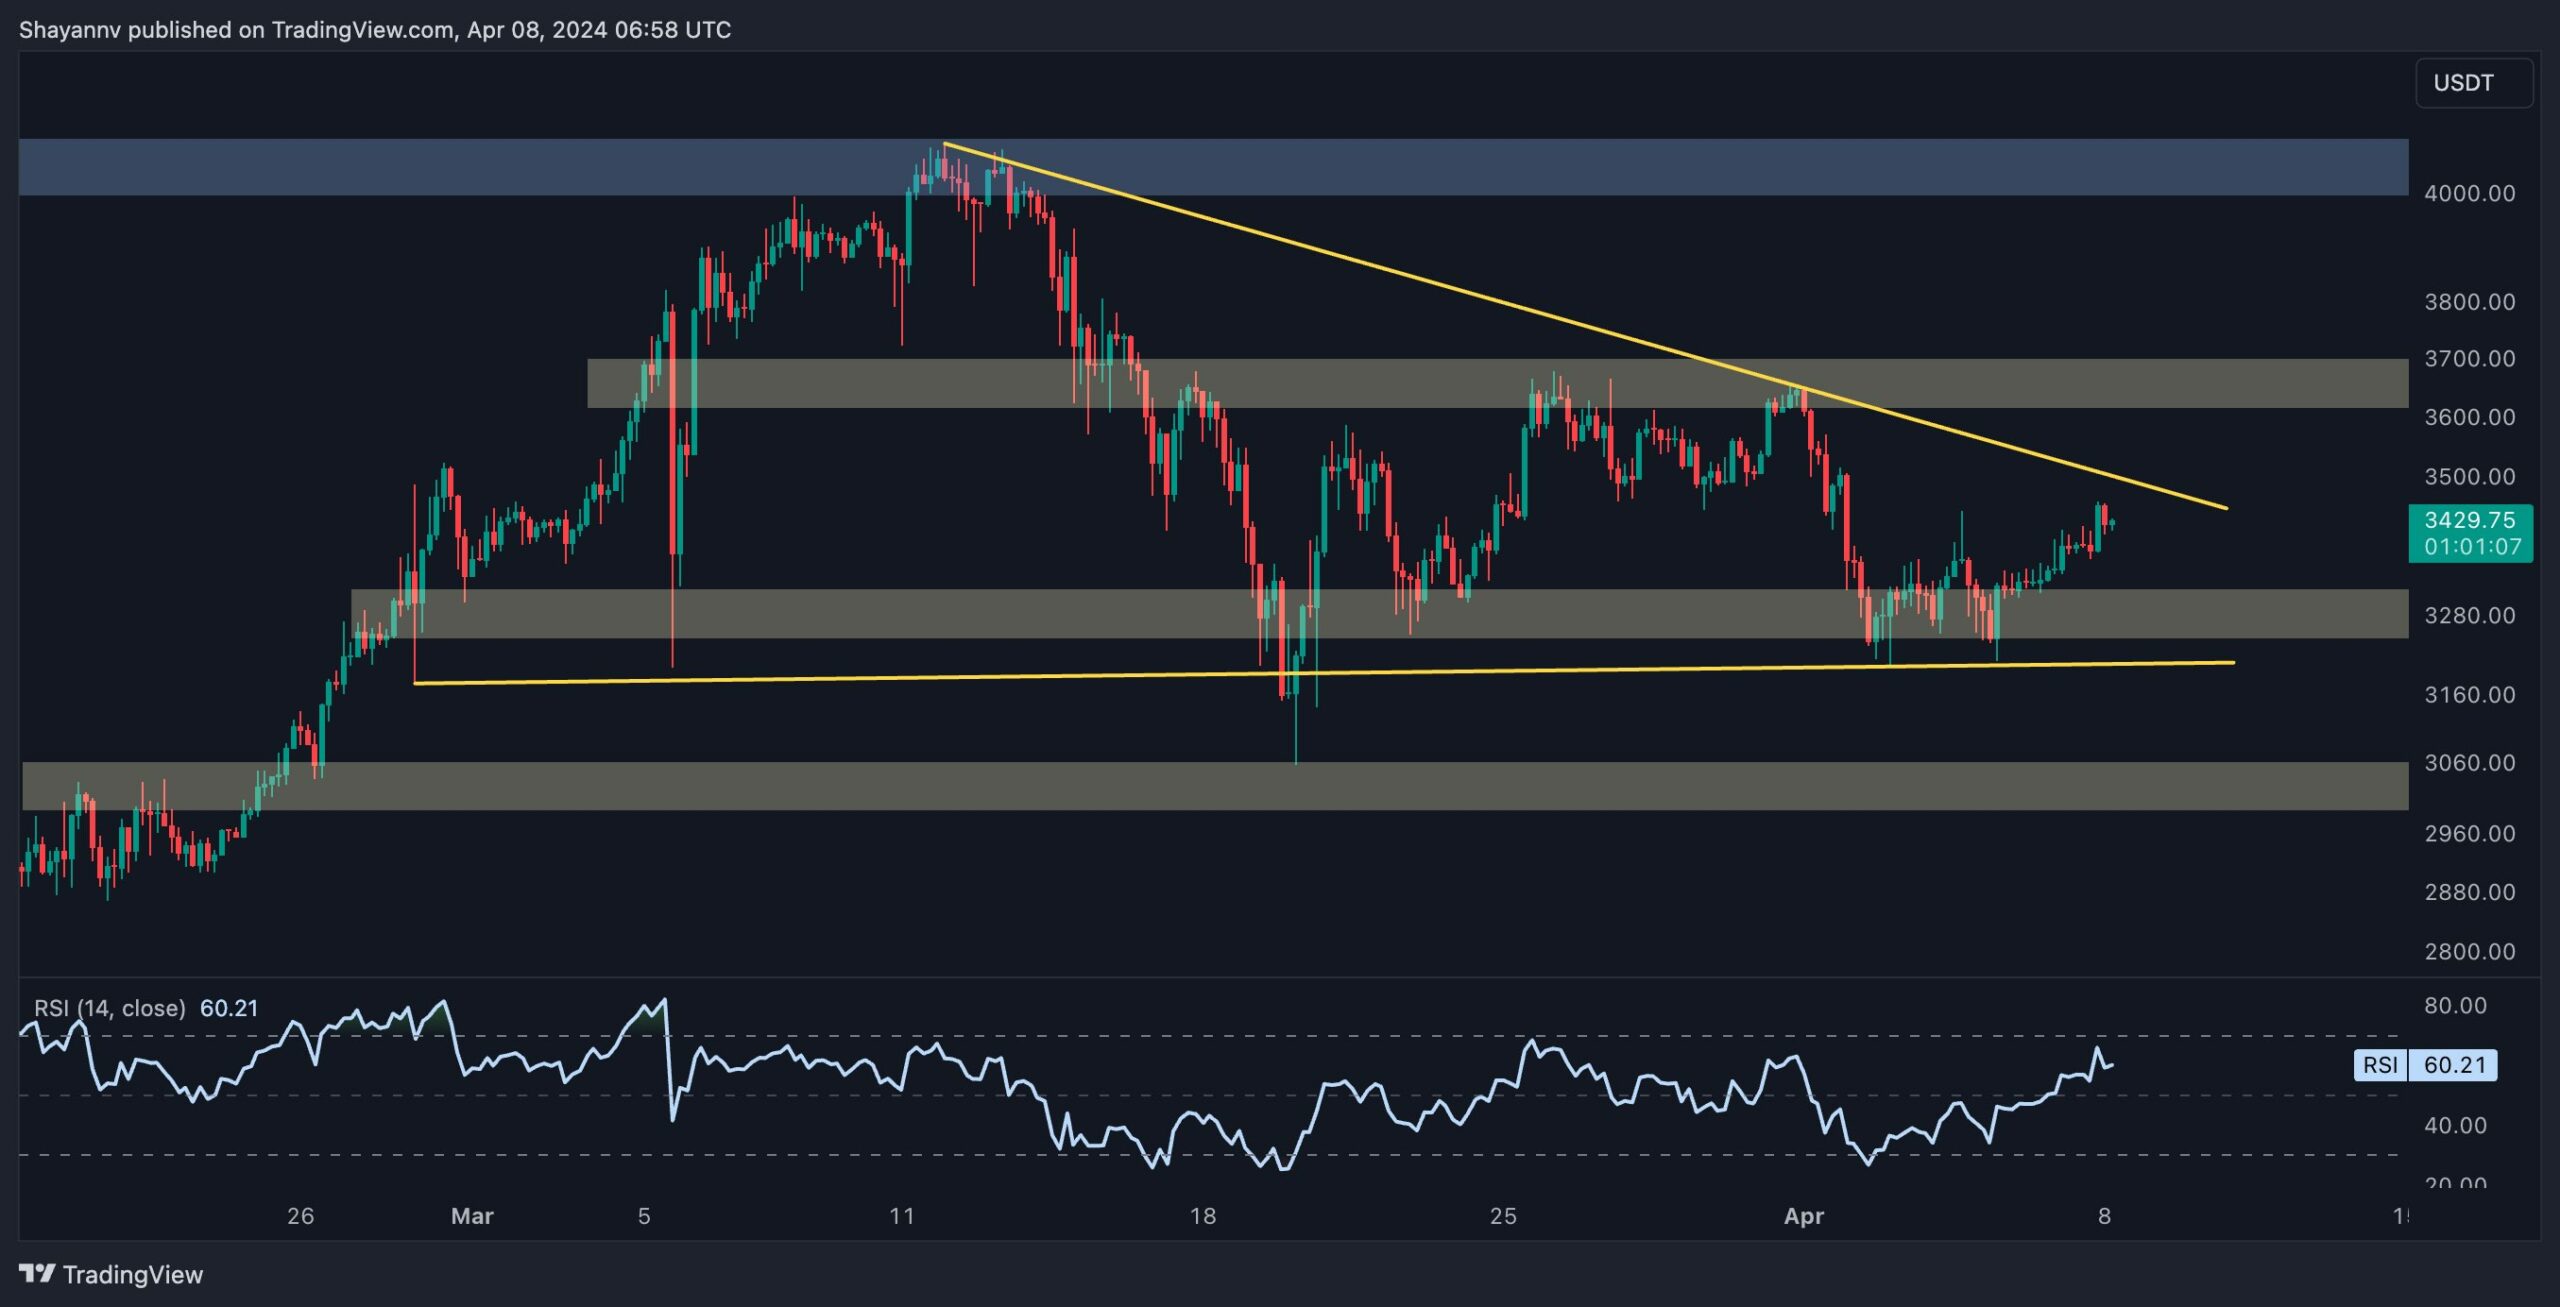
The 4-Hour Chart
Looking closely at the Ethereum price chart over the past few weeks, you’ll notice the formation of a sideways pattern called a wedge. The price is getting close to the tip of this narrowing range. Although ETH has been consolidating, recent price movements suggest strong buying interest around the important support level of $3,000. This has led to a small bounce back towards the upper limit of the wedge.
The cryptocurrency is getting close to the narrowing range of its pattern, suggesting that a significant price move up or down may occur soon. If the price falls and breaks below the lower end of this wedge, it could lead to a bearish trend towards the strong support level at $2.9K.
Despite the current market trends favoring buyers in the persistent Ethereum market, it’s plausible that the price could surpass the existing pattern, reaching a new resistance of $3,700.
In simple terms, there may be increased risk and large-scale sell-offs in the futures market, so traders should exercise caution.
On-chain Analysis
By Shayan
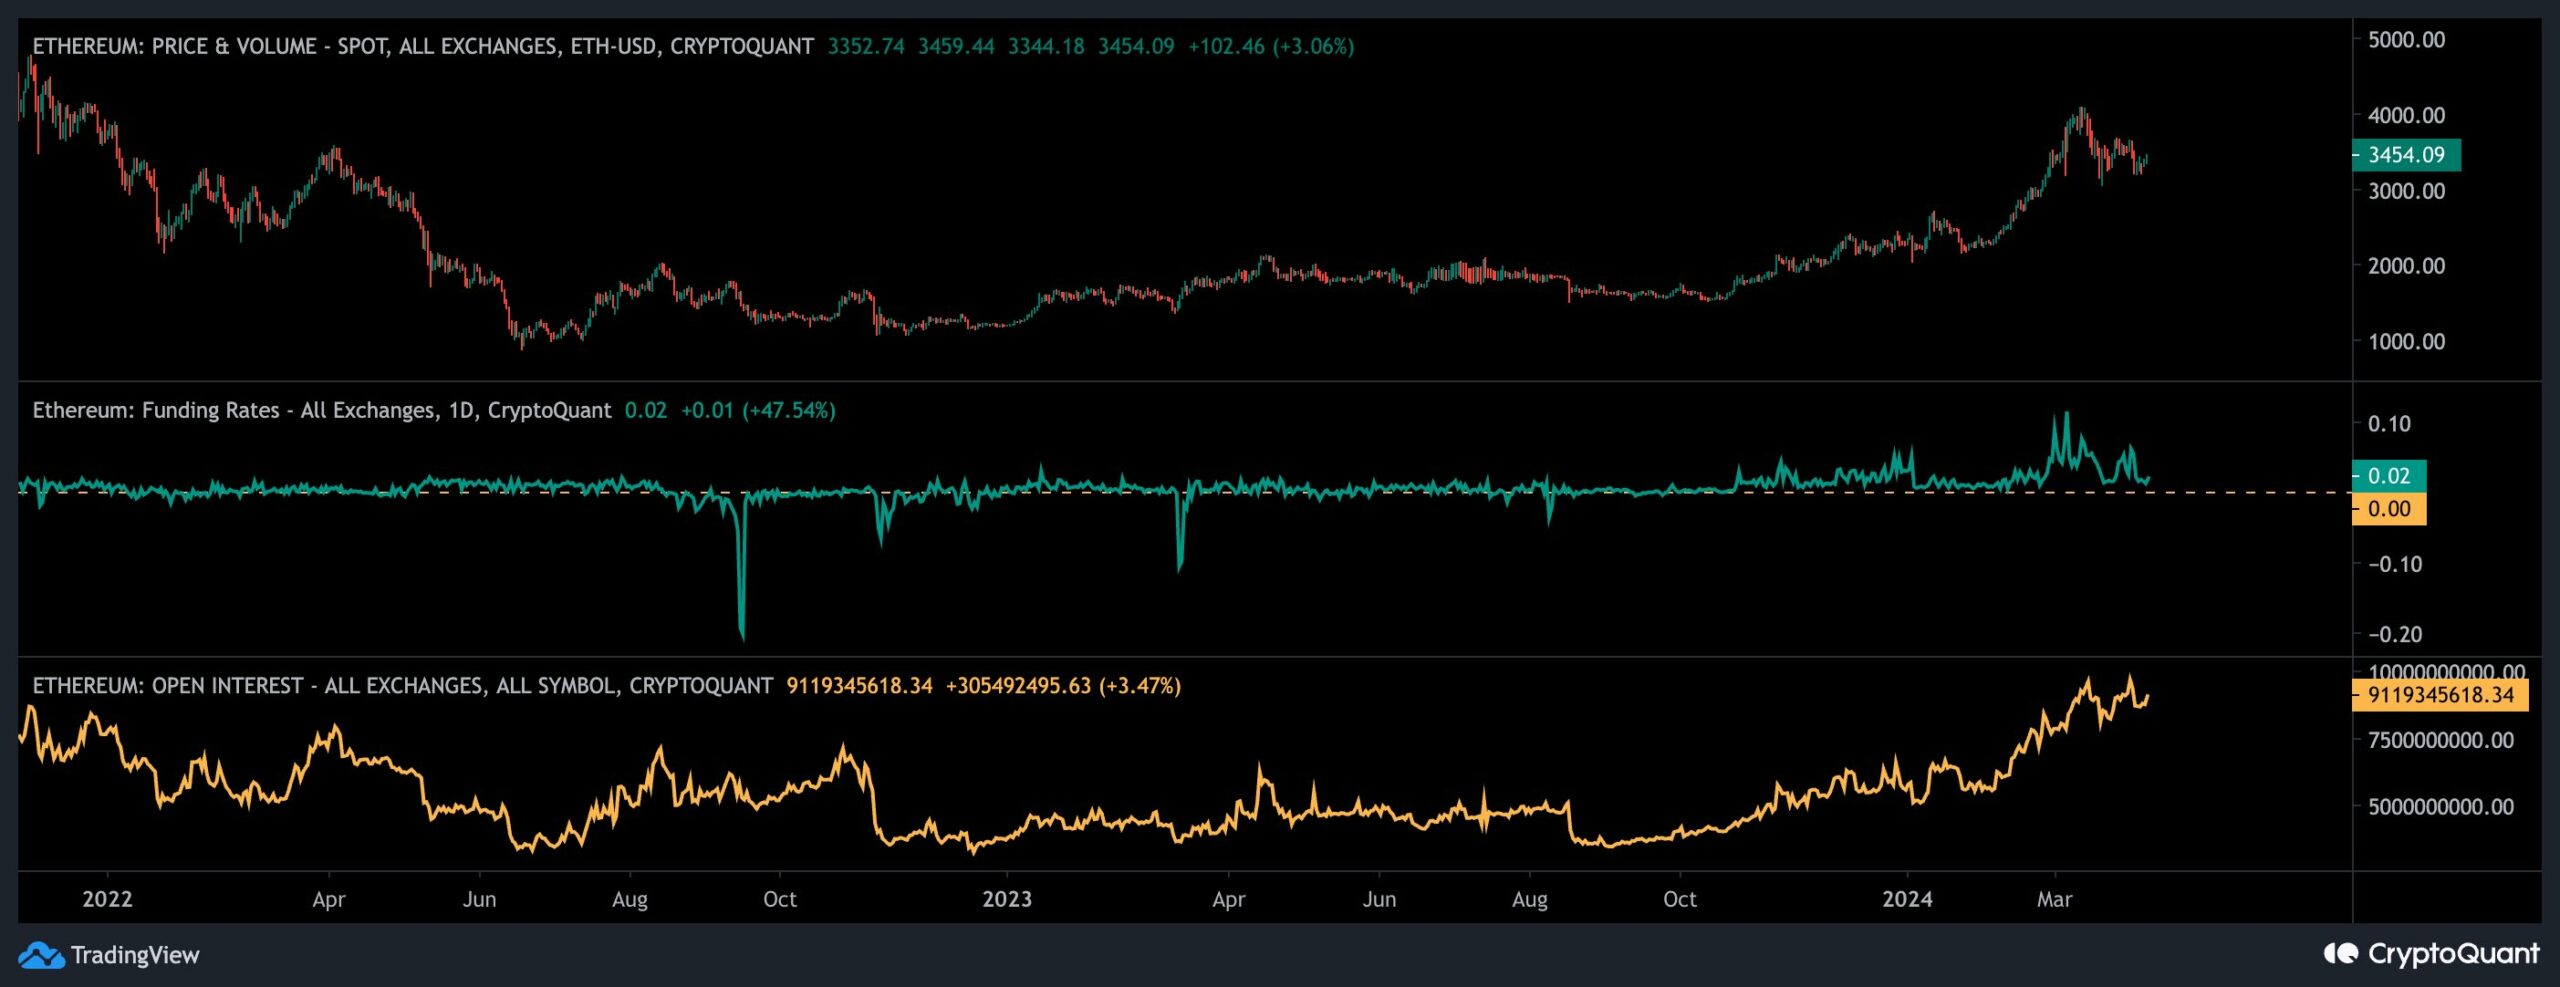
After Ethereum’s price stabilized following its quick climb near $4K, it’s important to examine market sentiment in the futures market for clues about future trends. By evaluating indicators like funding rates and Open Interest, we can gather useful information about the current attitude of traders towards Ethereum.
The funding rates indicator, combined with Open Interest, gives us an idea of how eager buyers and sellers are to carry out their trades. Generally speaking, higher than zero values in these metrics reflect a bullish attitude and increased action in the continuous market. On the other hand, negative values suggest a more conservative or bearish approach.
Looking at the graph, it’s clear that as Ethereum’s price rose significantly, so did the funding rates. This suggests that traders heavily bought Ethereum on margin, leading to the increase in funding rates. Additionally, the surge in Open Interest implies more transactions and heightened market activity, indicating a buzzing Ethereum futures market.
Based on these metrics, the Ethereum market seems ready for a notable price shift in the near future, which could lead to renewed long-term investment opportunities. This implies a positive prediction for Ethereum’s price trend and a possible surge toward its record high.
Read More
- BONE PREDICTION. BONE cryptocurrency
- AAVE PREDICTION. AAVE cryptocurrency
- Uncovering the Mystery of Red King Players in Clash Royale – What Reddit Users Have to Say
- Finding Resources in Palworld: Tips from the Community
- Discovering the Infinite Power: The Abiotic Factor that Could Change Everything
- Skull and Bones: Navigating the Quest for Extra Teeth in the Game
- The 10 Best Movies of 2024 (So Far)
- UFO PREDICTION. UFO cryptocurrency
- The Last Epoch Dilemma: Confronting the Gold Dupe Crisis
- Hazardous: Landing a Stunt With EVERY Vehicle In GTA 5 #6
2024-04-08 18:36