A recent report from Galaxy Research suggests Bitcoin might still fall further in price. The report uses both traditional market analysis and blockchain data to identify potential low points.
Summary
- Galaxy says Bitcoin’s four-year cycle remains active, but each cycle is showing smaller price swings.
- The report places Bitcoin’s base-case bottom between $40,000 and $46,000 using onchain cycle data.
- Only four of 13 bottom indicators have triggered, suggesting Bitcoin may need more time.
According to Galaxy’s Alex Thorn, Bitcoin’s typical four-year price pattern seems to be continuing, although the price swings within that cycle are getting smaller. A recent report suggests the pattern hasn’t broken down, but the difference between peak and trough prices is becoming less dramatic.
According to Galaxy Head of Firmwide Research Alex Thorn, the typical four-year market cycle is still happening, but it’s happening more quickly now.
This report examines Bitcoin’s historical price movements, looking at how it has recovered from previous low points, especially after events called ‘halvings’ and reaching peak prices before falling again. In past cycles, Bitcoin’s price dropped by as much as 85%, 84%, or 77% from peak to trough. Currently, the price has fallen about 51% from its recent high.
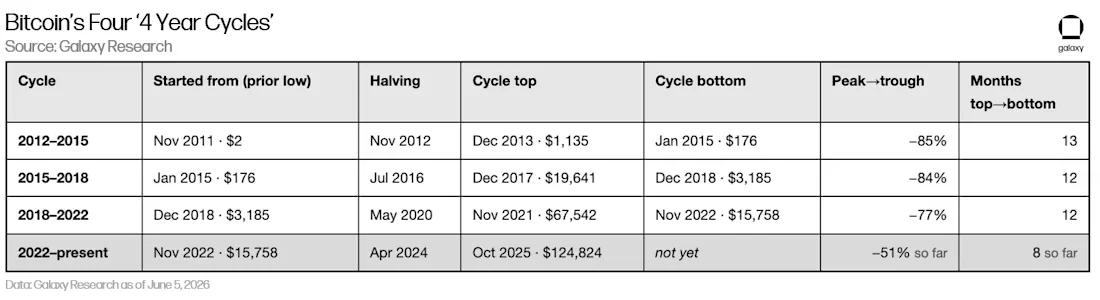
We’re currently about eight months removed from the peak reached in October 2025. Based on past market downturns, Galaxy estimates that the lowest point of this bear market will likely occur around late 2026, as previous lows typically arrive 12 to 13 months after a peak.
Bitcoin calm top changes bottom math
According to Galaxy, the predicted peak in Bitcoin’s price around October 2025 showed surprisingly few warning signs, based on data tracked on the blockchain. Typically, eleven different indicators would suggest a peak, but only two showed even minor signals.
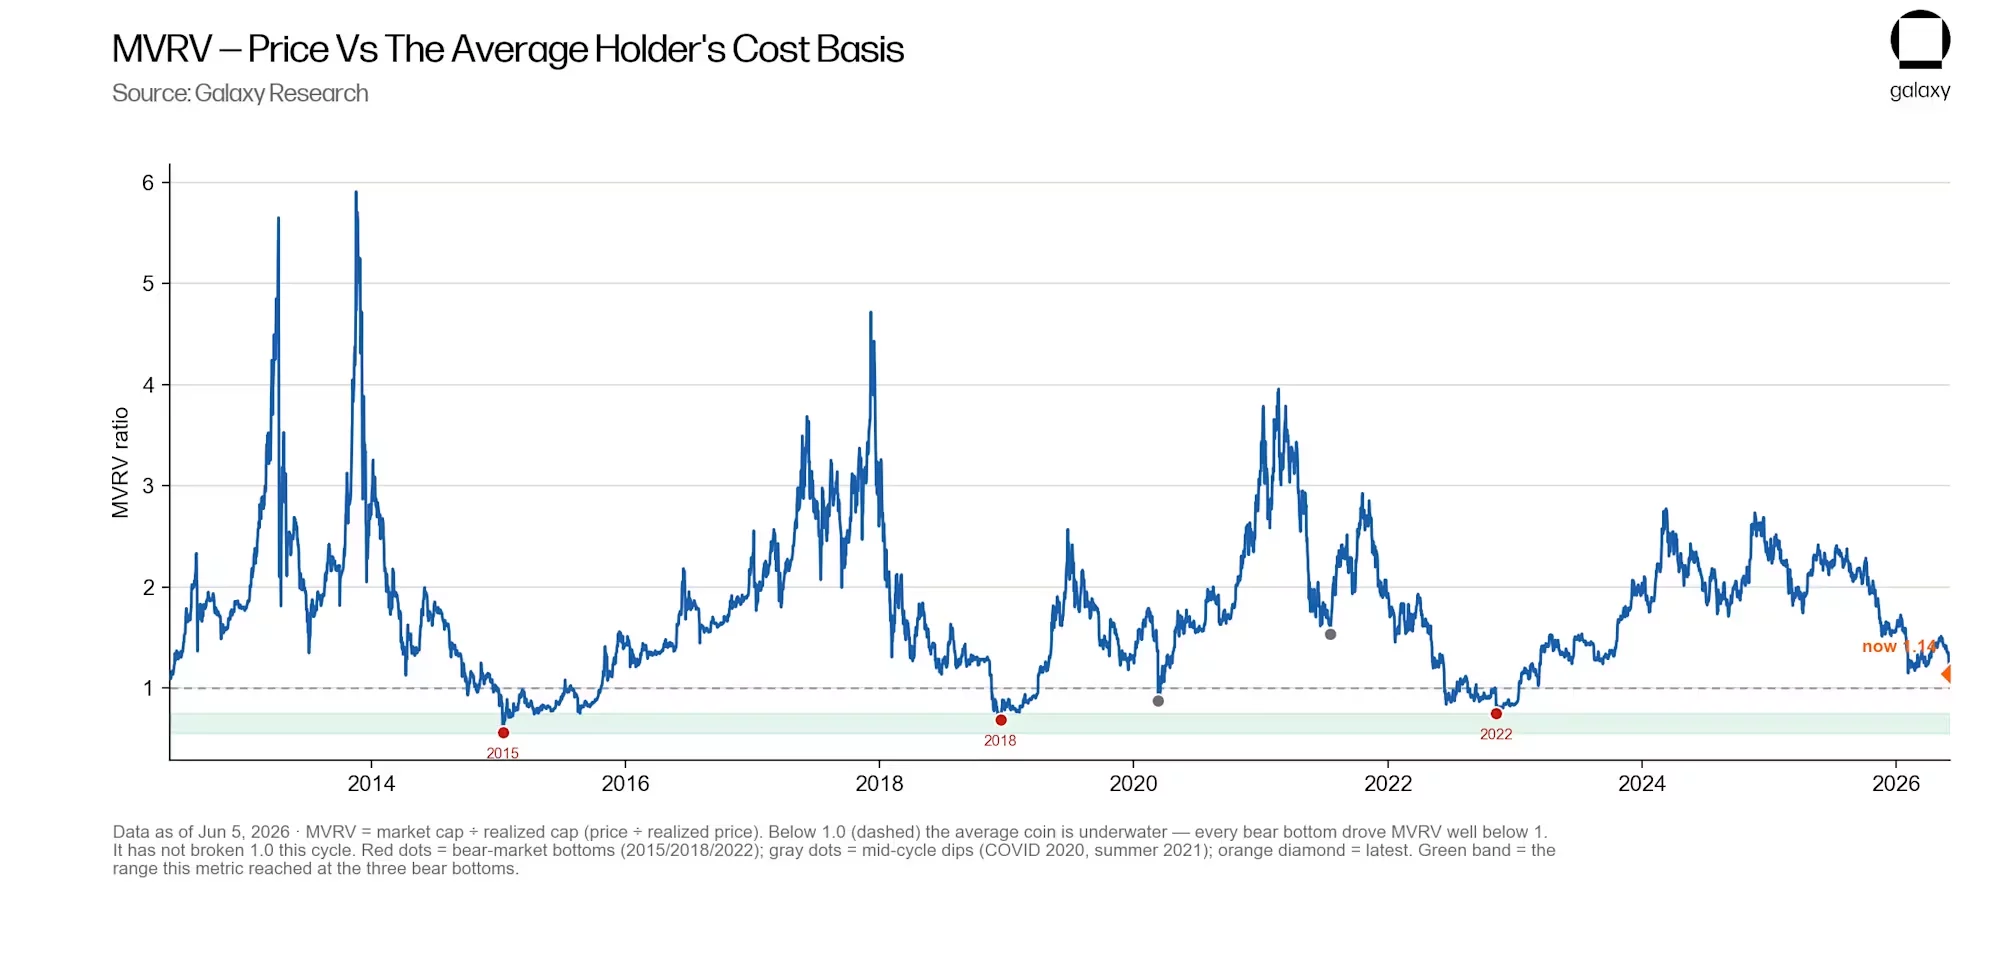
According to the report, Bitcoin’s MVRV ratio reached a high of 2.29 in this current market cycle. This is lower than previous peaks, which ranged from 2.93 to 5.91, suggesting less widespread excitement among investors at the top of the market.
The Pi Cycle Top indicator didn’t signal a peak in October 2025, which Galaxy noted was the first time this had happened during a significant Bitcoin cycle high.
The recent stabilization in Bitcoin’s price is significant because it means investors generally bought in closer to its peak price. According to Galaxy, this puts the average purchase price around 43.7% below its previous all-time high, which is higher than it has been at similar points in past market cycles.
Galaxy maps Bitcoin bottom ranges
Galaxy Research estimates that Bitcoin could bottom out between $40,000 and $46,000. This prediction is based on the idea that each new cycle tends to find a low point closer to its actual value.
If the market experiences a significant drop, like those seen in past bear markets, the price could fall to between $30,000 and $37,000. However, if demand remains consistent, the price might only drop to between $51,000 and $54,000.
“Overall, our data analysis suggests a Q4 2026 BTCUSD bottom,” said Thorn.
The report finds that the previous rule of thumb – that Bitcoin needs to drop 75% to 85% from its peak price – is likely no longer accurate. Galaxy Digital argues this is because current market conditions, with less dramatic price swings and higher average purchase prices, haven’t been considered in that calculation.
As of June 12, Bitcoin was trading around $63,437, according to data from crypto.news. This price is above the lowest point Galaxy Digital predicted, but close to a four-year average that analysts see as a crucial long-term support level.
Bottom signals remain incomplete
As I’ve been analyzing the current market downturn, I’ve noticed that only four out of thirteen key indicators typically seen at market bottoms have actually triggered. What’s particularly noteworthy is that we haven’t yet seen the strongest signals that historically confirm a true bottom is in place.
Currently, only 4 out of 13 indicators that typically signal a market bottom have appeared, and 3 of those are relatively weak signals. The strongest indicators – like the price falling below the cost basis, significant losses for investors, consistent selling, and a final wave of capitulation – haven’t occurred yet. Historically, all 13 of these signals have eventually appeared before a market bottom.
— Alex Thorn (@intangiblecoins) June 12, 2026
Currently, the market isn’t showing the typical signs of a bottom. These missing signals include Bitcoin trading below what investors originally paid for it, widespread unrealized losses, and consistent selling. Previous market lows featured more of these conditions happening at the same time, suggesting we haven’t reached a definitive bottom yet.
Galaxy pointed out that Bitcoin hasn’t dropped below its initial purchase price during this market cycle. The current MVRV ratio, a measure of market value to realized value, has remained around 1.14, unlike previous market lows which fell below 1.0.
The report also cautioned that prices can drop further during times of panic selling. When coins are sold at a loss, the average cost of those coins decreases, potentially lowering the overall estimated low price.
ETF flows and market stress still matter
In my research, I’ve built a model to understand market behavior, but it’s important to note what it *doesn’t* include. I specifically left out factors like political happenings, regulatory changes, or broader geopolitical events. Instead, I’m concentrating on things like past prices, when trades happen, how things are valued, the pressure on miners, trend indicators, and what people are saying – basically, the data directly related to market activity itself.
This is important because Bitcoin is facing challenging economic conditions right now. As we previously covered, the price drop in June was caused by a combination of factors, such as money leaving exchange-traded funds (ETFs), increased tensions between the U.S. and Iran, the Federal Reserve’s policies, and the forced closing of leveraged positions.
Before the recent price drop, demand for SpaceX stock and a shift in investment strategies had already reduced the amount of money available in the crypto market. This meant Bitcoin was more vulnerable to price drops when selling pressure increased.
Bitcoin’s price recently recovered to around $63,400 after optimism about a potential agreement with Iran faded, reducing some of the market’s risk aversion. However, money leaving exchange-traded funds (ETFs) and the way options are set up continue to keep the $60,000 level as a key price floor.
Read More
- Netflix’s Little House On The Prairie Reboot: Release Date, Cast & Everything We Know
- Off Campus Season 1 Soundtrack Guide
- YouTuber arrested after viral AI bodycam videos spark real police complaints
- Silver Rate Forecast
- Prime Video’s New R-Rated Spy Thriller Is Officially No.1 On Streaming Despite Poor Reviews
- EUR ZAR PREDICTION
- Gold Rate Forecast
- Peaky Blinders: The Immortal Man’s Tommy Shelby Is a Better Father Than Michael Corleone
- Brent Oil Forecast
- Bulgakov’s Take: Koreans Bet the Farm on Chips, Crypto, and Chaos
2026-06-12 16:38