Bitcoin hovers at the gilded threshold of its twenty-four-hour empire, a lantern swinging in a wind-slashed corridor where confidence is rationed by committee and never enough. At $77,989, the creature looks constructive, though its short-term zeal drinks coffee and pretends to be decisive.
Key Takeaways:
- Bitcoin clings to $77,989 on April 26, 2026, lounging near the exalted $78K with signals politely neutral.
- TradingView data shows RSI 64 and MACD 2,047, signaling momentum exists but binds itself with a bow rather than a roar.
- Bitcoin eyes $79,500 resistance; break or drop below $77,200 sets next directional move.
Bitcoin Chart Outlook
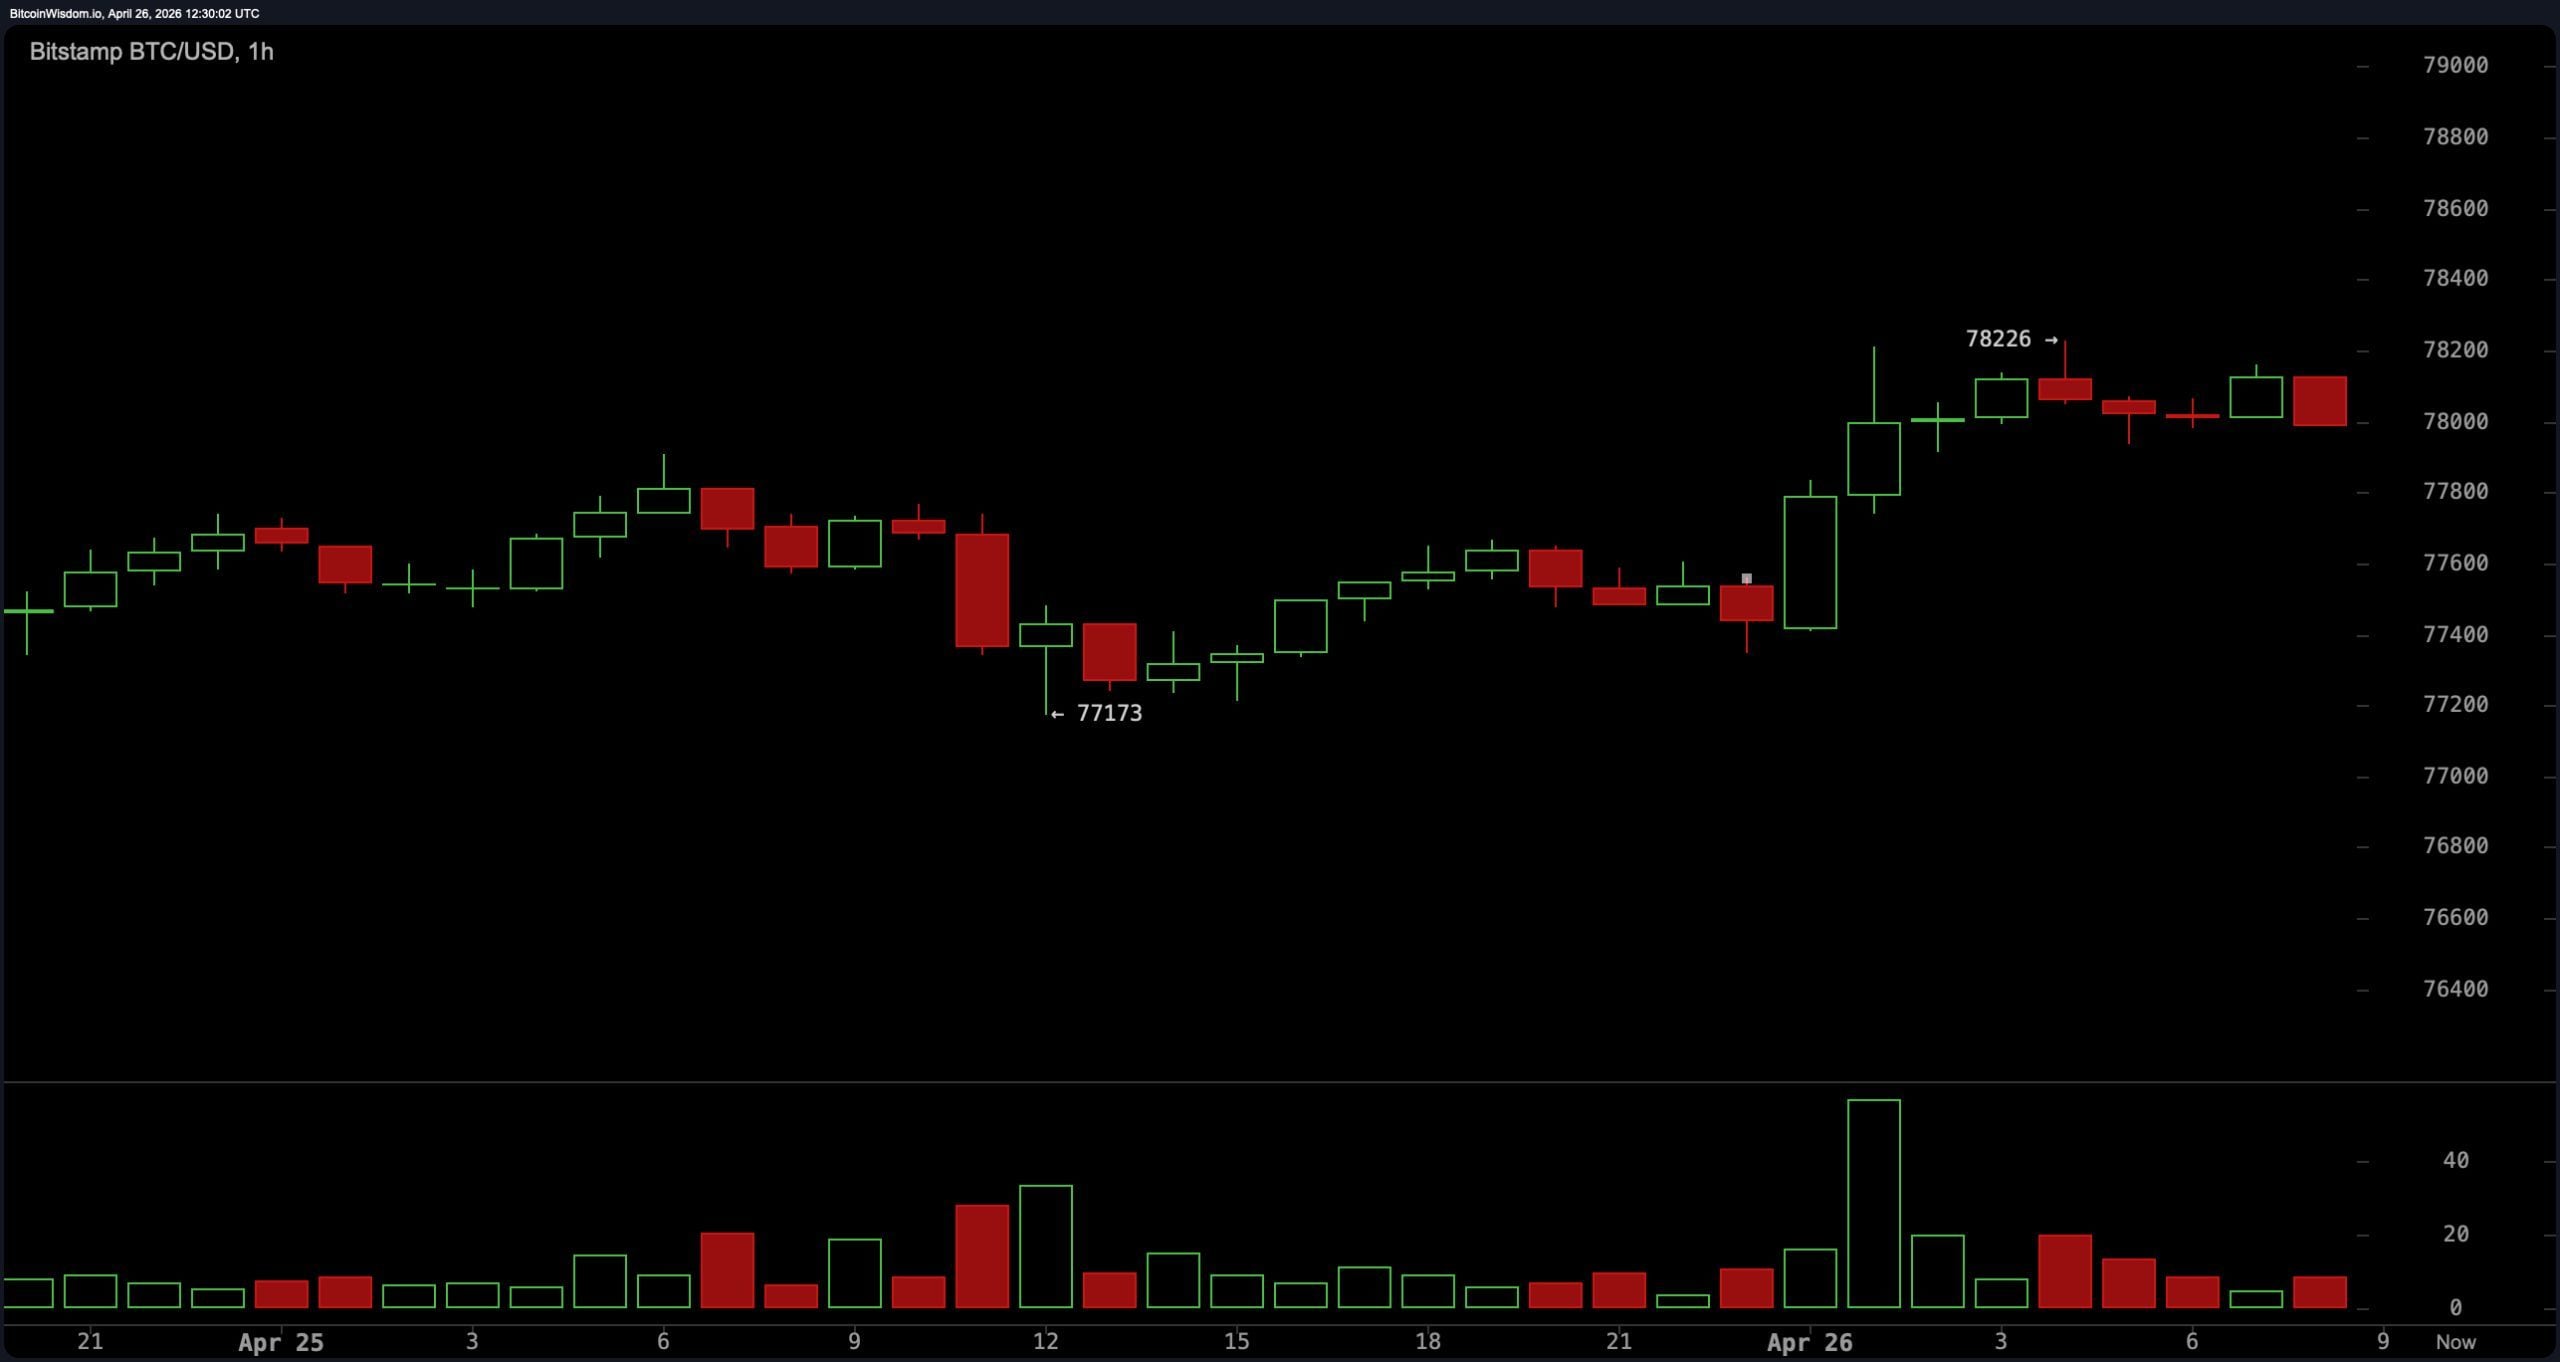
The 1-hour bitcoin chart shows tight consolidation, with local resistance between $78,200 and $78,500 and support between $77,200 and $77,400, as if the market is waiting for a polite knock on the door before entering the room of decisions.
The hourly chart shows the latest sharp push stalled quickly, suggesting buyers are losing short-term aggression near the top of the range. With price still inside the broader $77,237 to $78,177 intraday band, the setup favors patience over impulsive positioning.
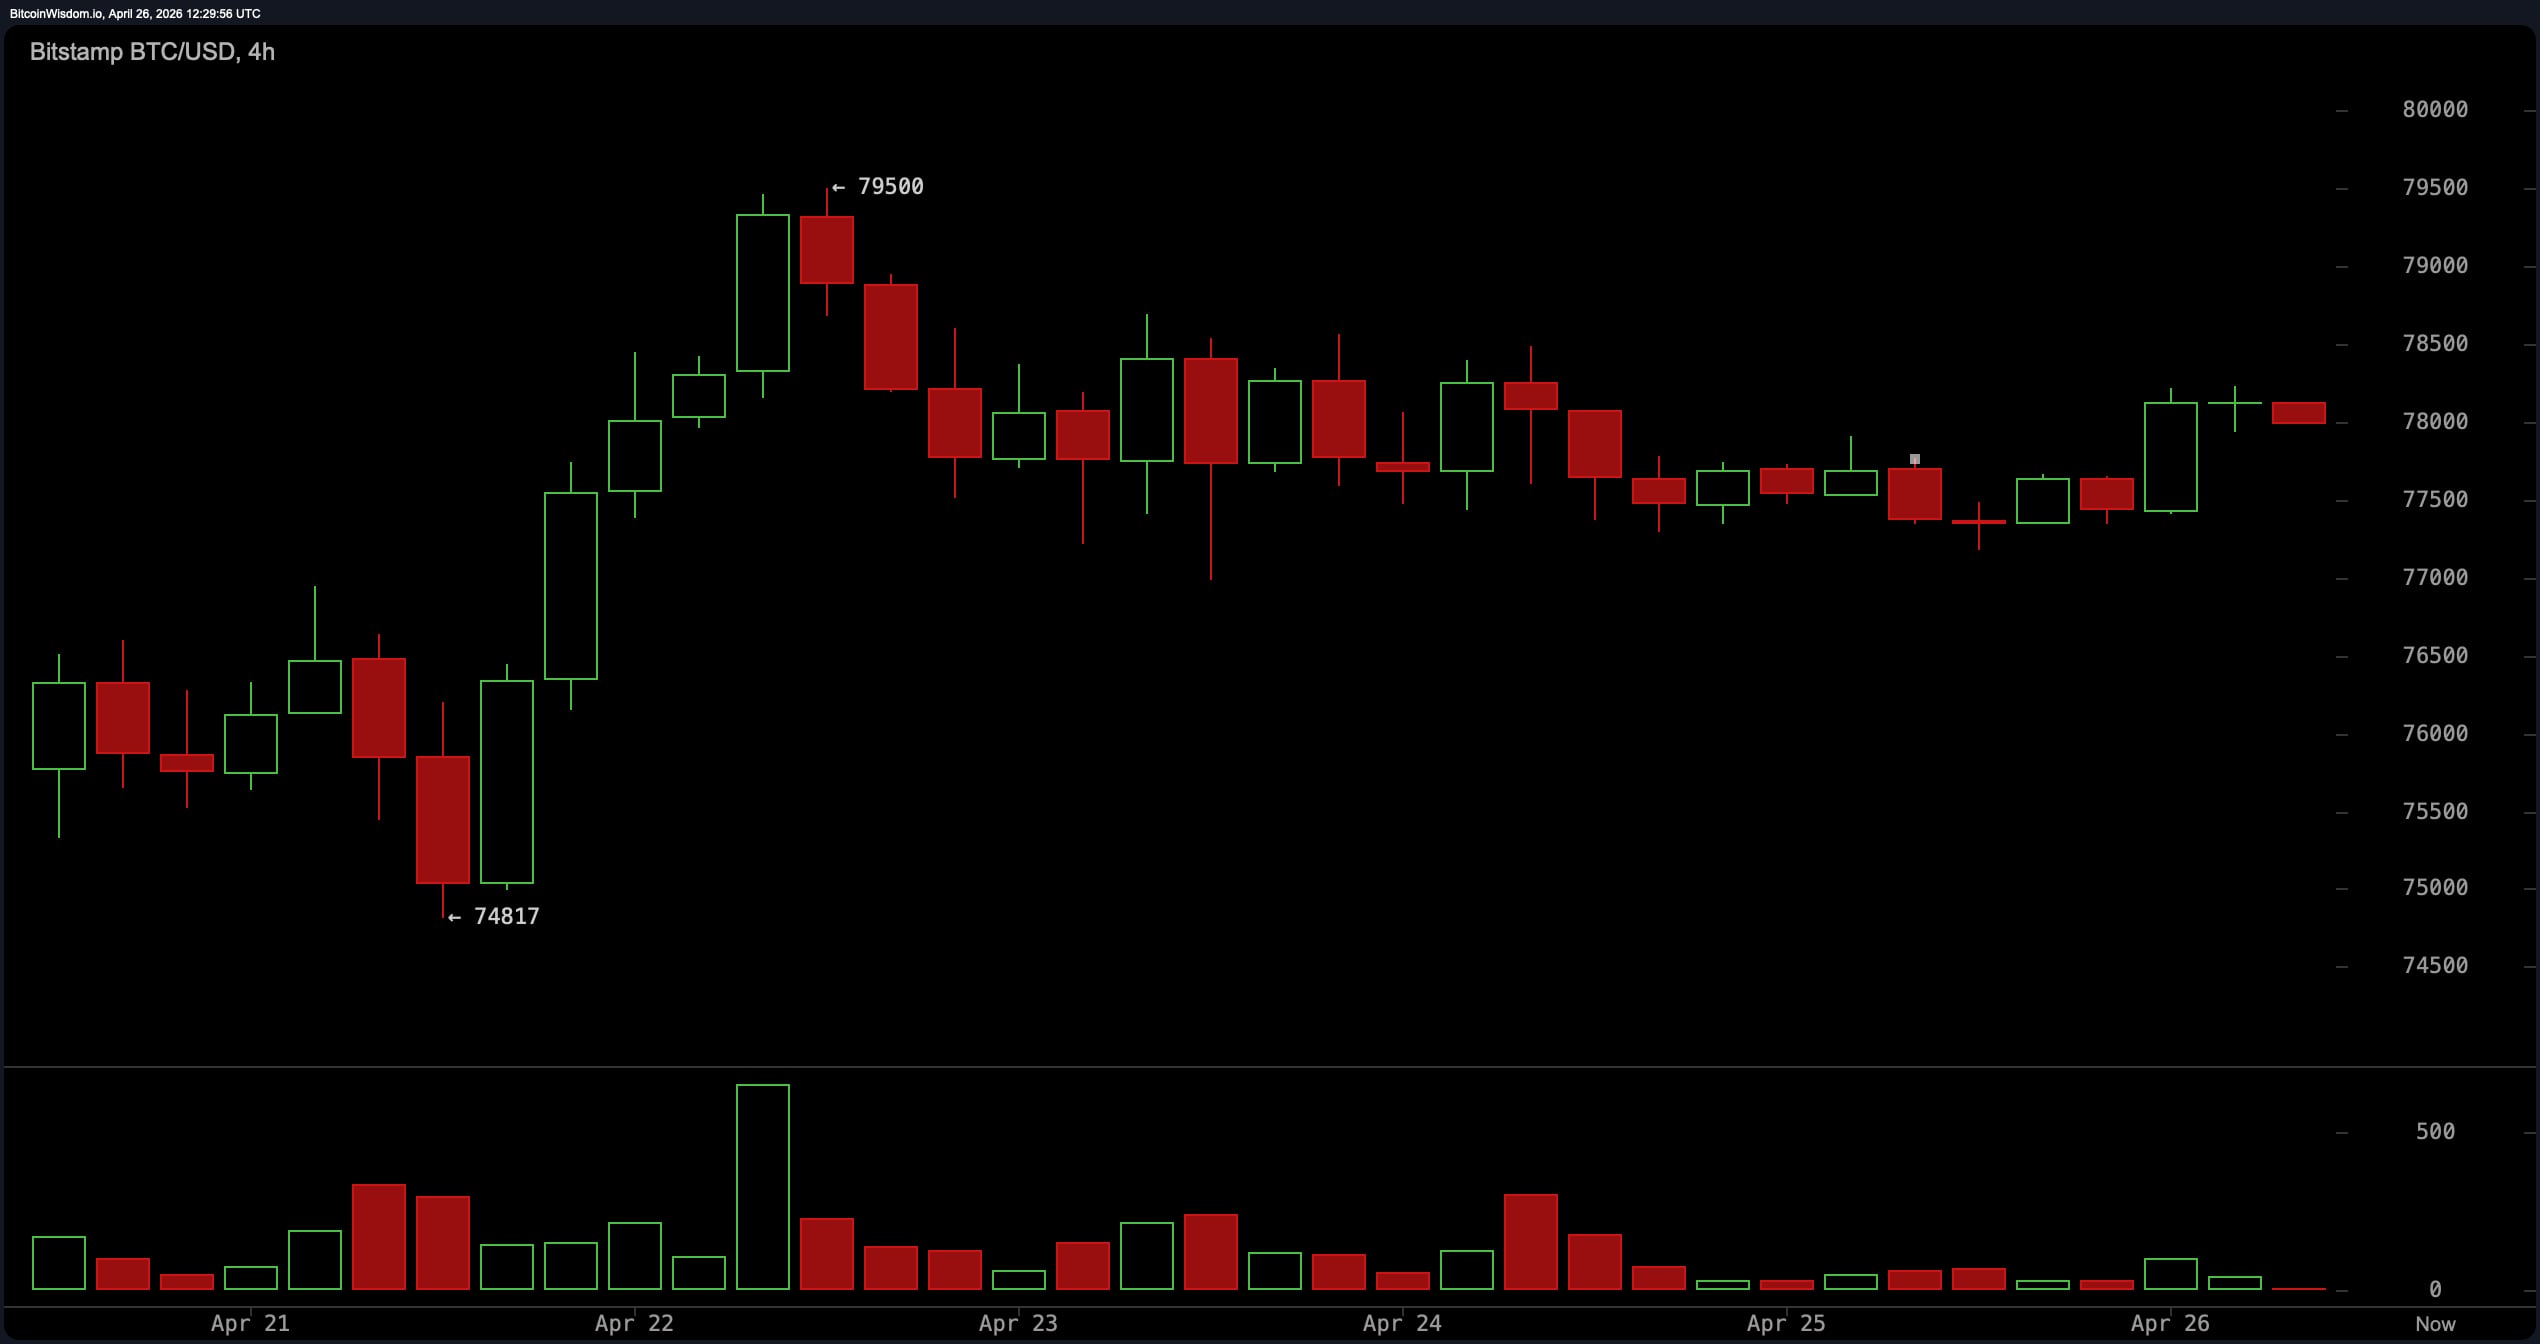
The 4-hour bitcoin chart remains range-bound after rejection near $79,500, with the upper zone sitting between $79,000 and $79,500 and the lower boundary near $77,000 to $77,300. Price action has been choppy, with wicks on both sides pointing to a liquidity-sweep environment. In practical terms, this is a mean-reversion structure where directional conviction is limited until a clean break occurs.
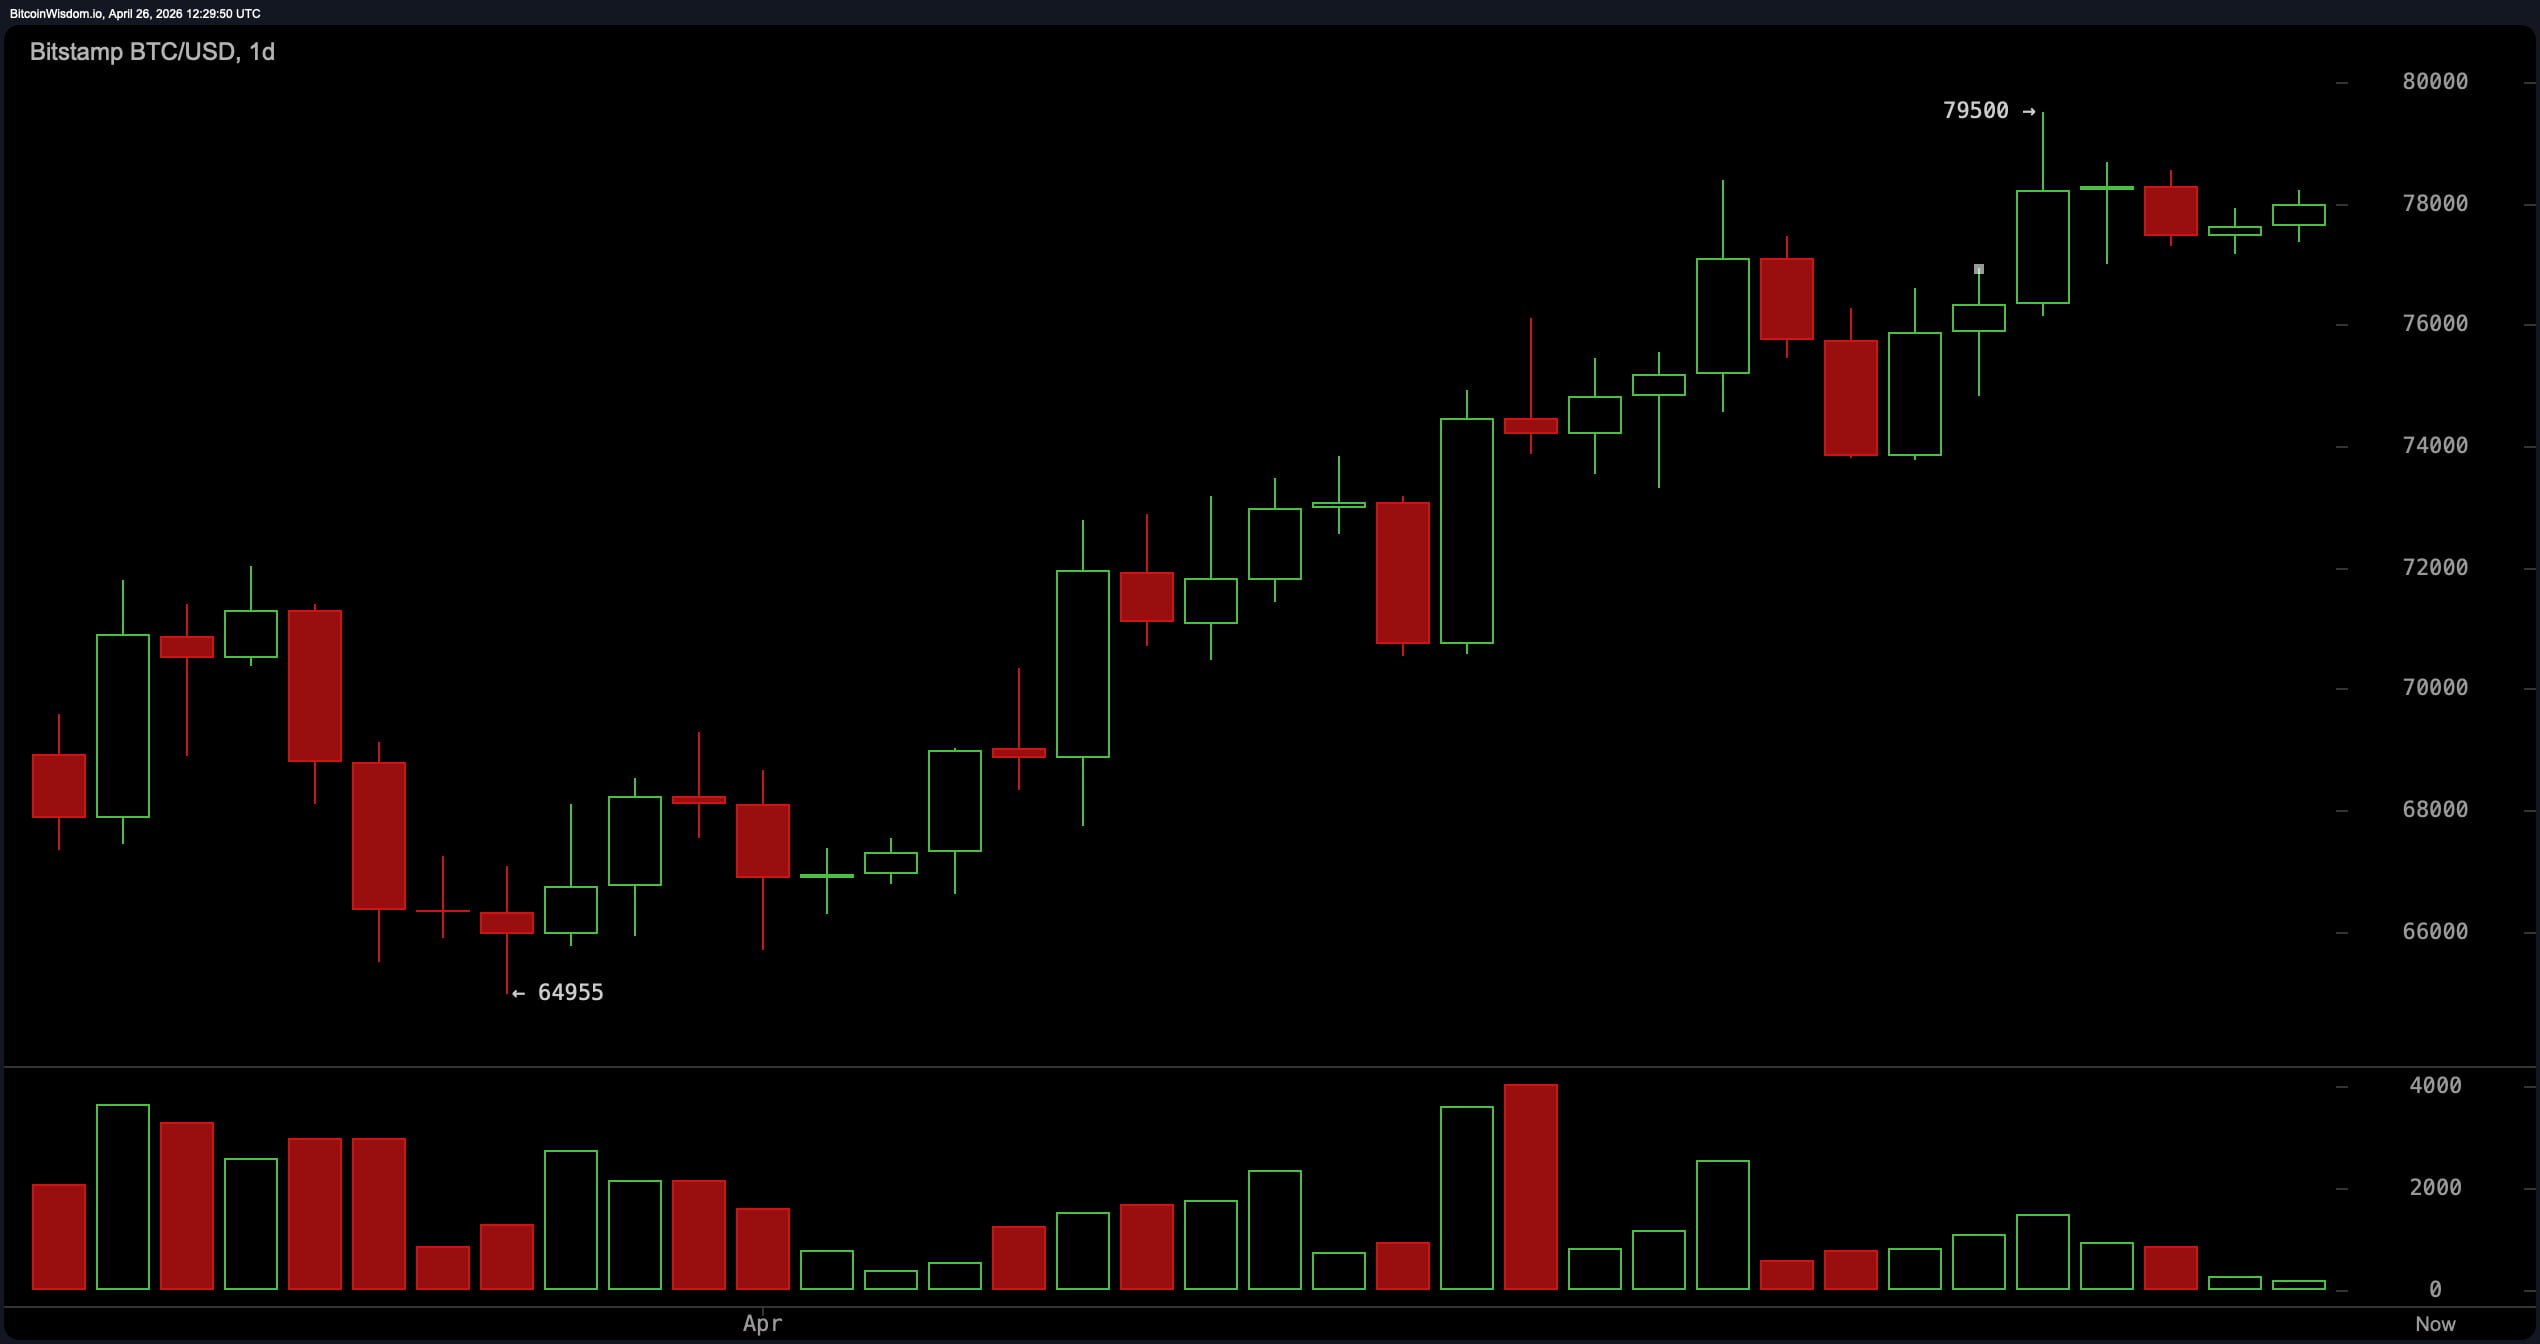
The daily bitcoin chart retains a bullish macro structure, marked by higher highs and higher lows from roughly $65,000 to $79,500. Yet Bitcoin is consolidating near highs as volume declines on the latest upward move, indicating that momentum is slowing rather than accelerating. Resistance remains firm at $79,500, while support is layered around $75,000 and $73,500, preserving the broader uptrend but hinting at potential pause or retracement.
//www.bitcoin.com/get-started/rsi-relative-strength-index-crypto-trading-signal/”>relative strength index
(
RSI
) stands at 64, the Stochastic at 80, the commodity channel index (CCI) at 101, the average directional index (ADX) at 25, and the Awesome oscillator (AO) at 5,790 – all reflecting neutral conditions.
Momentum registers at 2,827, and the moving average convergence divergence ( MACD) level is 2,047, both positive but not decisive. In short, momentum exists, but it is hardly pounding the table.
If bitcoin maintains support above the $77,200 zone and reclaims momentum with a sustained move beyond $78,178, the structure supports continuation toward the $79,500 resistance. A confirmed break above that level, particularly on expanding volume, would reinforce the broader uptrend and open the door for further upside extension. The underlying trend remains constructive – it just needs to prove it still has energy.
Bear Verdict:
Failure to hold the $77,200 support region exposes bitcoin to a rotation back toward the $75,000 level, with deeper support near $73,500. Combined with fading volume on the daily chart and persistent rejection near $79,500, this scenario reflects a market that may require a reset before attempting higher levels. In other words, gravity has not been canceled – it is simply waiting for its moment.
Read More
- Netflix’s Little House On The Prairie Reboot: Release Date, Cast & Everything We Know
- Off Campus Season 1 Soundtrack Guide
- YouTuber arrested after viral AI bodycam videos spark real police complaints
- Silver Rate Forecast
- Prime Video’s New R-Rated Spy Thriller Is Officially No.1 On Streaming Despite Poor Reviews
- Brent Oil Forecast
- Peaky Blinders: The Immortal Man’s Tommy Shelby Is a Better Father Than Michael Corleone
- Gold Rate Forecast
- EUR ZAR PREDICTION
- Bulgakov’s Take: Koreans Bet the Farm on Chips, Crypto, and Chaos
2026-04-26 16:27