This month has seen a dramatic intensification in the rivalry between gold and silver, akin to a soap opera where the plot thickens at every turn. Silver (XAG/USD) has soared with an audacious 15.47% leap, while gold (XAU/USD) can only muster a mere 6% gain, as Brent crude slips below $99 amidst unending de-escalation talks-who knew oil could be so chill?
The widening gap is no mere happenstance. Proprietary indicators, options flows, and chart structures coalesce like conspiratorial whispers in a crowded café, each suggesting that silver is the belle of the ball, though one stubborn structural force still clings to gold’s coattails, refusing to let go.
Three Forces Are Separating Gold from Silver
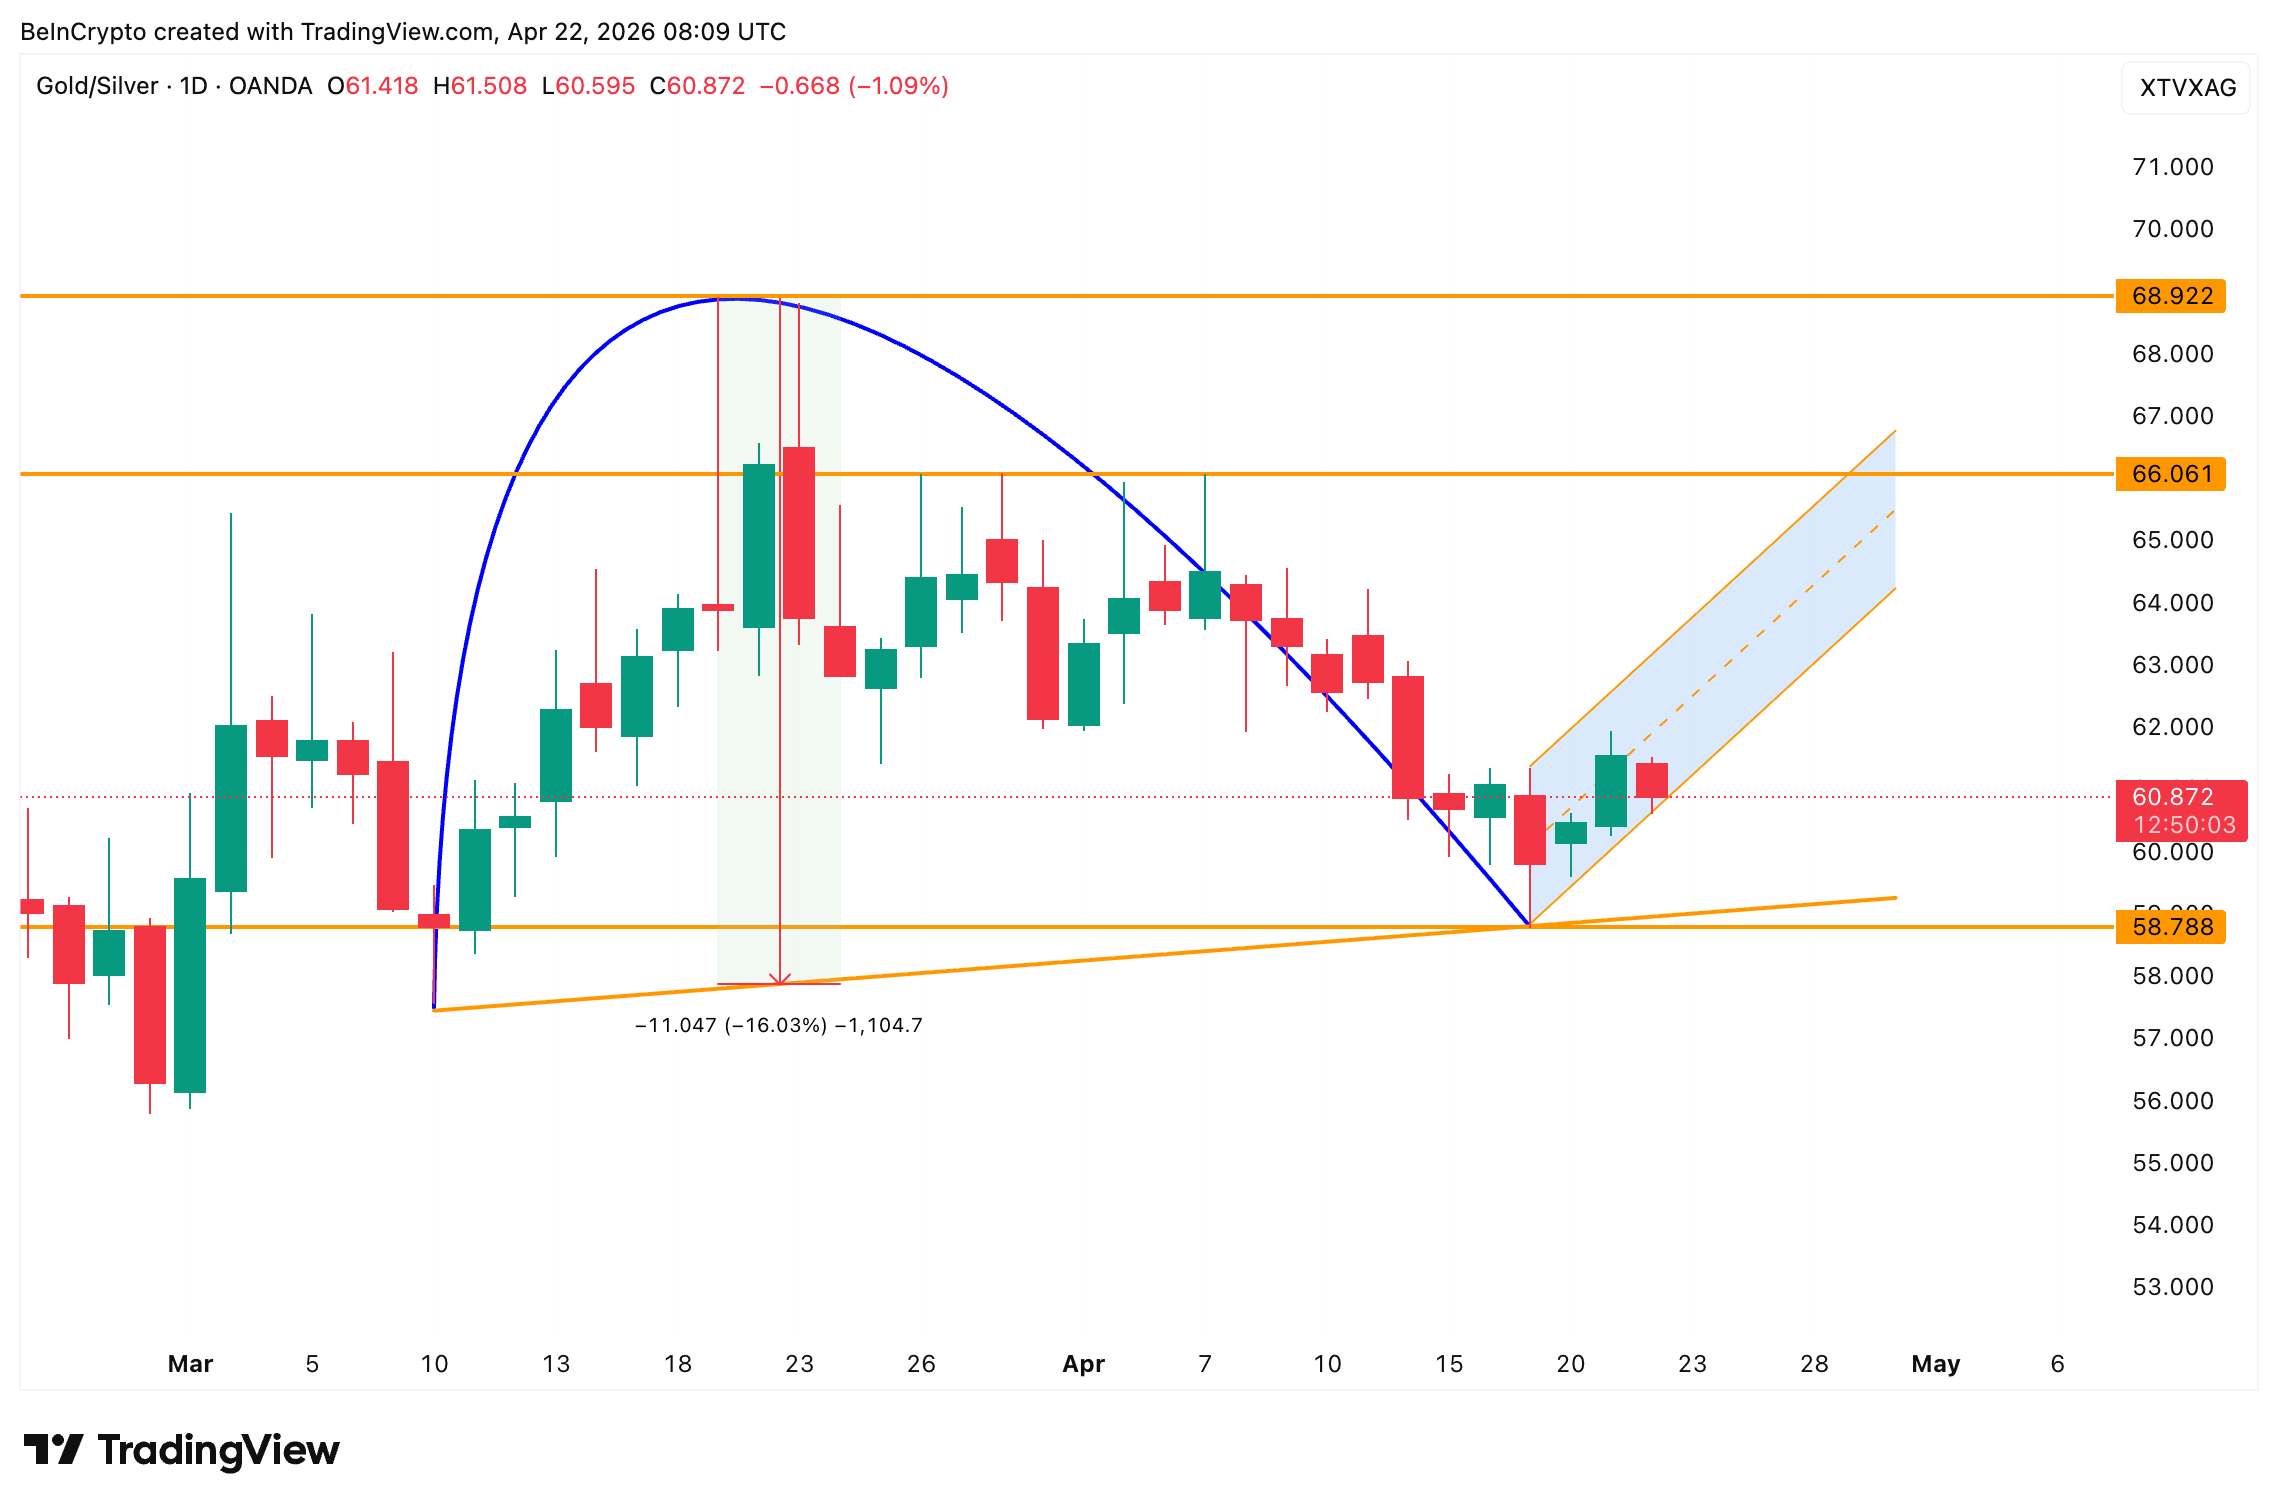
The gold-silver ratio has taken on the shape of an inverted cup and handle since late March, as if it were desperately trying to impress its dates. Now it presses against the handle’s lower trendline-think of it as a precarious balancing act. A clean breakdown would extend silver’s lead, while reclaiming the upper boundaries would make the party a tad more interesting for gold.
Its handle low hovers near 58, and breaking below that would target a further 16% compression-quite the plot twist, extending silver’s lead. But should it reclaim 68, we might just see a rerun of gold’s glory days.
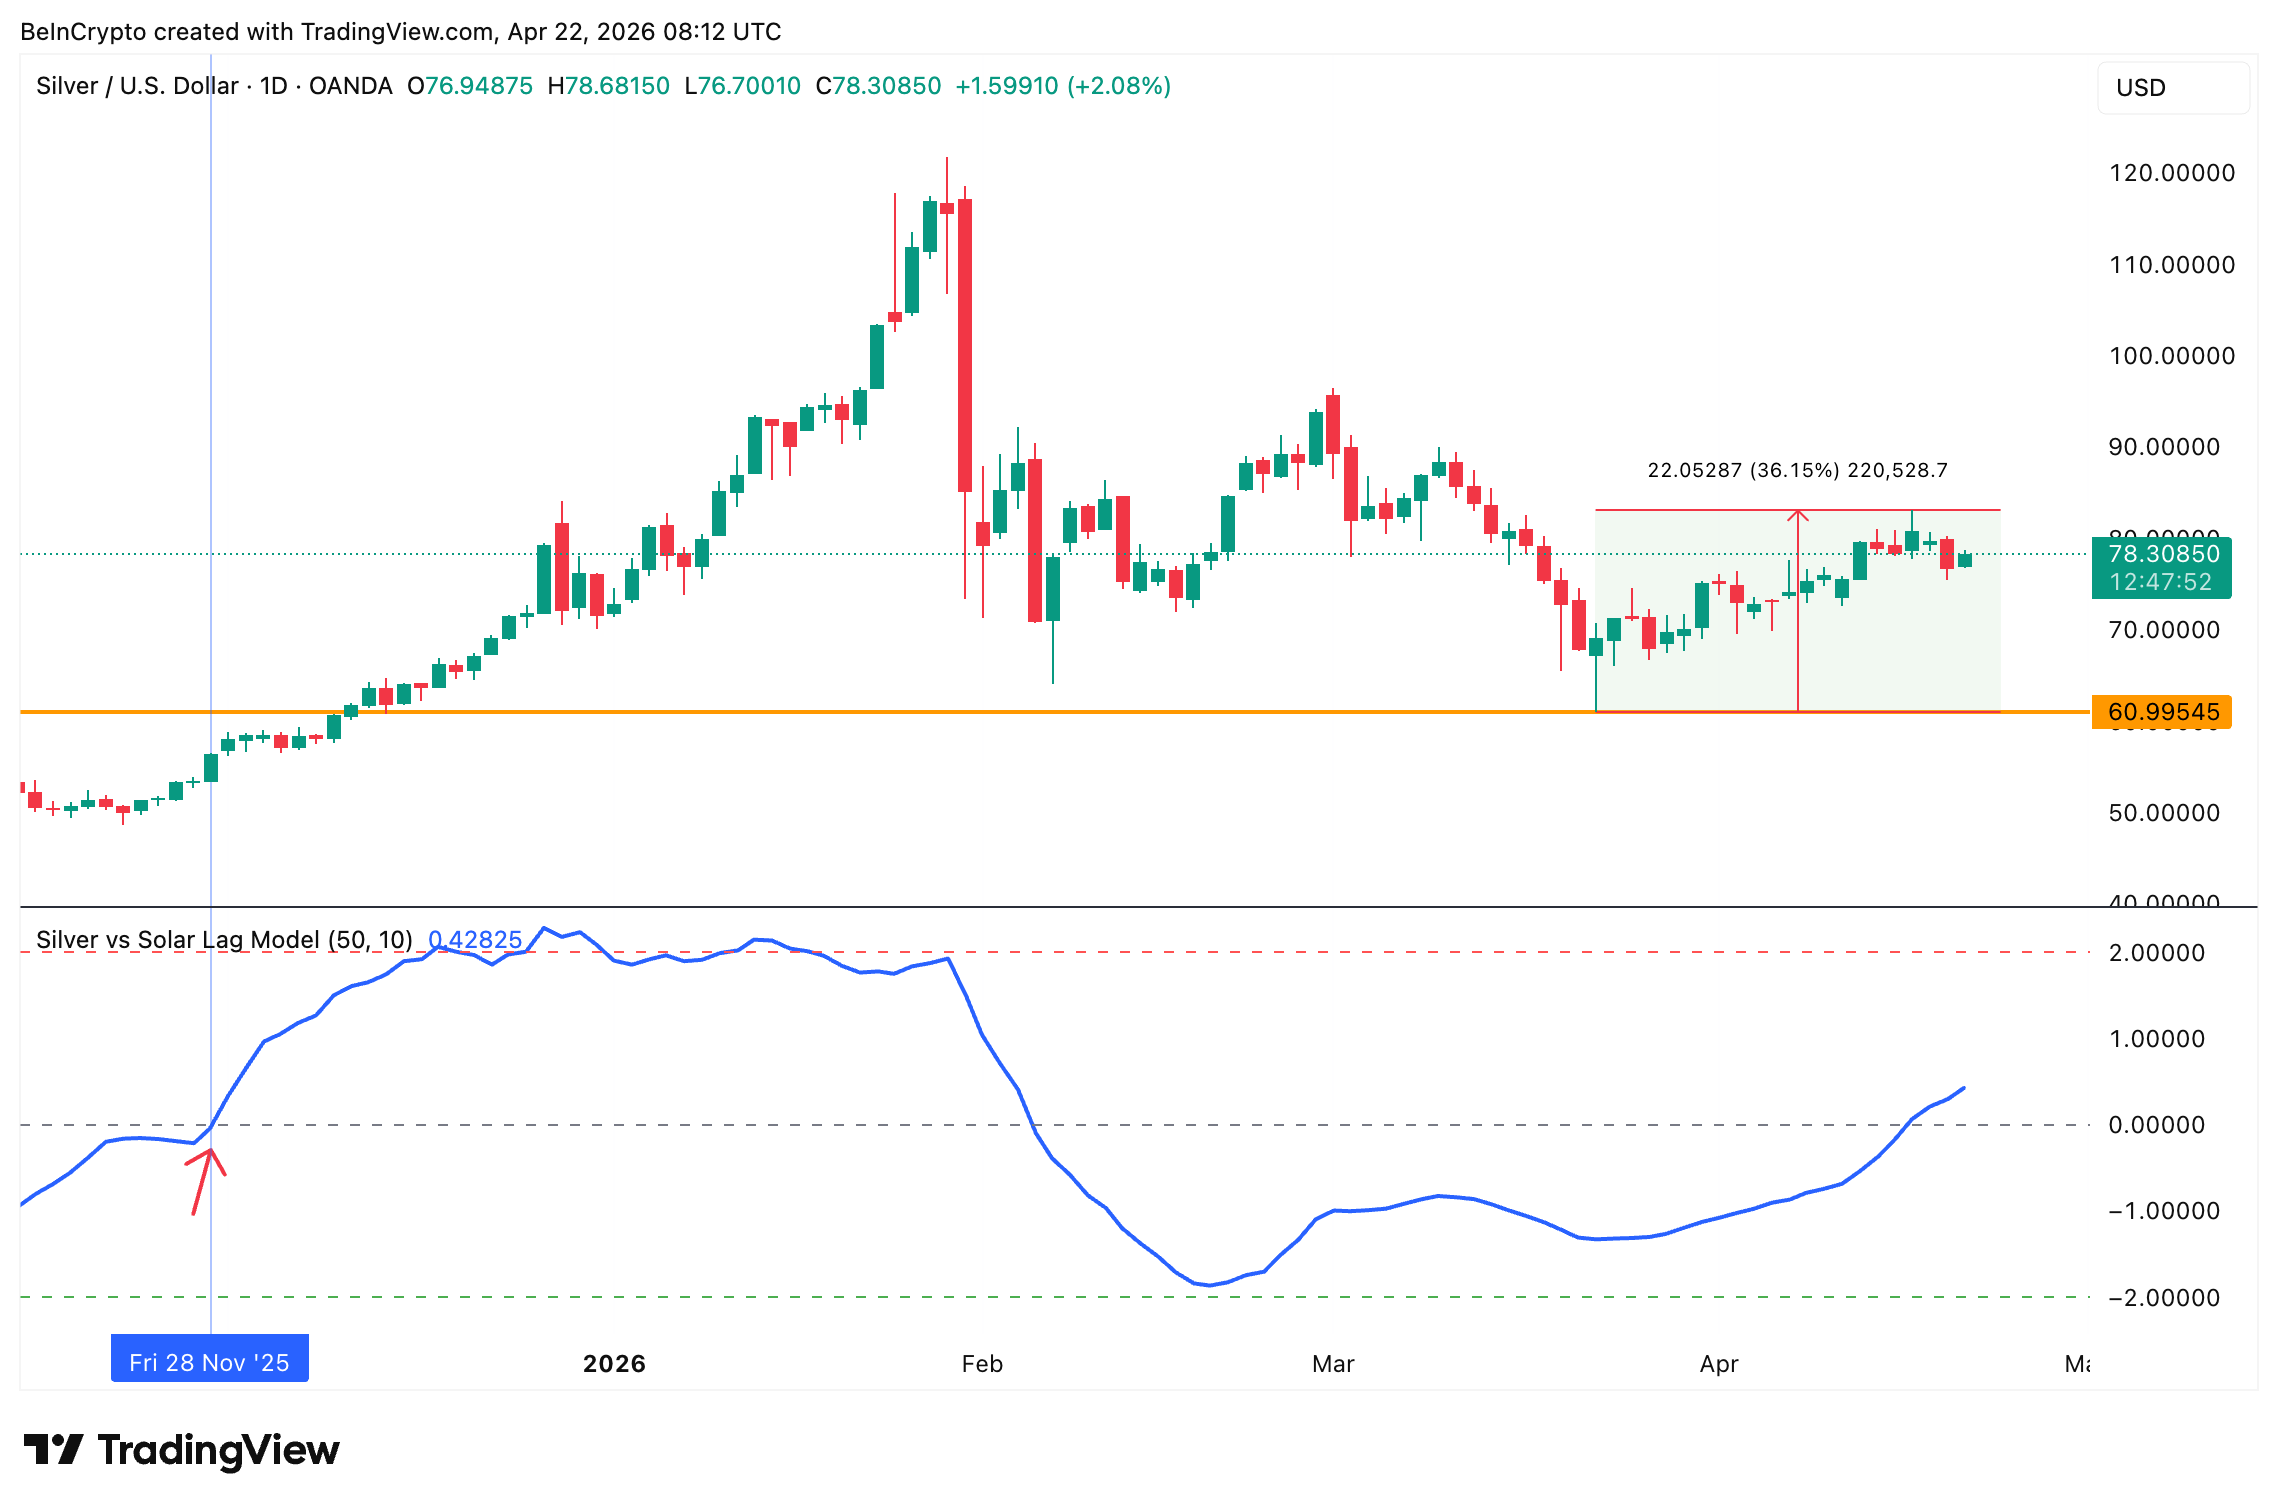
Enter Silver’s Solar Lag Model, an enchanting creature tracking silver against solar-demand-driven industrial flows with a 10-day lag. It has crossed above zero for the first time since late 2025! This is akin to a phoenix rising from the ashes-its November 28 cross heralded silver’s multi-week rally.
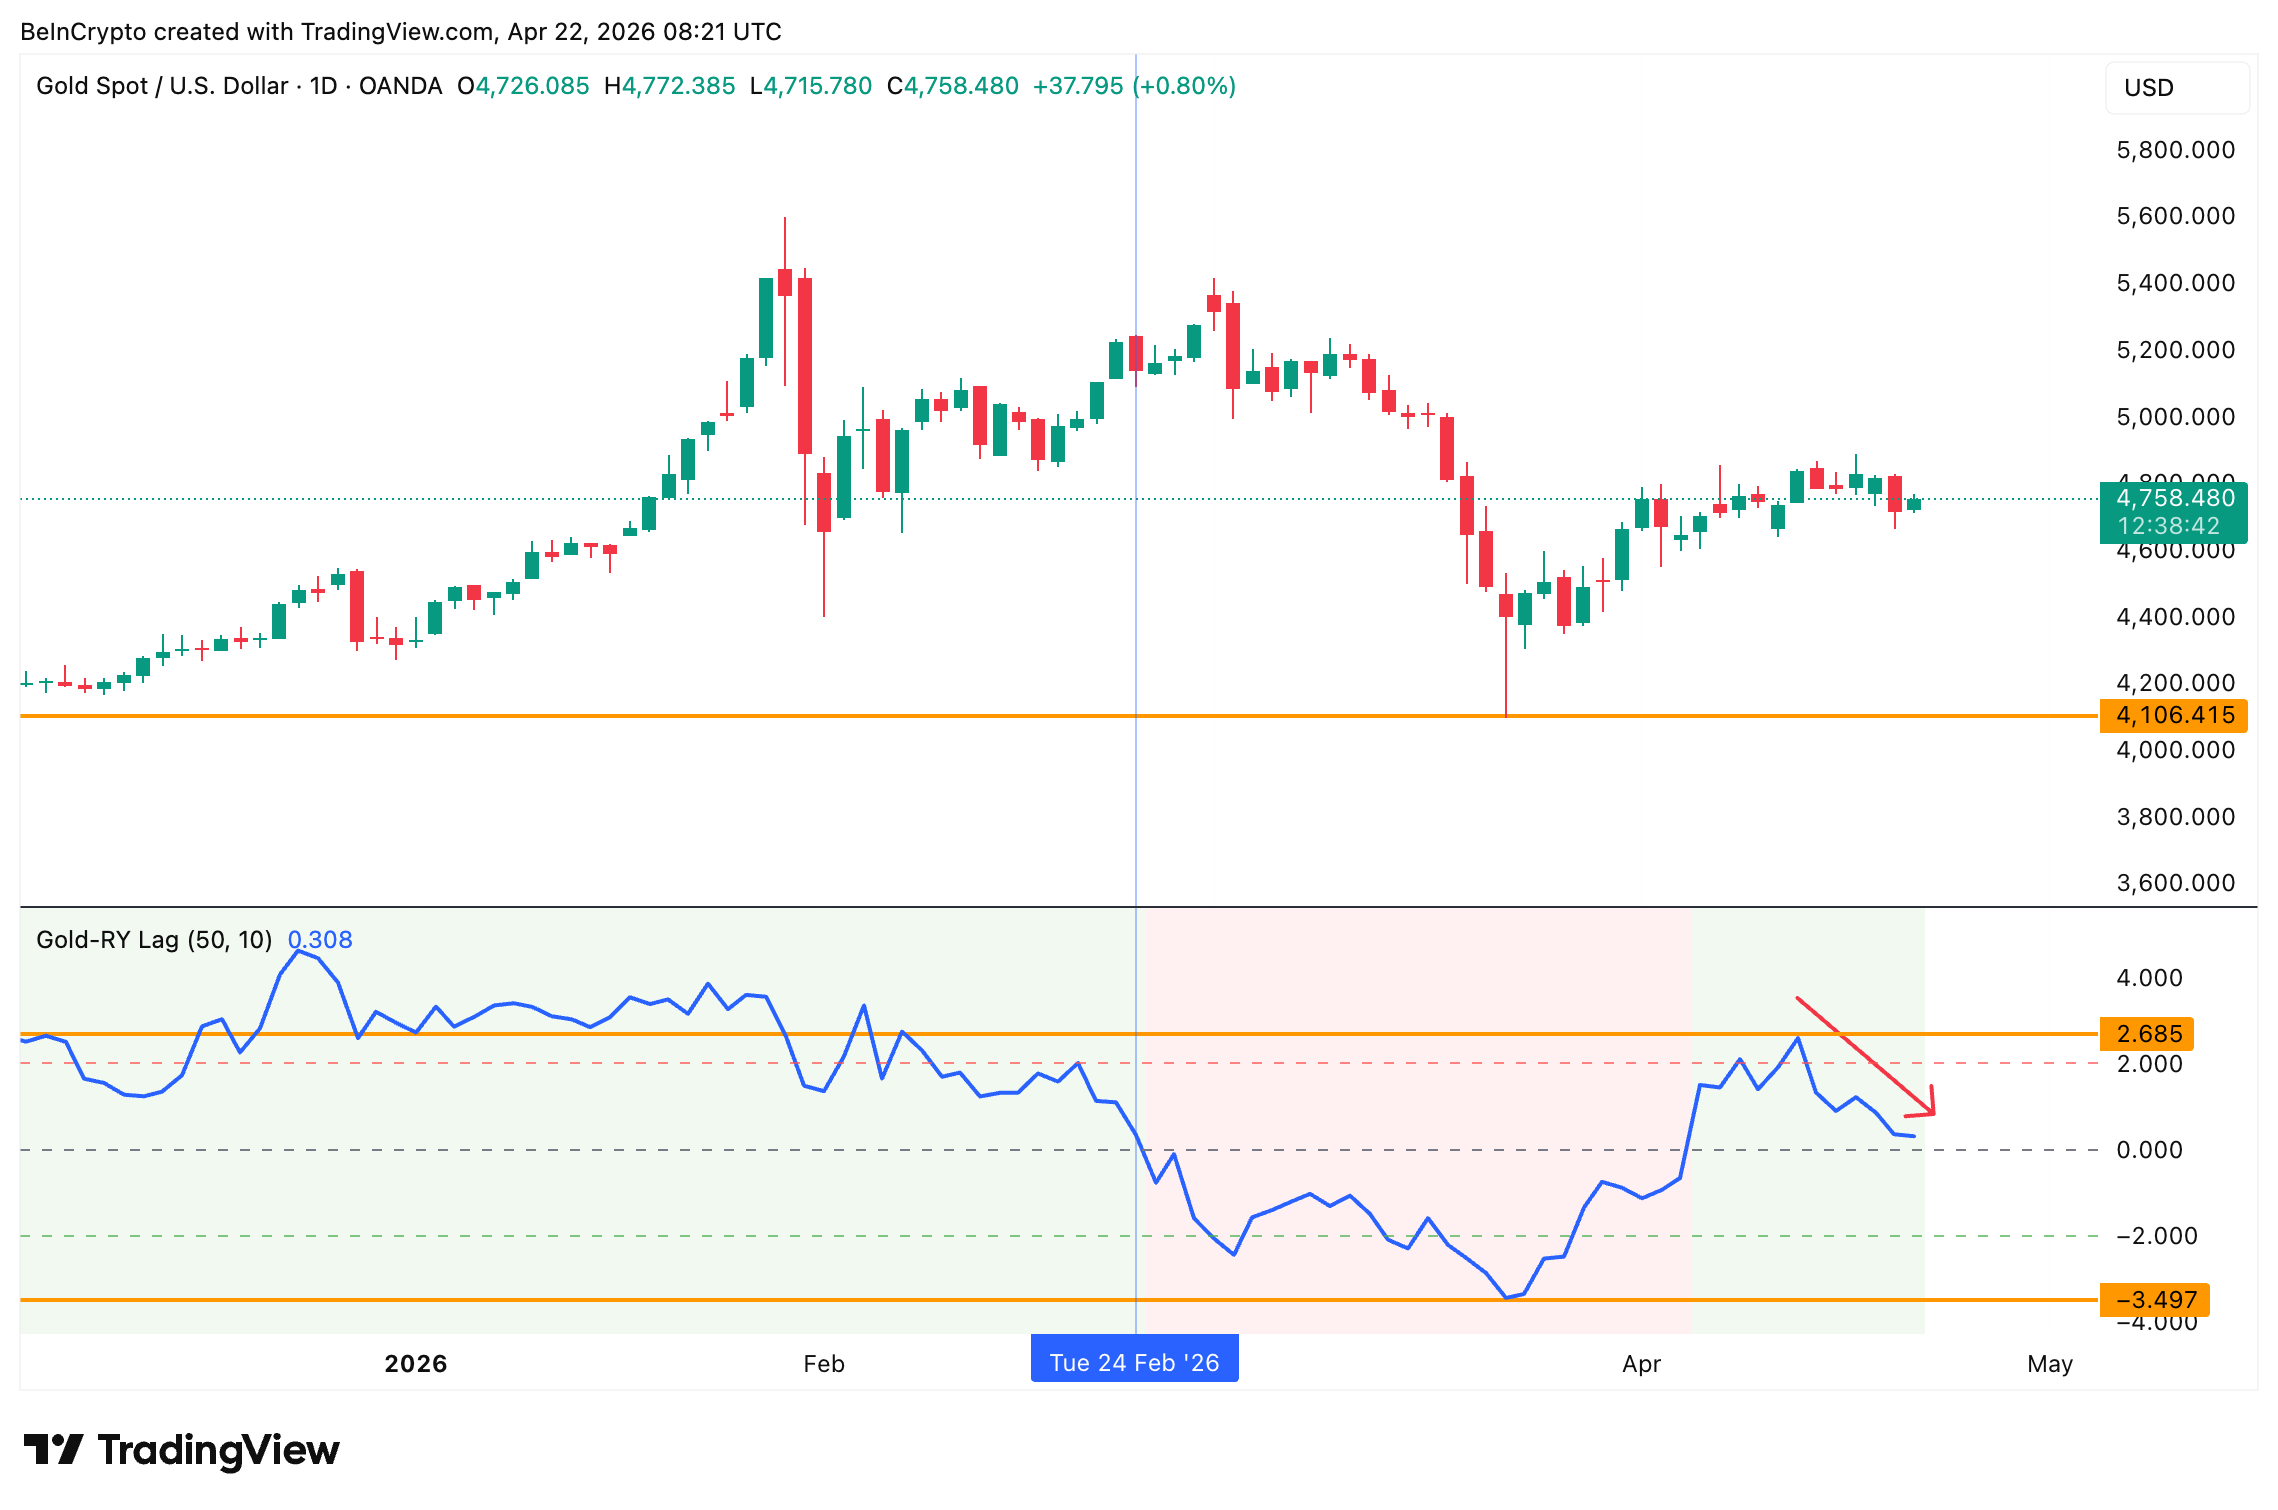
Meanwhile, Gold’s Real Yields Lag Model, a notoriously grumpy indicator measuring gold’s fate against 10-year real yields, is rolling backward. It peaked at 2.685 earlier this month before taking a nosedive to 0.308. Its decline echoes the February rollover that flopped below zero and plummeted to -3.497 during gold’s correction-talk about a dramatic fall from grace!
But wait-one structural force remains steadfast, guarding gold like a bouncer at an exclusive club. Central banks now guard approximately 38,666 tons of gold, about 17% of all gold ever mined, according to data from The Kobeissi Letter. Even if gold loses the relative race to silver, its downside is cushioned by a buyer base that doesn’t budge in response to the latest market drama.
Central banks are sitting on massive stockpiles of gold after years of record purchases:
Global central banks now hold ~38,666 tons of gold, reflecting ~17% of all gold ever mined.
Still, the largest portion of gold remains in private hands, with ~97,645 tons held as jewelry,…
– The Kobeissi Letter (@KobeissiLetter) April 22, 2026
Put it all together, and you find the ratio compressing in silver’s favor, silver’s industrial lag model climbing, and gold’s monetary premium fading, while central bank demand keeps gold’s floor intact, albeit without the enthusiasm of a cheerleader at a football game. The scoreboard reads three forces for silver, one defensive line for gold.
And what do the options traders think about this unfolding drama? Let’s dive into their perspectives!
Options Traders Stack Long on One, Stay Balanced on the Other
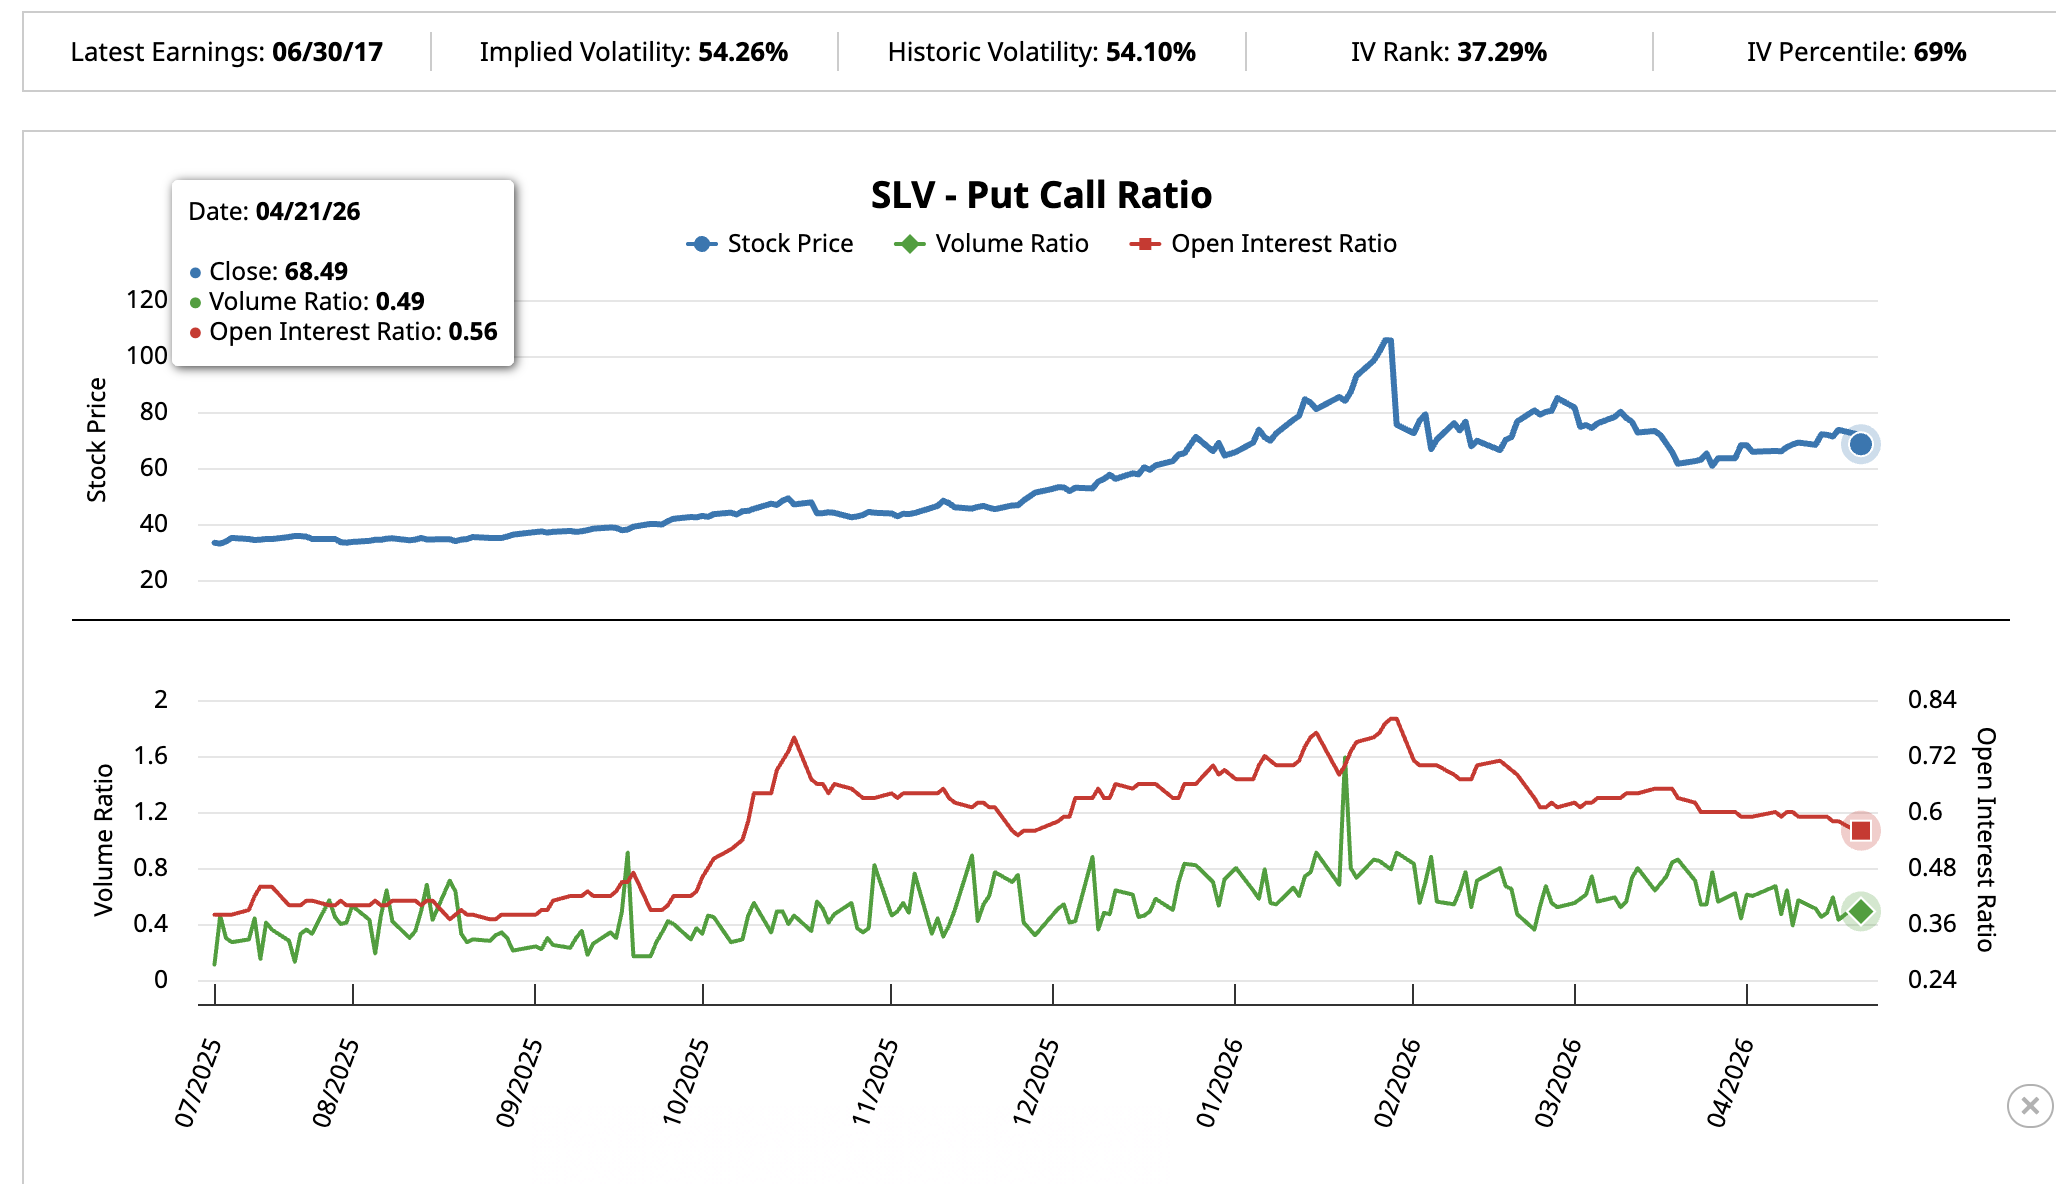
Options activity on the iShares Silver Trust (SLV ETF), the largest silver-backed fund and the main proxy for traders seeking silver exposure without getting tangled in futures, has turned sharply bullish since late March. It’s like watching the underdog finally get some airtime!
The put-call volume ratio, where a reading below one means calls outnumber puts, has dropped from 0.77 on March 26 to 0.49 on April 21-what a rollercoaster! The open interest ratio has fallen from 0.60 to 0.56 over the same period. Call activity is outpacing put activity like an eager contestant in a pie-eating contest.
SLV implied volatility sits at a lively 54.26% with an IV Percentile of 69%, which means options are pricing expected movement above the vast majority of last year’s range. Traders are leaning long and paying up for the ride-who wouldn’t want a ticket to this show?
Want more insights like this? Sign up for Editor Harsh Notariya’s Daily Newsletter here.
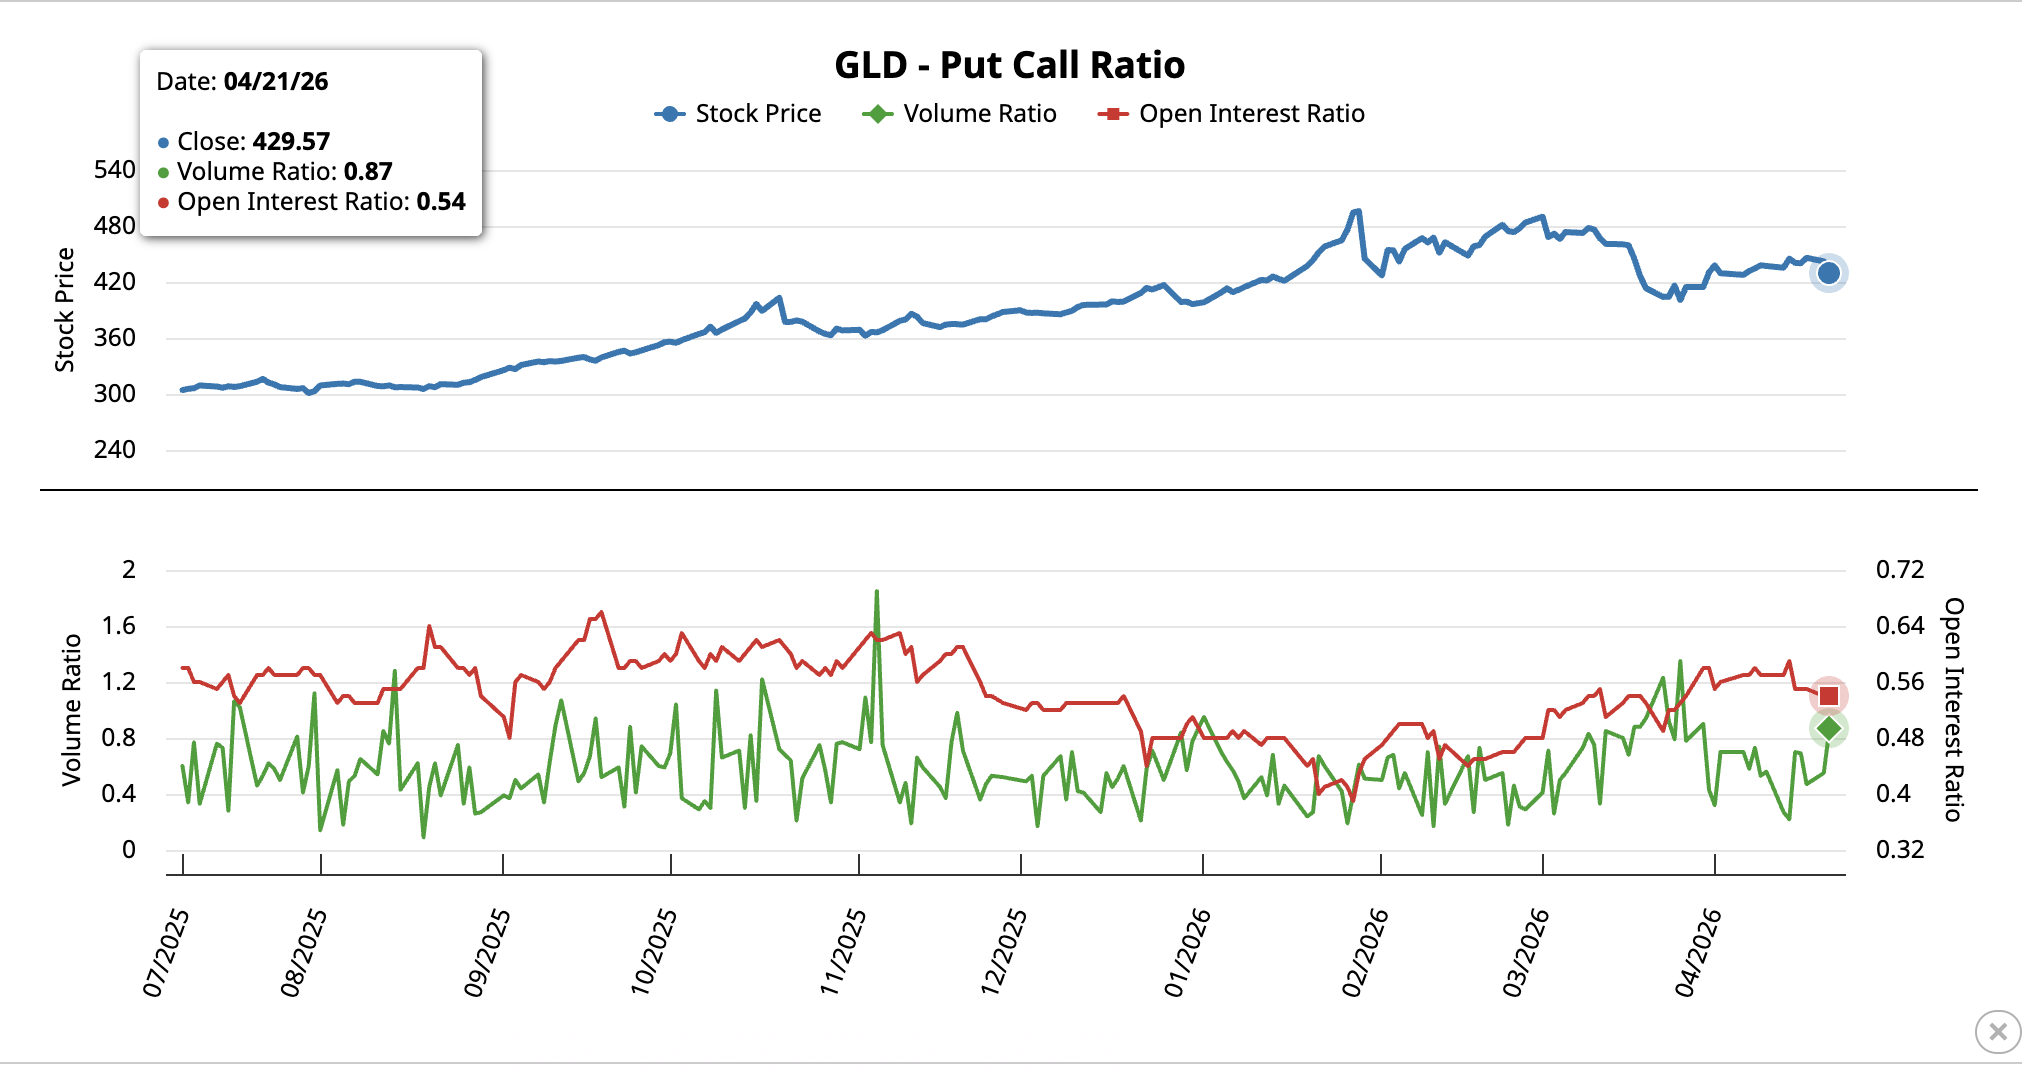
Now, let’s shift our gaze to the SPDR Gold Shares (GLD ETF), the equivalent vehicle for gold exposure. The volume ratio here has dropped from 1.35 on March 26 to 0.87, signaling a shift from bearish to mildly bullish. The open interest ratio remains nearly unchanged at 0.53 to 0.54. Traders have ceased stacking downside protection on gold but haven’t exactly embraced an aggressive call accumulation either-like a hesitant dancer at a school prom.
With indicators and positioning marching in lockstep, the charts become the ultimate judge of this contest.
The Gold vs Silver Verdict Rests on Two Inverse Setups
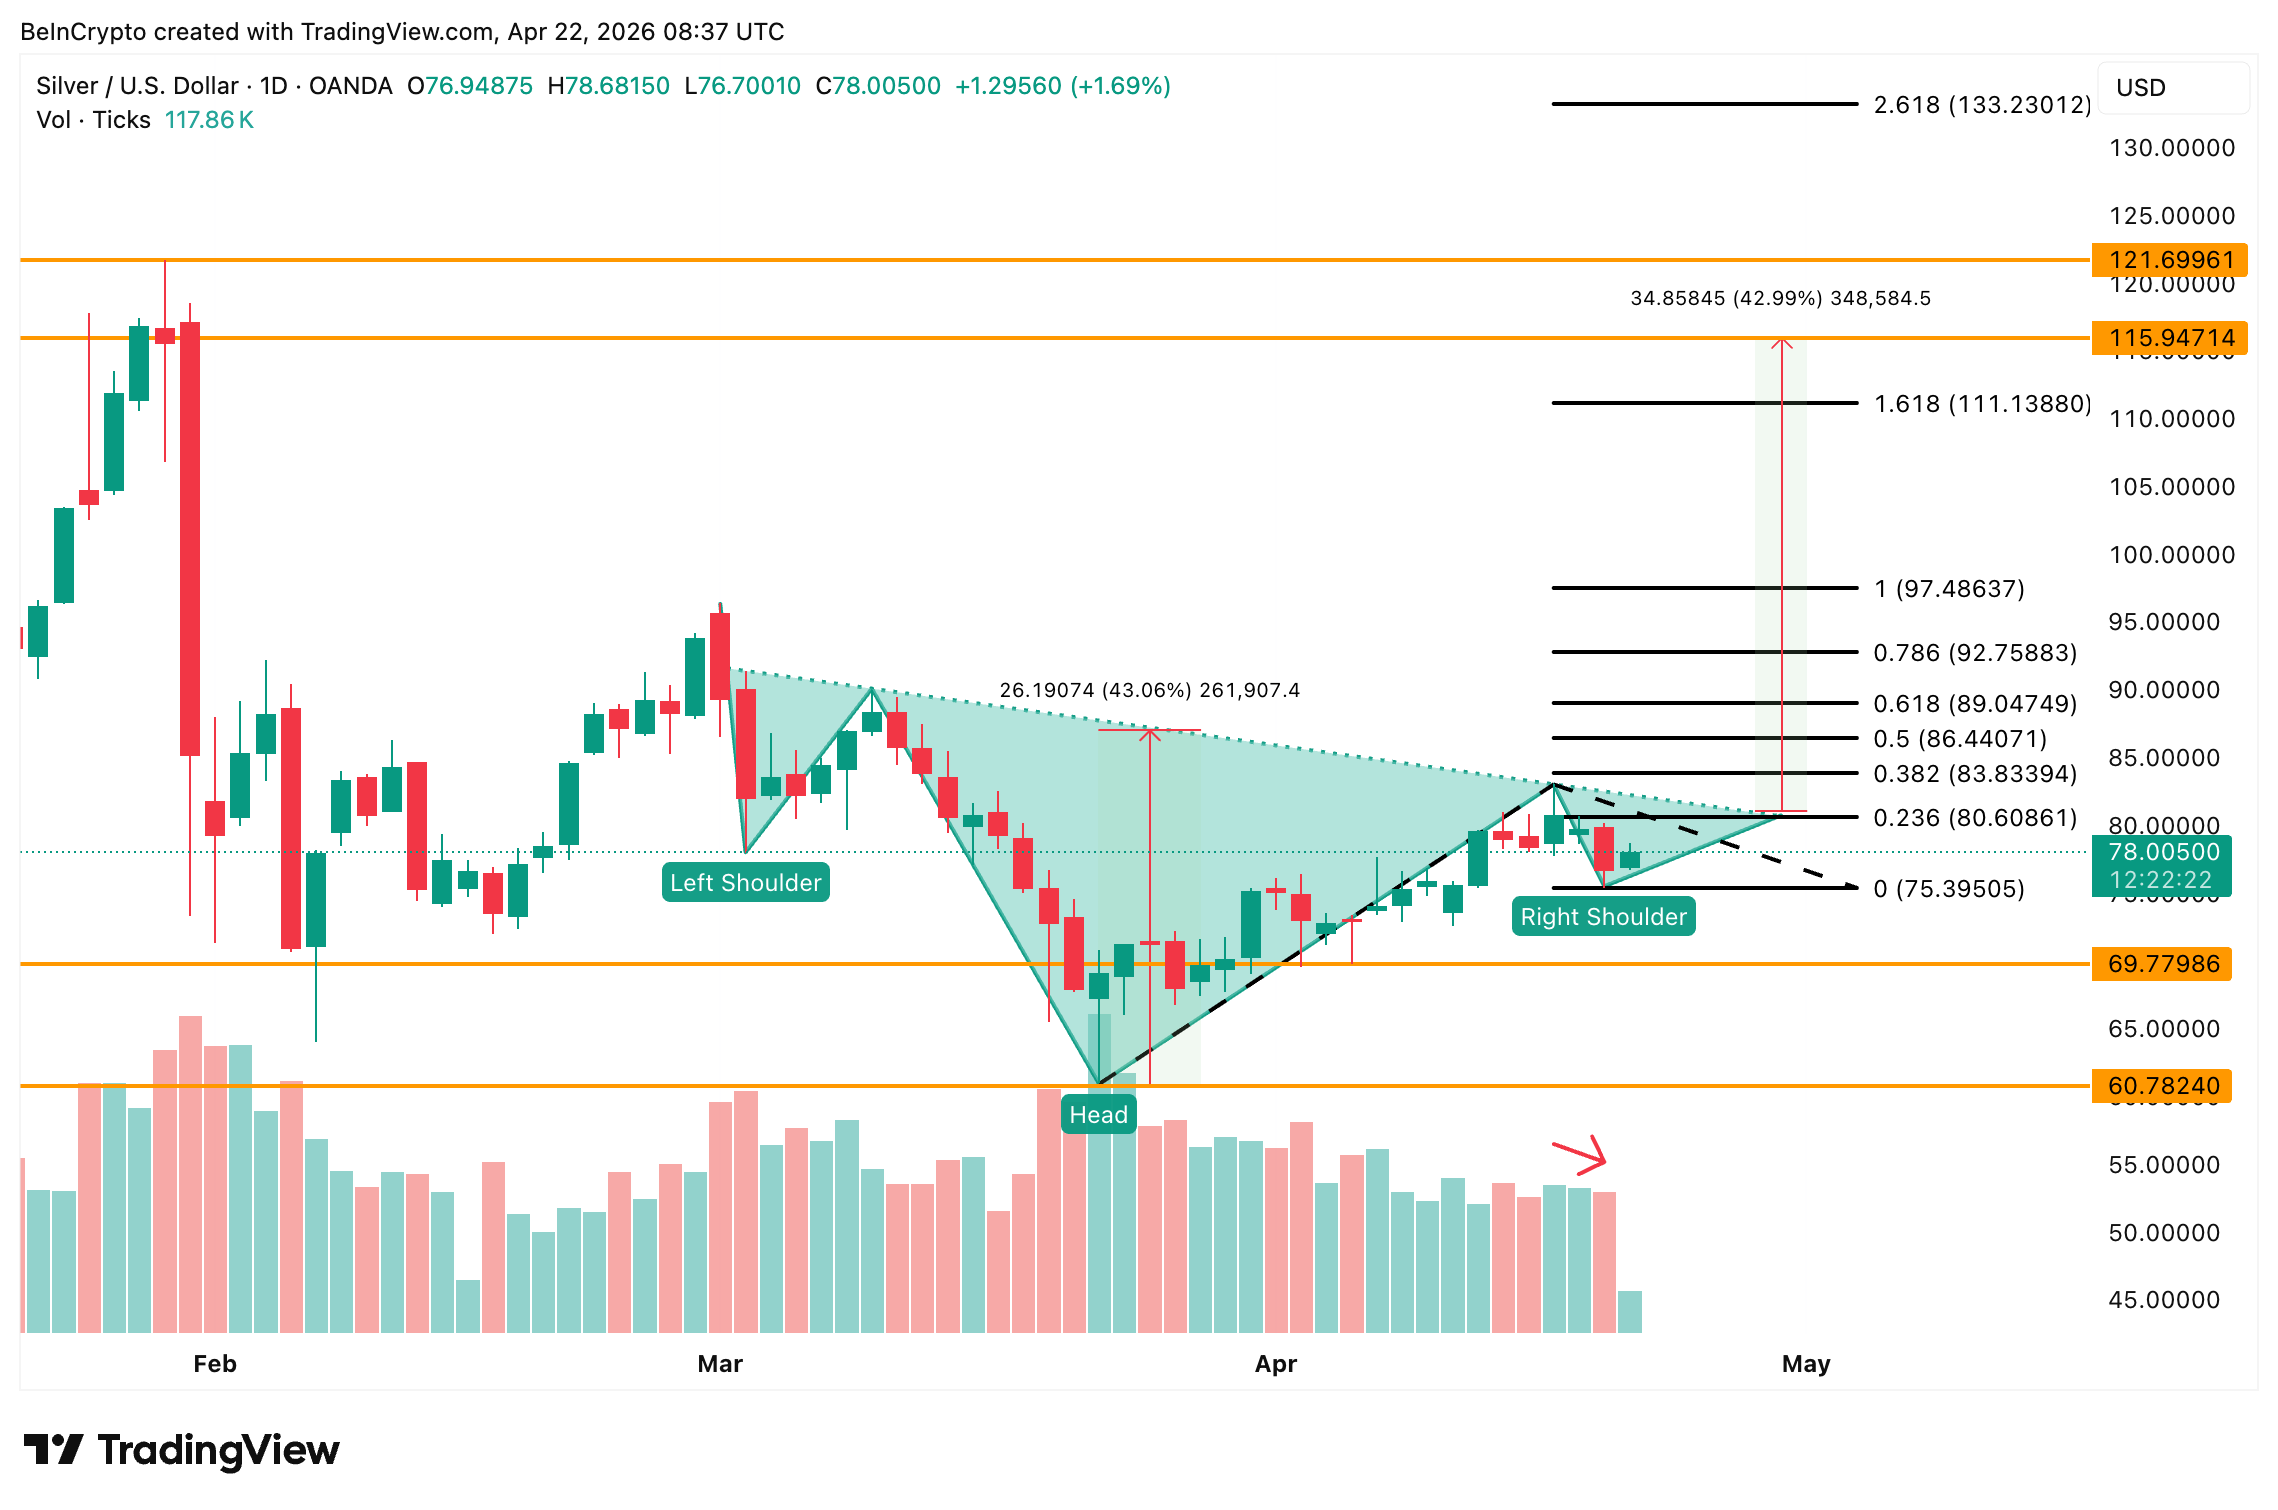
The daily chart for silver (XAG/USD) has been artfully crafting an inverse head and shoulders-a bullish reversal pattern with three lows, the middle one being the most profound, like a Shakespearean tragedy. The head lurks near $60, while the neckline runs close to $80. The right shoulder’s buying volume slightly surpasses its matching selling volume, hinting at secret strength lurking in the shadows.
A clean break above the $80 to $83 zone would activate a 43% projection toward roughly $115, nudging price closer to the $121 all-time high, while the optimistic extension reaches for $133. However, a drop below $75 could weaken the structure, and falling under $69 risks invalidation-a classic case of “it’s not you, it’s me.”
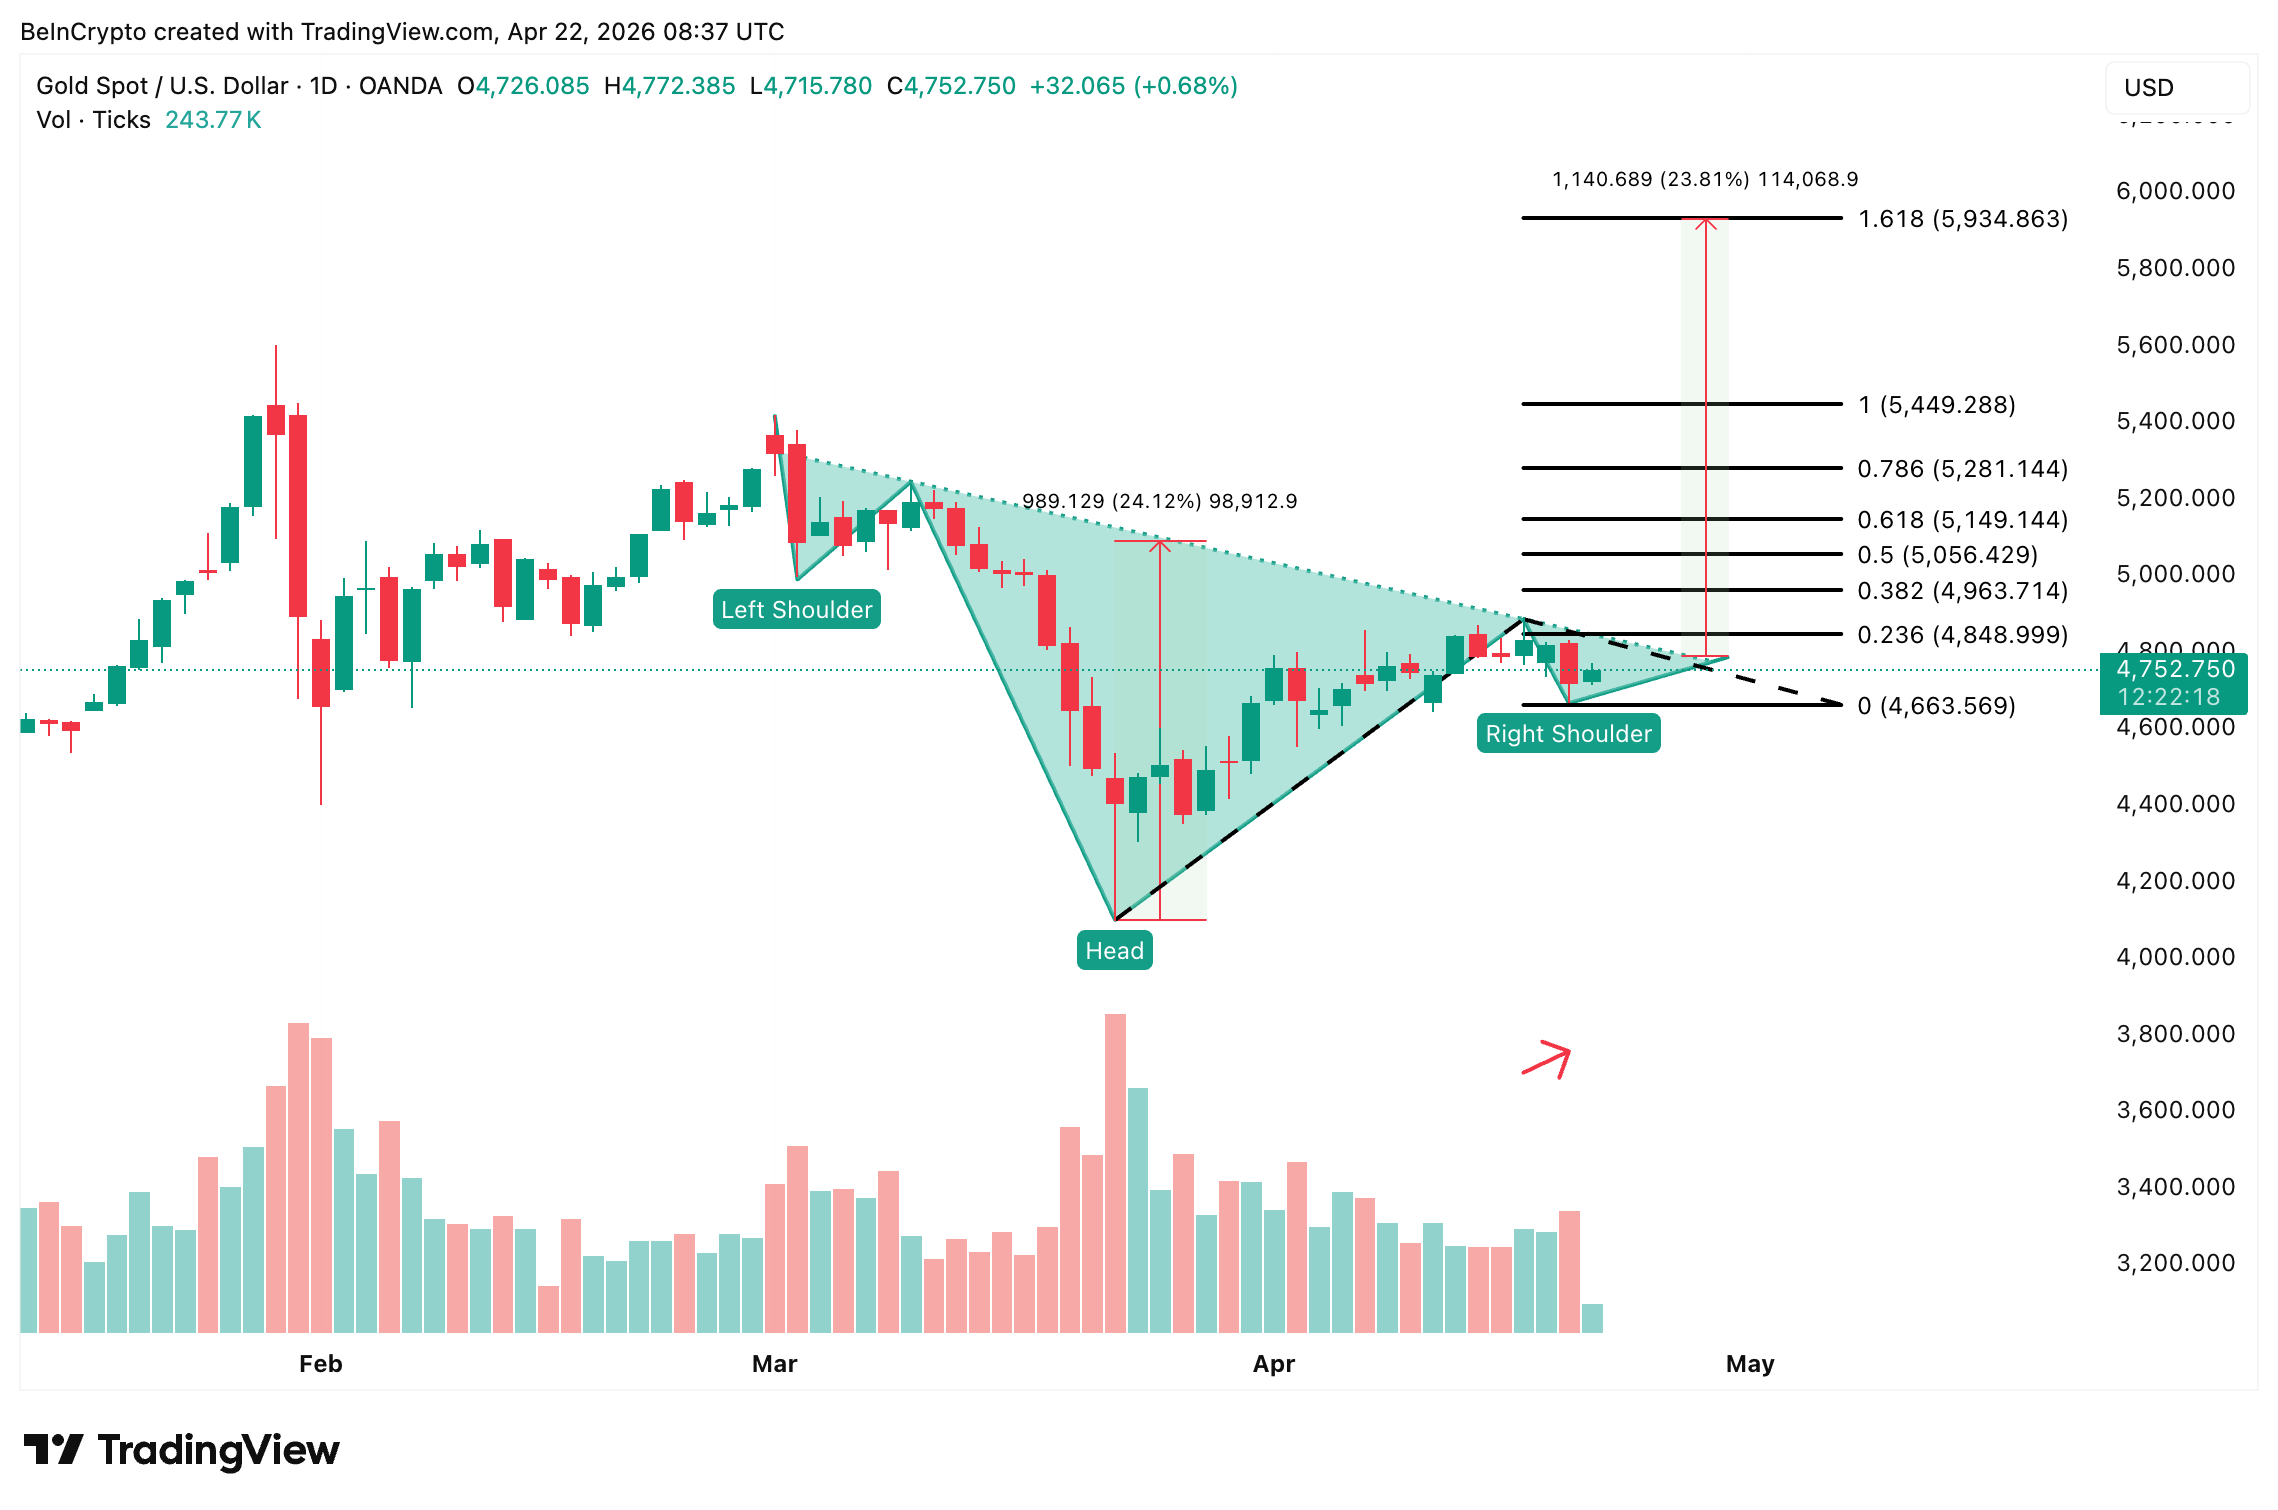
Gold, meanwhile, is attempting to build the same pattern but with less conviction-like a shy actor flubbing their lines. The right shoulder’s selling volume stands tall above the matching buy volume, contrasting with silver’s narrative of strength. The neckline hovers around $4,848, and a confirmed break above that level would open a 24% path to $5,934 from the neckline-though that upside is merely half of silver’s measured move.
The earlier gold-silver ratio provides essential context as the pattern currently favors silver. In this grand race, silver boasts volume confirmation, clearer options flow, and a more substantial projection. Gold, however, retains its safe haven status supported by central bank demand. Silver’s breach above $80 opens a path to $115 and solidifies its lead, but a rejection there and a slip below $75 could hand the momentum back to gold-like a game-winning pass unexpectedly intercepted.
Read More
- All Itzaland Animal Locations in Infinity Nikki
- Paramount CinemaCon 2026 Live Blog – Movie Announcements Panel for Sonic 4, Street Fighter & More (In Progress)
- Cthulhu: The Cosmic Abyss Chapter 3 Ritual Puzzle Guide
- Persona PSP soundtrack will be available on streaming services from April 18
- Raptors vs. Cavaliers Game 2 Results According to NBA 2K26
- Rockets vs. Lakers Game 1 Results According to NBA 2K26
- Dungeons & Dragons Gets First Official Actual Play Series
- Spider-Man: Brand New Day LEGO Sets Officially Revealed
- Focker-In-Law Trailer Revives Meet the Parents Series After 16 Years
- Katanire’s Yae Miko Cosplay: Genshin Impact Masterpiece
2026-04-22 20:11