XRP is currently trading around the $1.34 support level. If it continues to move favorably, potential price targets are $1.37 and $1.40. Technical indicators suggest this move is still possible, as the Relative Strength Index (RSI) is below 50 and the Moving Average Convergence Divergence (MACD) is still showing a bearish trend.
XRP was trading around $1.34 on Bitstamp, and analysts were keeping a close eye on a support level that could indicate a potential upward trend.
The level remains a short-term focus because buyers are targeting $1.37 and $1.40 if support holds.
XRP Holds Near $1.34 Channel Support
I’ve been watching XRP, and it’s been hovering around $1.34 lately. It’s currently trading near the bottom of what looks like an upward trend channel, which is something I’m keeping an eye on.
According to Ali Charts, the price of $1.34, which represents the lower boundary of the current upward trend, could be a good place to buy. This suggests traders are watching for a price floor.
I’m watching the bottom of the rising channel at $1.34 as a potential buying zone for $XRP.
If it holds, targets sit at $1.37 and $1.40.
— Ali Charts (@alicharts) May 31, 2026
If XRP continues to stay above its current price level, it could first reach $1.37, and potentially move even higher to $1.40.
We’re still waiting for confirmation from the market’s price movements. Buyers need to see a solid daily close above the current support level.
If the price falls below $1.34, it could signal trouble for any potential price recovery. This might then lead traders to focus on the $1.30 level as the next likely support point.
Fibonacci Levels Keep XRP Resistance In Focus
On the TradingView chart, XRP is currently trading below a Fibonacci level around $1.4655, which is now a significant barrier to further price increases.
XRP continued to trade below $1.8461, a key Fibonacci level. Falling below this point suggests that buying pressure is decreasing.
Based on the daily chart, the price currently finds support around $1.30. If it falls further, additional support levels can be found near $1.25 and $1.20.
If the price falls below $1.30 each day, it could lead to more people selling, and make it harder for the price to recover quickly.
To really bounce back, XRP needs to get above $1.47. If it does, it could then encounter further hurdles around $1.85, $2.14, and $2.35.
Read Also:
Ripple Says CLARITY Act Could Define XRP’s Future
MACD And RSI Show Cautious XRP Momentum
The MACD indicator continued to suggest a slightly negative outlook for XRP/USD on the daily chart, as the MACD line remained below the signal line.
The histogram remained in negative territory, indicating weak buying activity. This kept traders concerned about potential price declines.
The RSI stood near 42.87 on the chart. It remained below the neutral 50 level.
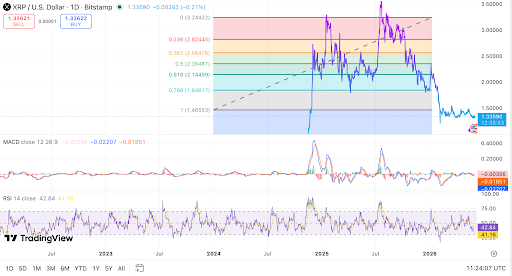
The RSI indicated that XRP wasn’t yet at a point where it could be considered undervalued, and short-term trading was still being driven by sellers.
Experts are currently focused on key price levels of $1.34, $1.37, and $1.40 for XRP. How the price closes today could indicate where it’s headed next.
Read More
- Off Campus Season 1 Soundtrack Guide
- Chainsaw Man Volume 24’s Cover Art Reveals a Brand-New Denji
- X-Men ’97 Finally Gave Gambit the Hero Moment He Deserved
- 46 Years Later, The Mandalorian & Grogu Answers A Major Empire Strikes Back Question
- HoI4 fans harsh reactions to the announcement of another DLC pack
- 10 Worst End-Game Couples In Sitcom History
- Katanire’s Yae Miko Cosplay: Genshin Impact Masterpiece
- DoorDash responds after customer uses AI to make food look bad and get a refund
- Gold Rate Forecast
- Emily Henry Says to ‘Trust the Vision’ For Beach Read Adaptation
2026-05-31 16:24