- Ethereum price is struggling below the $3,400 resistance against the US Dollar.
ETH price is now trading below $3,320 and the 55 simple moving average (4 hours).
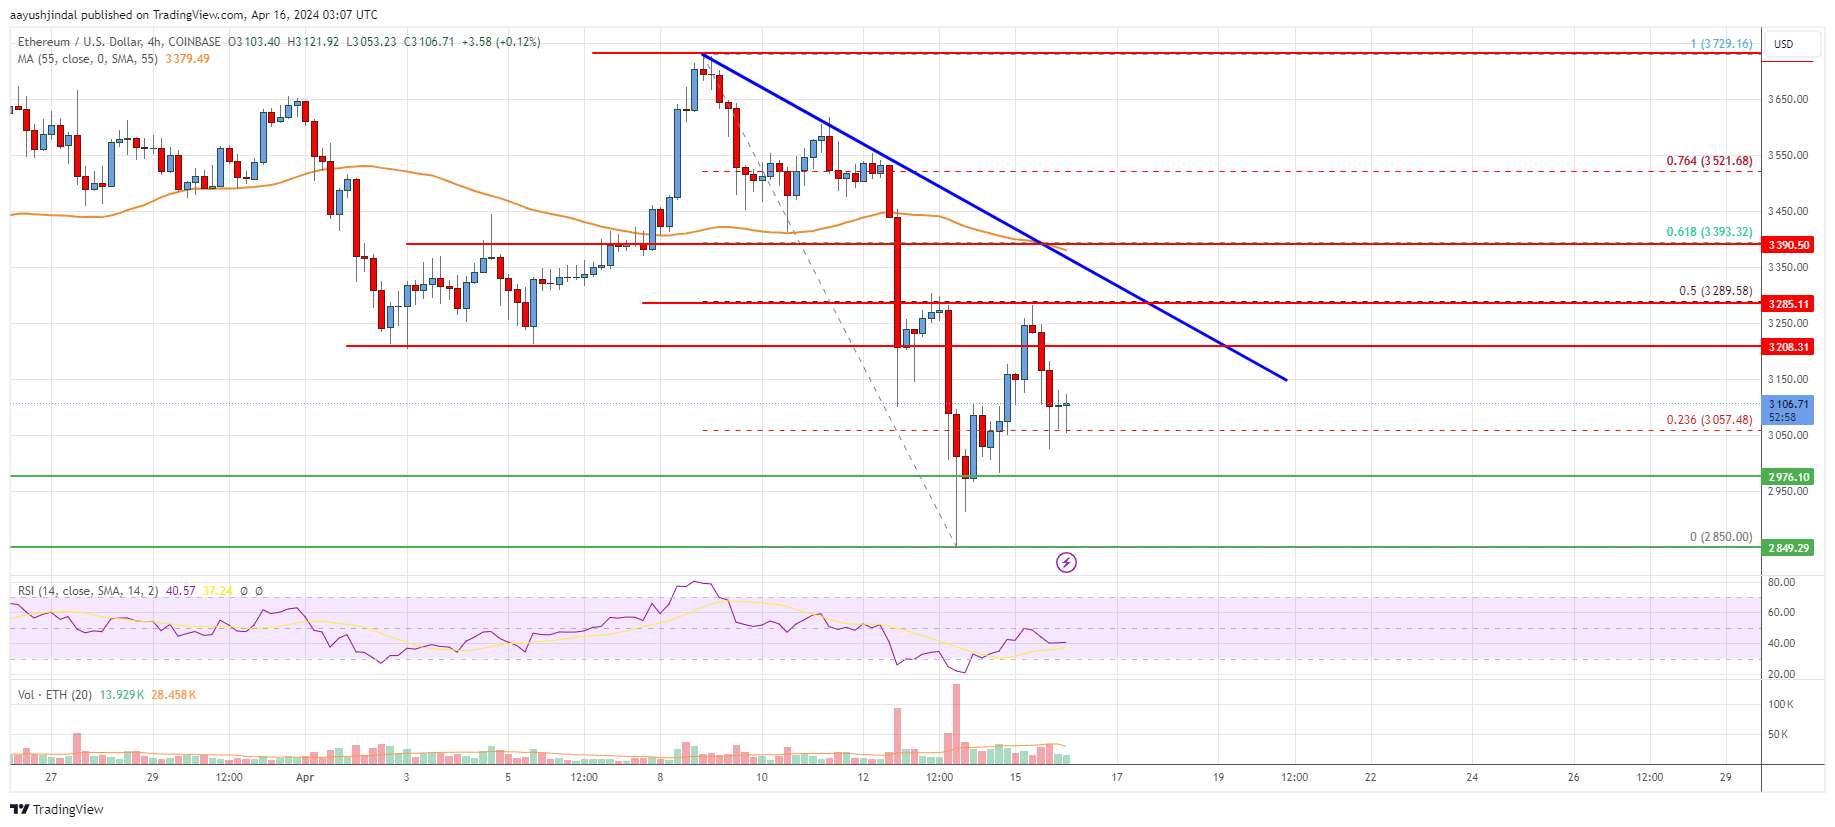
There is a key bearish trend line forming with resistance near $3,200 on the 4-hour chart (data feed from Coinbase).
The pair could continue to move down if it stays below $3,200 and $3,320.
The cost of Ethereum is dropping below $3,400 versus the US dollar. If Ethereum/USD can’t bounce back above $3,320, there’s a chance for further decreases.
Ethereum Price Analysis
Over the last seven days, Ethereum had a tough time holding its value above the $3,500 mark against the U.S. dollar. The ETH price initiate a downward trend and dropped beneath the significant support of $3,400.
The price of Ethereum fell below the $3,320 and $3,200 support points, signaling a bearish trend. A significant drop occurred, pushing the price down below the $3,000 mark. The lowest point was reached at around $2,850. Currently, Ethereum is in the process of correcting its losses, but it still trades beneath $3,320 and the 4-hour Simple Moving Average.
On the 4-hour chart, a bearish trendline is emerging, with resistance around $3,200. This trendline aligns closely with the 50% Fibonacci retracement level of the price drop from the peak at $3,729 to the low at $2,850.
The good news is that the price is encountering resistance around $3,200 and the trendline. The next significant resistance lies at $3,320. The primary resistance is emerging close to $3,400, which is nearly touching the 61.8% Fibonacci retracement level of the slide from the peak of $3,729 to the trough of $2,850. If the price rises above this level, it may encounter resistance at $3,550.
If the price breaks above the $3,550 resistance level with ease, it may advance towards $3,750. On the other hand, a dip below $3,050 serves as initial support, while a more significant support lies at around $2,980. A fall below this support could lead to further price decreases towards $2,850. If the bulls are unable to defend $2,850, the price could potentially drop as low as $2,550.
Glancing at the graph, Ethereum’s price currently hovers around $3,200, dipping beneath both the $3,320 mark and the 4-hour 55 simple moving average. If Ethereum fails to surpass $3,200 and $3,320, its price may trend downward further.
Technical indicators
4 hours MACD – The MACD for ETH/USD is now gaining momentum in the bearish zone.
4 hours RSI (Relative Strength Index) – The RSI for ETH/USD is now below the 50 level.
Key Support Levels – $3,050, followed by the $2,850 zone.
Key Resistance$ Levels – $3,200 and $3,320.
Read More
- CKB PREDICTION. CKB cryptocurrency
- EUR INR PREDICTION
- PBX PREDICTION. PBX cryptocurrency
- PENDLE PREDICTION. PENDLE cryptocurrency
- IMX PREDICTION. IMX cryptocurrency
- TANK PREDICTION. TANK cryptocurrency
- W PREDICTION. W cryptocurrency
- ICP PREDICTION. ICP cryptocurrency
- USD DKK PREDICTION
- GEAR PREDICTION. GEAR cryptocurrency
2024-04-16 06:36