- ADA price is attempting a fresh increase from the $0.5600 zone against the US Dollar.
The price is now trading above $0.600 and the 55 simple moving average (4 hours).
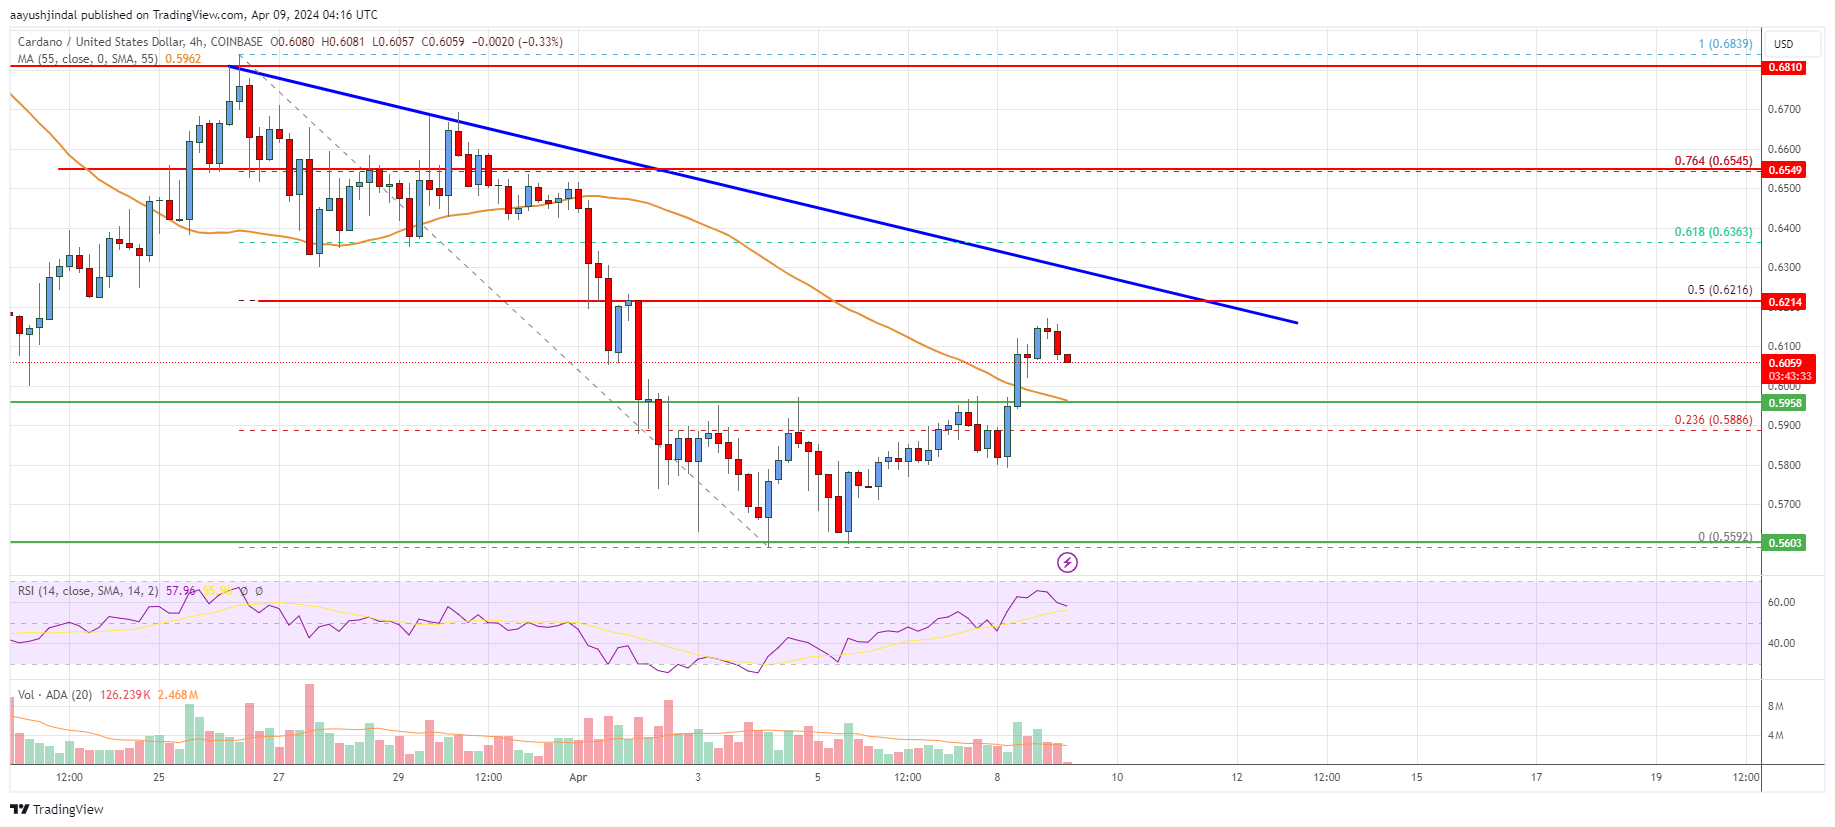
There is a major bearish trend line forming with resistance at $0.620 on the 4-hour chart (data feed via Coinbase).
The price could gain bullish momentum if it clears the $0.620 and $0.650 levels.
The price of Cardano is currently clinging to the $0.580 mark as a support level versus the US Dollar, similar to Bitcoin‘s behavior. If Cardano manages to surmount the $0.620 resistance, it could signal a bullish trend for ADA.
Cardano Price (ADA) Analysis
Over the last week, the price of Cardano dipped anew from levels significantly above the $0.650 mark versus the U.S. dollar. The ADA/USD pair subsequently dropped below the $0.620 and $0.600 support thresholds.
The price dipped towards the $0.5592 support level, forming a new low at $0.5592. However, it has since bounced back and surpassed previous resistance levels at $0.580 and $0.600. Additionally, it has gone beyond the 23.6% Fibonacci retracement level of the price drop from the peak of $0.6839 to the low of $0.5592.
The current price of ADA is above $0.60 and the 4-hour 55 moving average. Looking up, the next resistance level is around $0.62. Additionally, a significant bearish trend line emerges at this price point on the 4-hour chart.
The trend line nearly touches the 50% mark of the Fibonacci retracement during the price drop from $0.6839 peak to $0.5592 bottom. The upcoming significant resistance lies around $0.6360.
If the price breaks through the $0.6360 barrier, it could lead to a continuous upward trend. In this scenario, the price might escalate towards the next resistances at $0.650 or even reach as high as $0.6850 in the short term.
If we consider the negative side, the price could find short-term support around $0.600. The significant support lies around $0.580. A substantial drop could lead the price to retest the $0.560 level. Further declines might push the price towards the support at $0.5320. If this level gives way, the bears may target a test of $0.500.
The graph shows that ADA is currently trading above both $0.600 and its 4-hour simple moving average, with the potential for further price increases if it surmounts the resistance at $0.620 and $0.650.
Technical Indicators
4 hours MACD – The MACD for ADA/USD is now gaining pace in the bullish zone.
4 hours RSI – The RSI for ADA/USD is now above the 50 level.
Key Support Levels – $0.600 and $0.580.
Key Resistance Levels – $0.620 and $0.650.
Read More
- UFO PREDICTION. UFO cryptocurrency
- Uncovering the Mystery of Red King Players in Clash Royale – What Reddit Users Have to Say
- The Last Epoch Dilemma: Confronting the Gold Dupe Crisis
- AAVE PREDICTION. AAVE cryptocurrency
- BONE PREDICTION. BONE cryptocurrency
- Finding Resources in Palworld: Tips from the Community
- Discovering the Infinite Power: The Abiotic Factor that Could Change Everything
- Skull and Bones: Navigating the Quest for Extra Teeth in the Game
- The 10 Best Movies of 2024 (So Far)
- Gaming News: Like a Dragon: Infinite Wealth’s Dondoko Island Takes Expansion to New Heights
2024-04-09 10:16