The price of Bitcoin has been stabilizing since early March instead of continuing to climb higher. However, it’s possible that Bitcoin could regain momentum and set a new record high in the near future.
Bitcoin Price Analysis: Technicals
By TradingRage
The Daily Chart
For the past two weeks on the daily Bitcoin chart, the price has bounced around between $60,000 and $70,000 without making significant progress in either direction. However, following a recent unsuccessful attempt to break above $70,000, the Bitcoin price has started falling again, aiming for the support at $60,000.
Despite holding at this level, the market is showing signs of bouncing back. It may soon approach the significant resistance point of $68K. However, if the market takes a turn for the worse and falls below $60K, the price could potentially drop to the $48K-$52K range within the next few weeks.
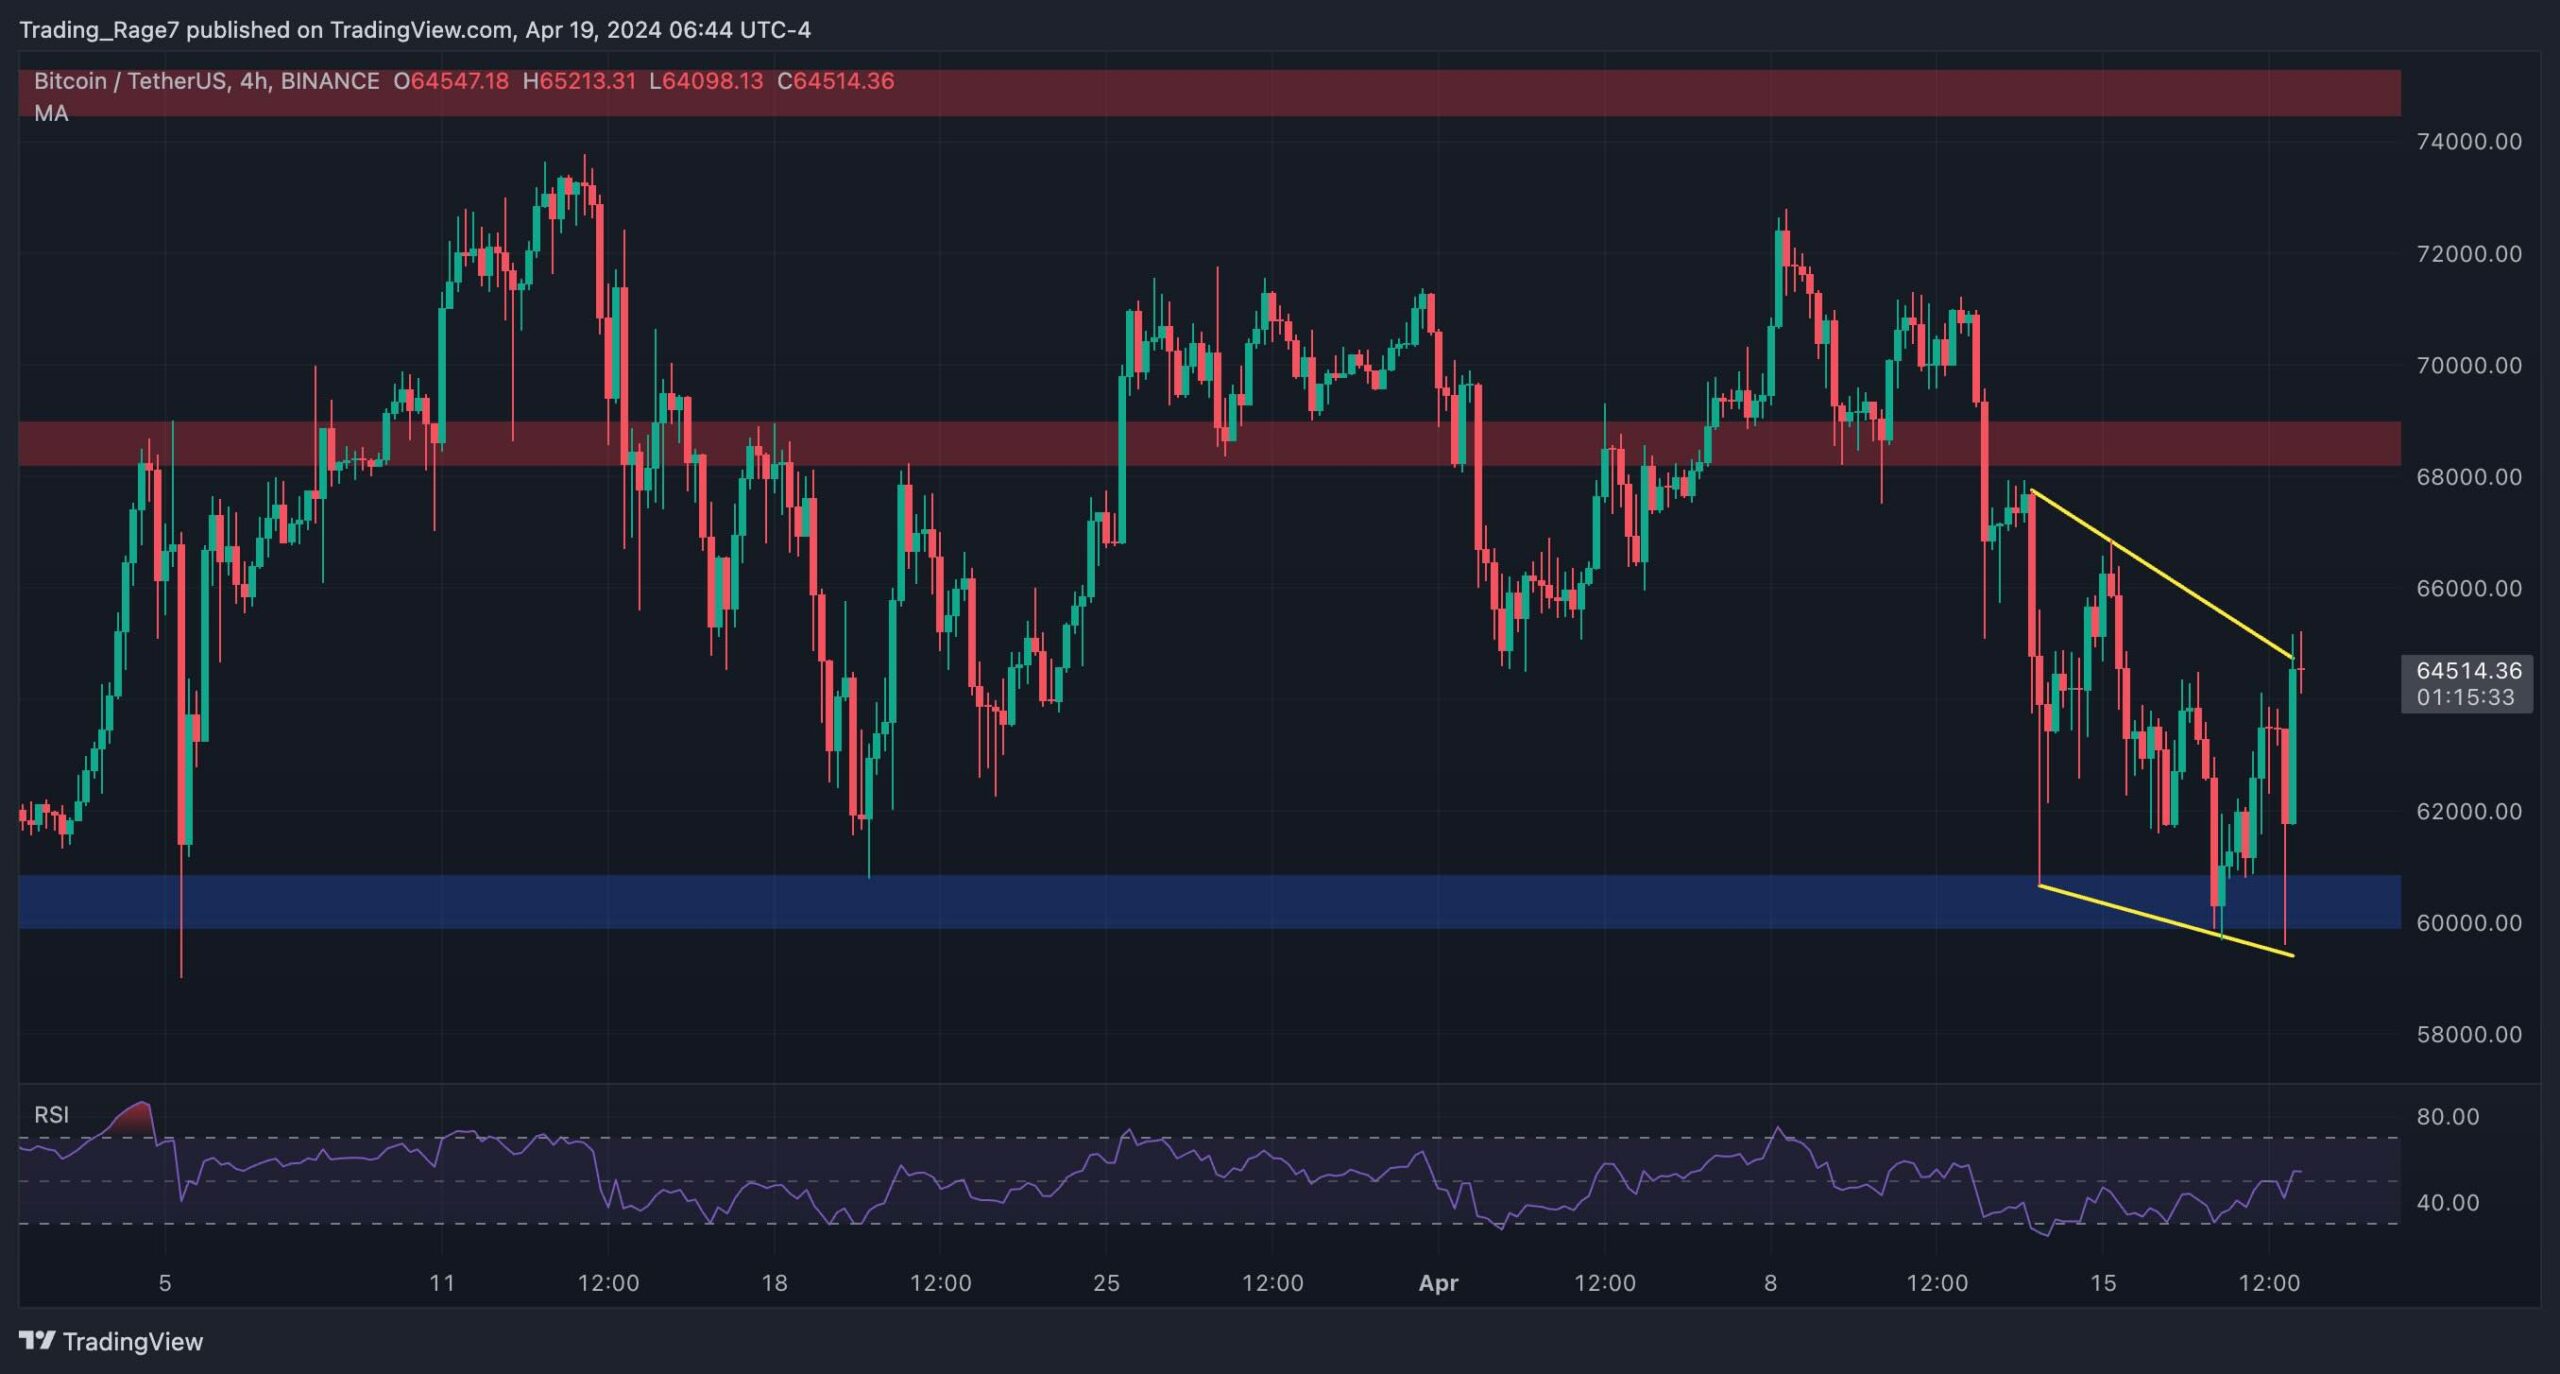
The 4-Hour Chart
On the 4-hour chart, Bitcoin’s price has formed a downward trendline, with the pattern taking shape above the $60,000 mark. A break above this trendline would indicate a bullish reversal, potentially signaling an end to the ongoing correction.
The RSI, which measures the momentum of a security’s price movement, indicates values over 50% – a sign that buying power is once more prevailing and a bullish trend may potentially ensue.
On-Chain Analysis
By TradingRage
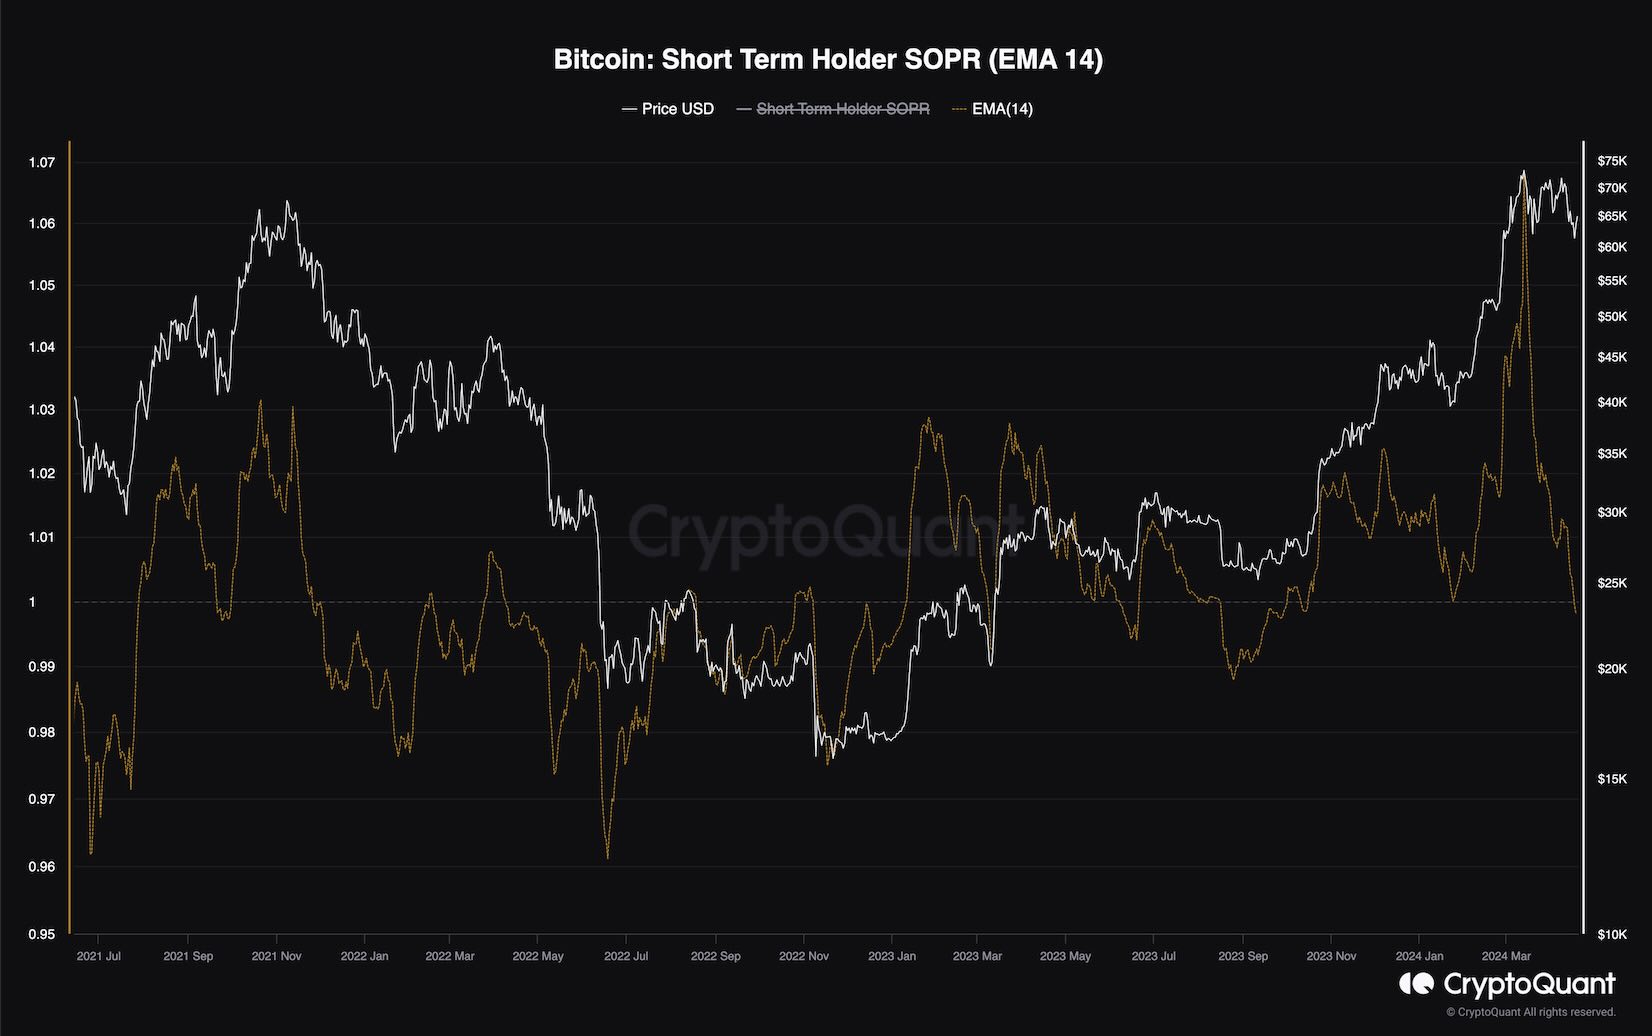
Bitcoin Short-Term Holder SOPR
Over the past few weeks, Bitcoin’s price stability has sparked anxiety among some investors. A few believe that the bull market has ended and Bitcoin is reaching its peak, while others see this dip as a chance to purchase more at a lower price.
this chart illustrates the Short-Term Holder Sopr, or spent output profit ratio for Bitcoin. This metric reveals the proportion of earnings Bitcoin investors have made when they sold their coins within the past six months.
The STH SOPR on the chart has reached an unprecedented level, revealing profits far greater than during any past peak. This massive profit-taking may have contributed to the market’s resistance, causing selling pressure that has kept prices from advancing further.
In simpler terms, when the Short-Term Holder Supply Proportion Ratio (STH SOPR) dipped below 1 in past days, it means that short-term holders have incurred losses. This situation may require additional buying pressure to counterbalance the existing surplus of coins and potentially trigger a market recovery.
Read More
- ACT PREDICTION. ACT cryptocurrency
- W PREDICTION. W cryptocurrency
- PENDLE PREDICTION. PENDLE cryptocurrency
- Skull and Bones Players Report Nerve-Wracking Bug With Reaper of the Lost
- NBA 2K25 Review: NBA 2K25 review: A small step forward but not a slam dunk
- Aphrodite Fanart: Hades’ Most Beautiful Muse Unveiled
- Destiny 2: How Bungie’s Attrition Orbs Are Reshaping Weapon Builds
- Why has the smartschoolboy9 Reddit been banned?
- Understanding Shinjiro: The Persona 3 Character Debate
- AAVE PREDICTION. AAVE cryptocurrency
2024-04-20 08:10