Following a quiet stretch around the important $6 mark, Polkadot‘s price saw strong demand from buyers, triggering a noticeable surge upwards.
As a result, the crucial 0.5 Fibonacci level ($8.8) appears to be Polkadot’s next mid-term target.
Polkadot Price Analysis: Technicals
By Shayan
The Daily Chart
In our detailed examination of Polkadot’s current market situation, we observed some significant shifts in market dynamics. By taking a closer look at the daily price chart, we noticed that following a period of consolidation around the strong support level of $6, buyers took charge, leading to a robust price increase. This surge allowed DOT to regain its previous 200-day moving average of $7, suggesting a positive long-term trend for Polkadot’s price movement.
In contrast, Polkadot encounters notable hurdles ahead with the $8.1 mark representing the 100-day moving average and the $8.8 level being the 0.5 Fibonacci retracement point. These significant milestones, along with the crucial support offered by the 200-day MA, act as essential guides for Polkadot in the immediate future and could significantly impact market tendencies over the next few weeks.
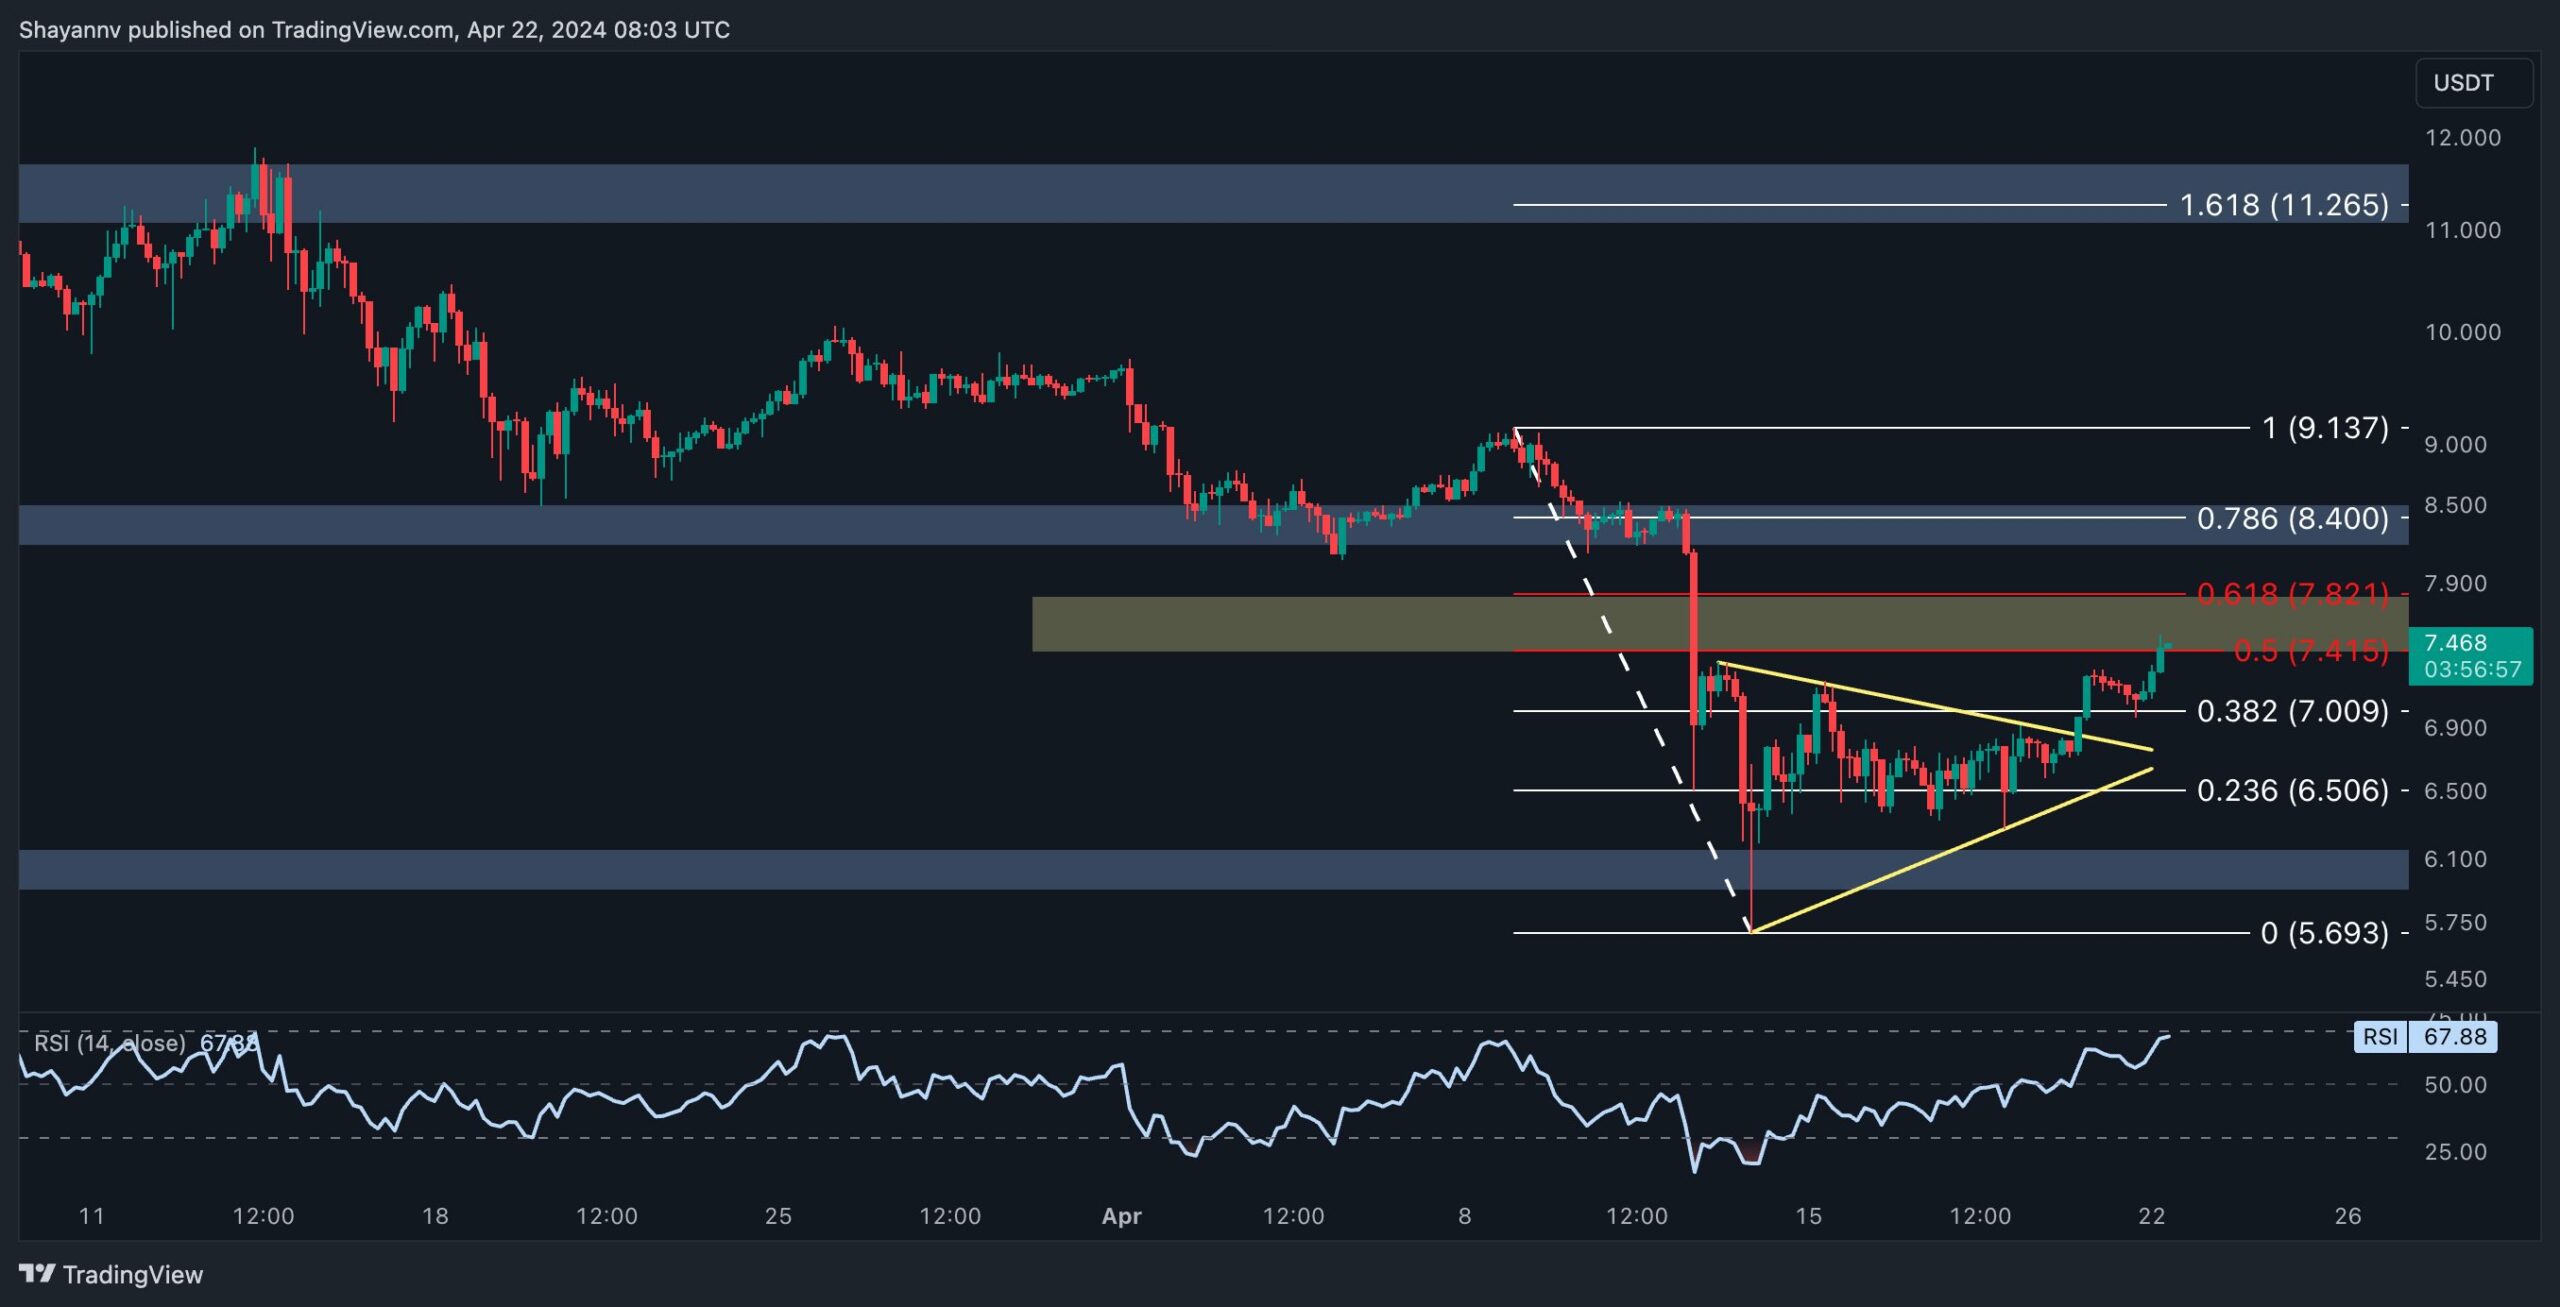
The 4-Hour Chart
Examining the price action over the past 4 hours reveals a triangle pattern, which emerged after a lengthy period of indecision around the significant $6 level. However, the price managed to break above the triangle’s upper boundary, signaling the strength of buyers and maintaining the bullish trend.
Right now, the Polkadot price is at a pivotal point between the $7.4 (0.5 Fibonacci level) and $7.8 (0.618 Fibonacci level), which could hold large amounts of selling pressure.
In other words, events occurring around this pivotal point are important because they may influence DOT‘s future trajectory. If DOT manages to surpass this vital area, it is likely that the existing upward trend will persist, taking us closer to the crucial resistance level of $8.8.
Sentiment Analysis
By Shayan
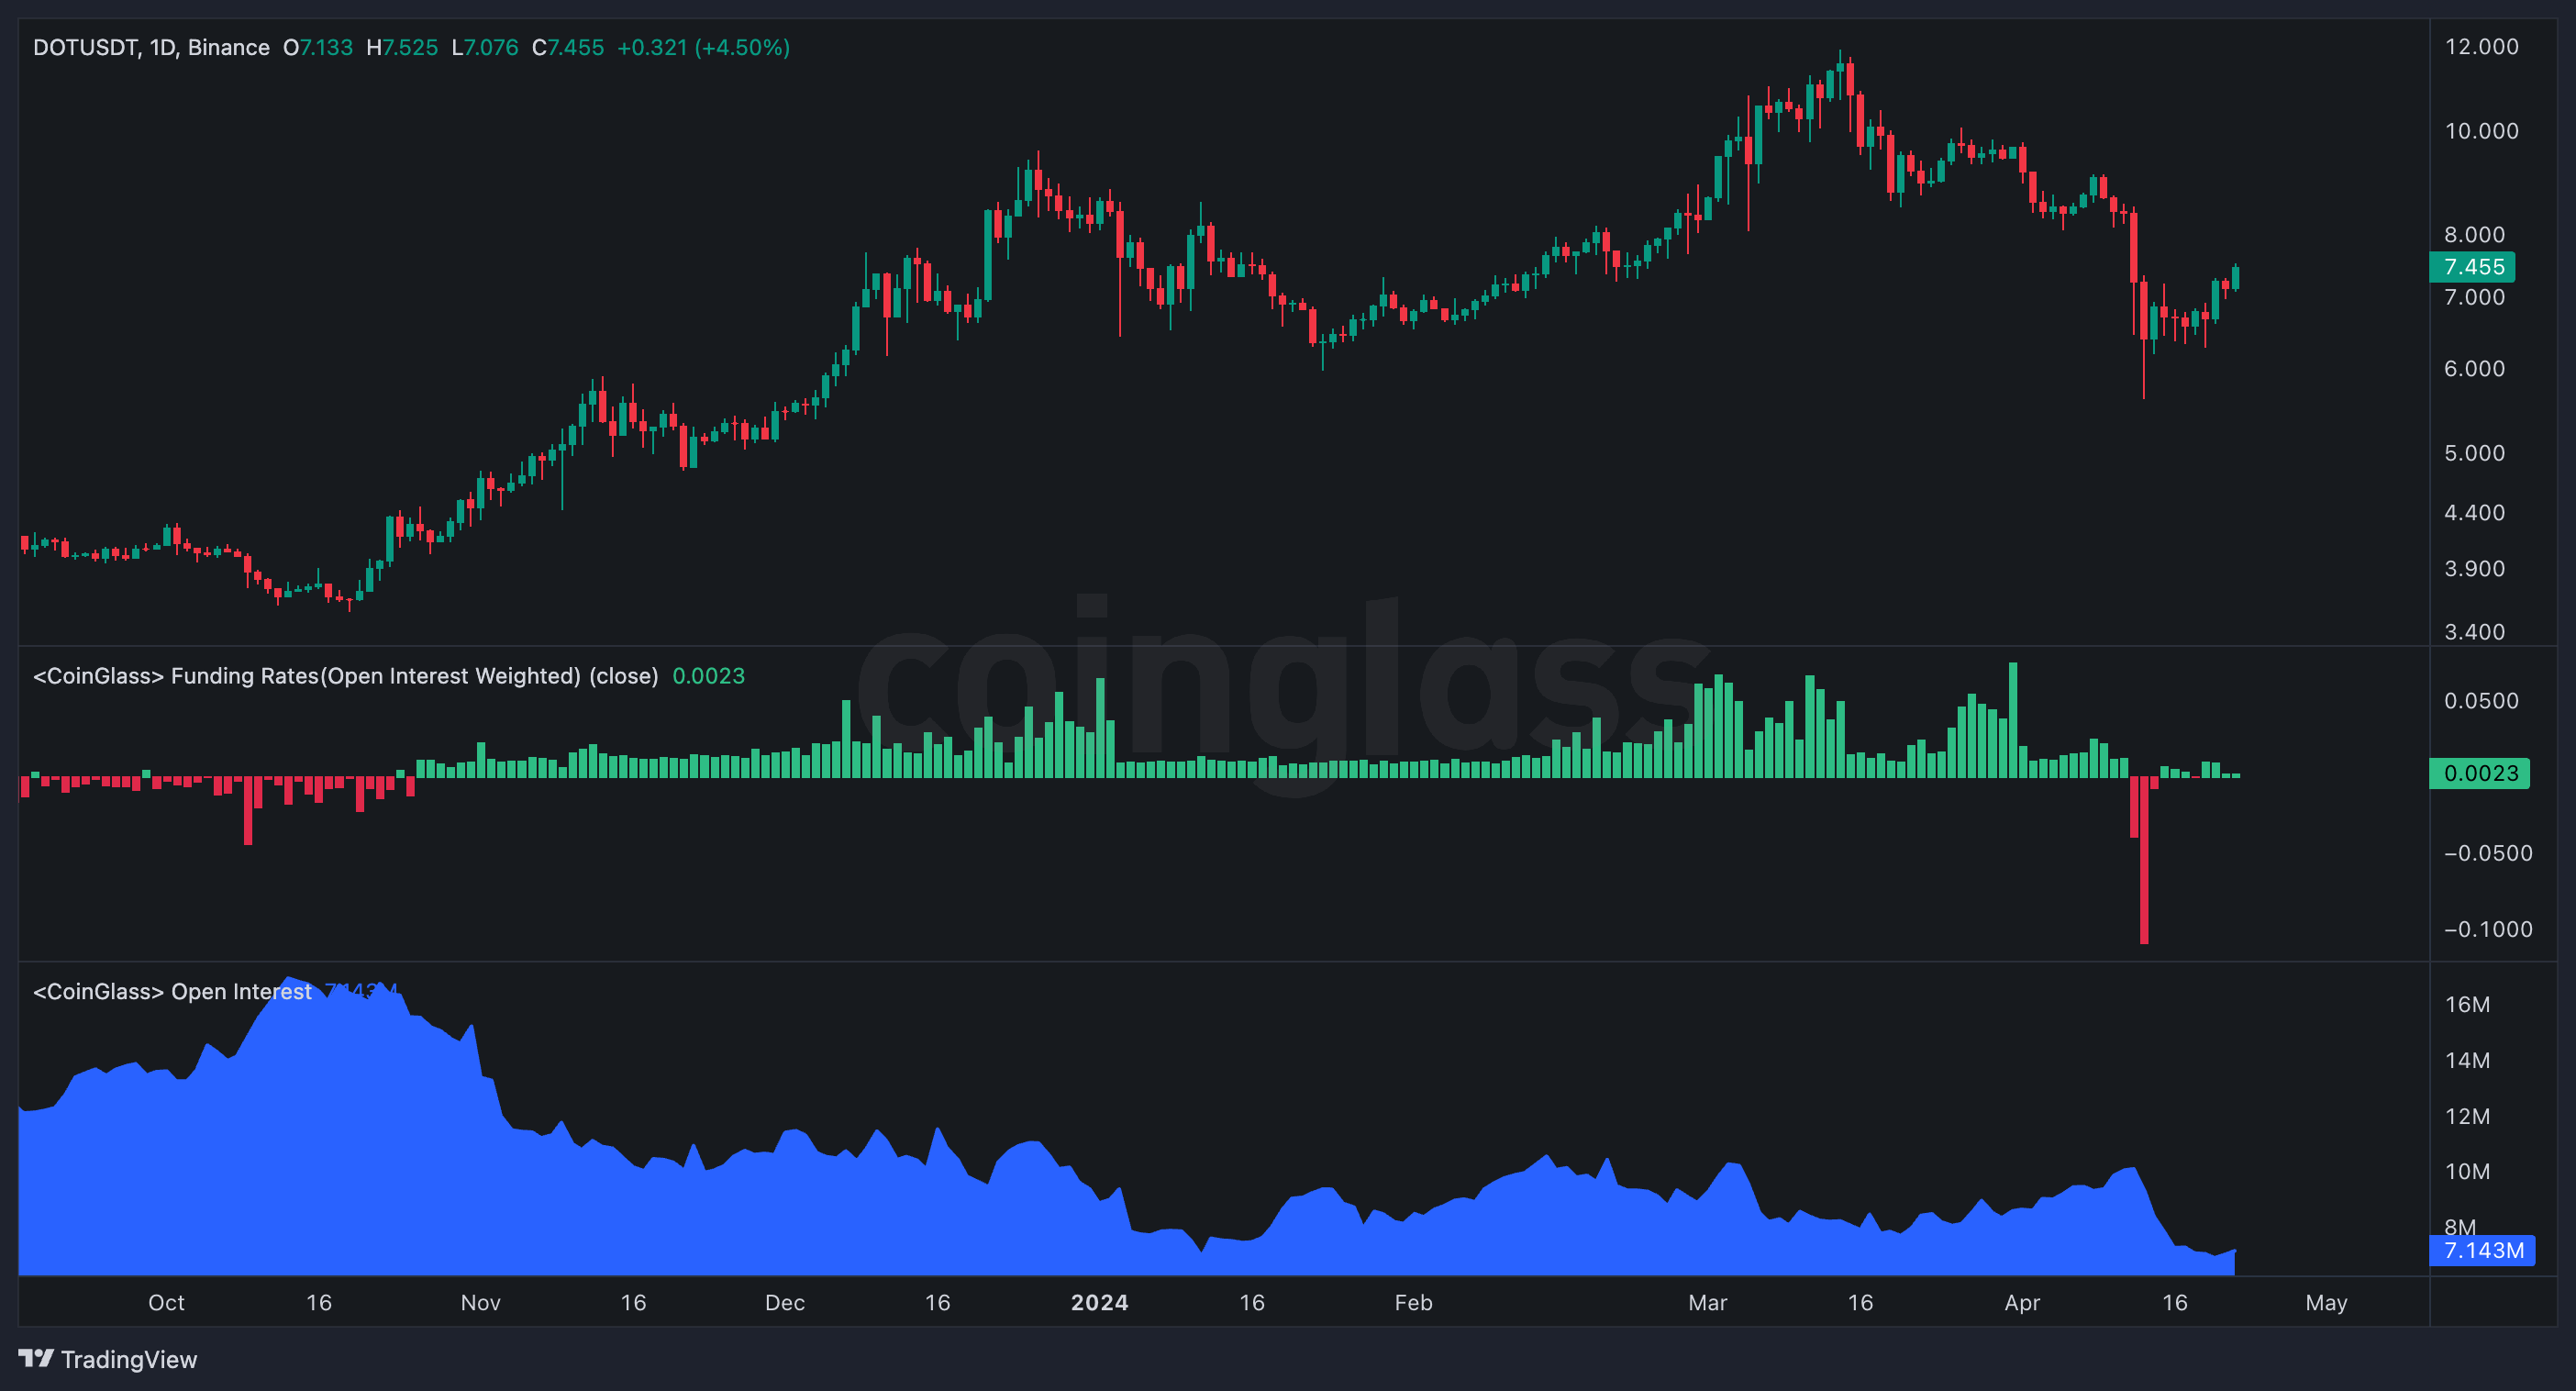
The ongoing cryptocurrency futures market significantly influences price movements, as traders take on long or short contracts. This results in heightened market instability and quick price swings. By examining the market sentiment and intensity of these positions, traders and investors can gain essential information to make informed decisions.
The chart below provides a visualization of Funding Rates and Open Interest in relation to Polkadot’s price fluctuations. It is clear from the chart that after a substantial drop in Polkadot’s value, both metrics have also decreased.
The futures market indicates a significant reduction in activity and the liquidation of numerous positions, suggesting it has become more subdued. Furthermore, the funding rate metric shows almost no value, signaling a neutral stance for this market.
The combination of these elements suggests that the market is ready for a surge of activity, possibly allowing for the restoration of buy and sell orders. As a result, it’s expected that Polkadot will undergo increased volatility in the near future, which could result in substantial price fluctuations.
This post has been powered by Polkadot
Read More
- W PREDICTION. W cryptocurrency
- AEVO PREDICTION. AEVO cryptocurrency
- PENDLE PREDICTION. PENDLE cryptocurrency
- AAVE PREDICTION. AAVE cryptocurrency
- REF PREDICTION. REF cryptocurrency
- MEMEAI PREDICTION. MEMEAI cryptocurrency
- JGN PREDICTION. JGN cryptocurrency
- WELT PREDICTION. WELT cryptocurrency
- USD PLN PREDICTION
- SPA PREDICTION. SPA cryptocurrency
2024-04-22 15:06