Ethereum has hit a rough patch recently, but it’s now receiving support from a strong area. This area includes its 100-day moving average and an important price range between the 0.5 and 0.618 Fibonacci levels. As a result, there’s optimism for Ethereum to bounce back in the near future.
Technical Analysis
By Shayan
The Daily Chart
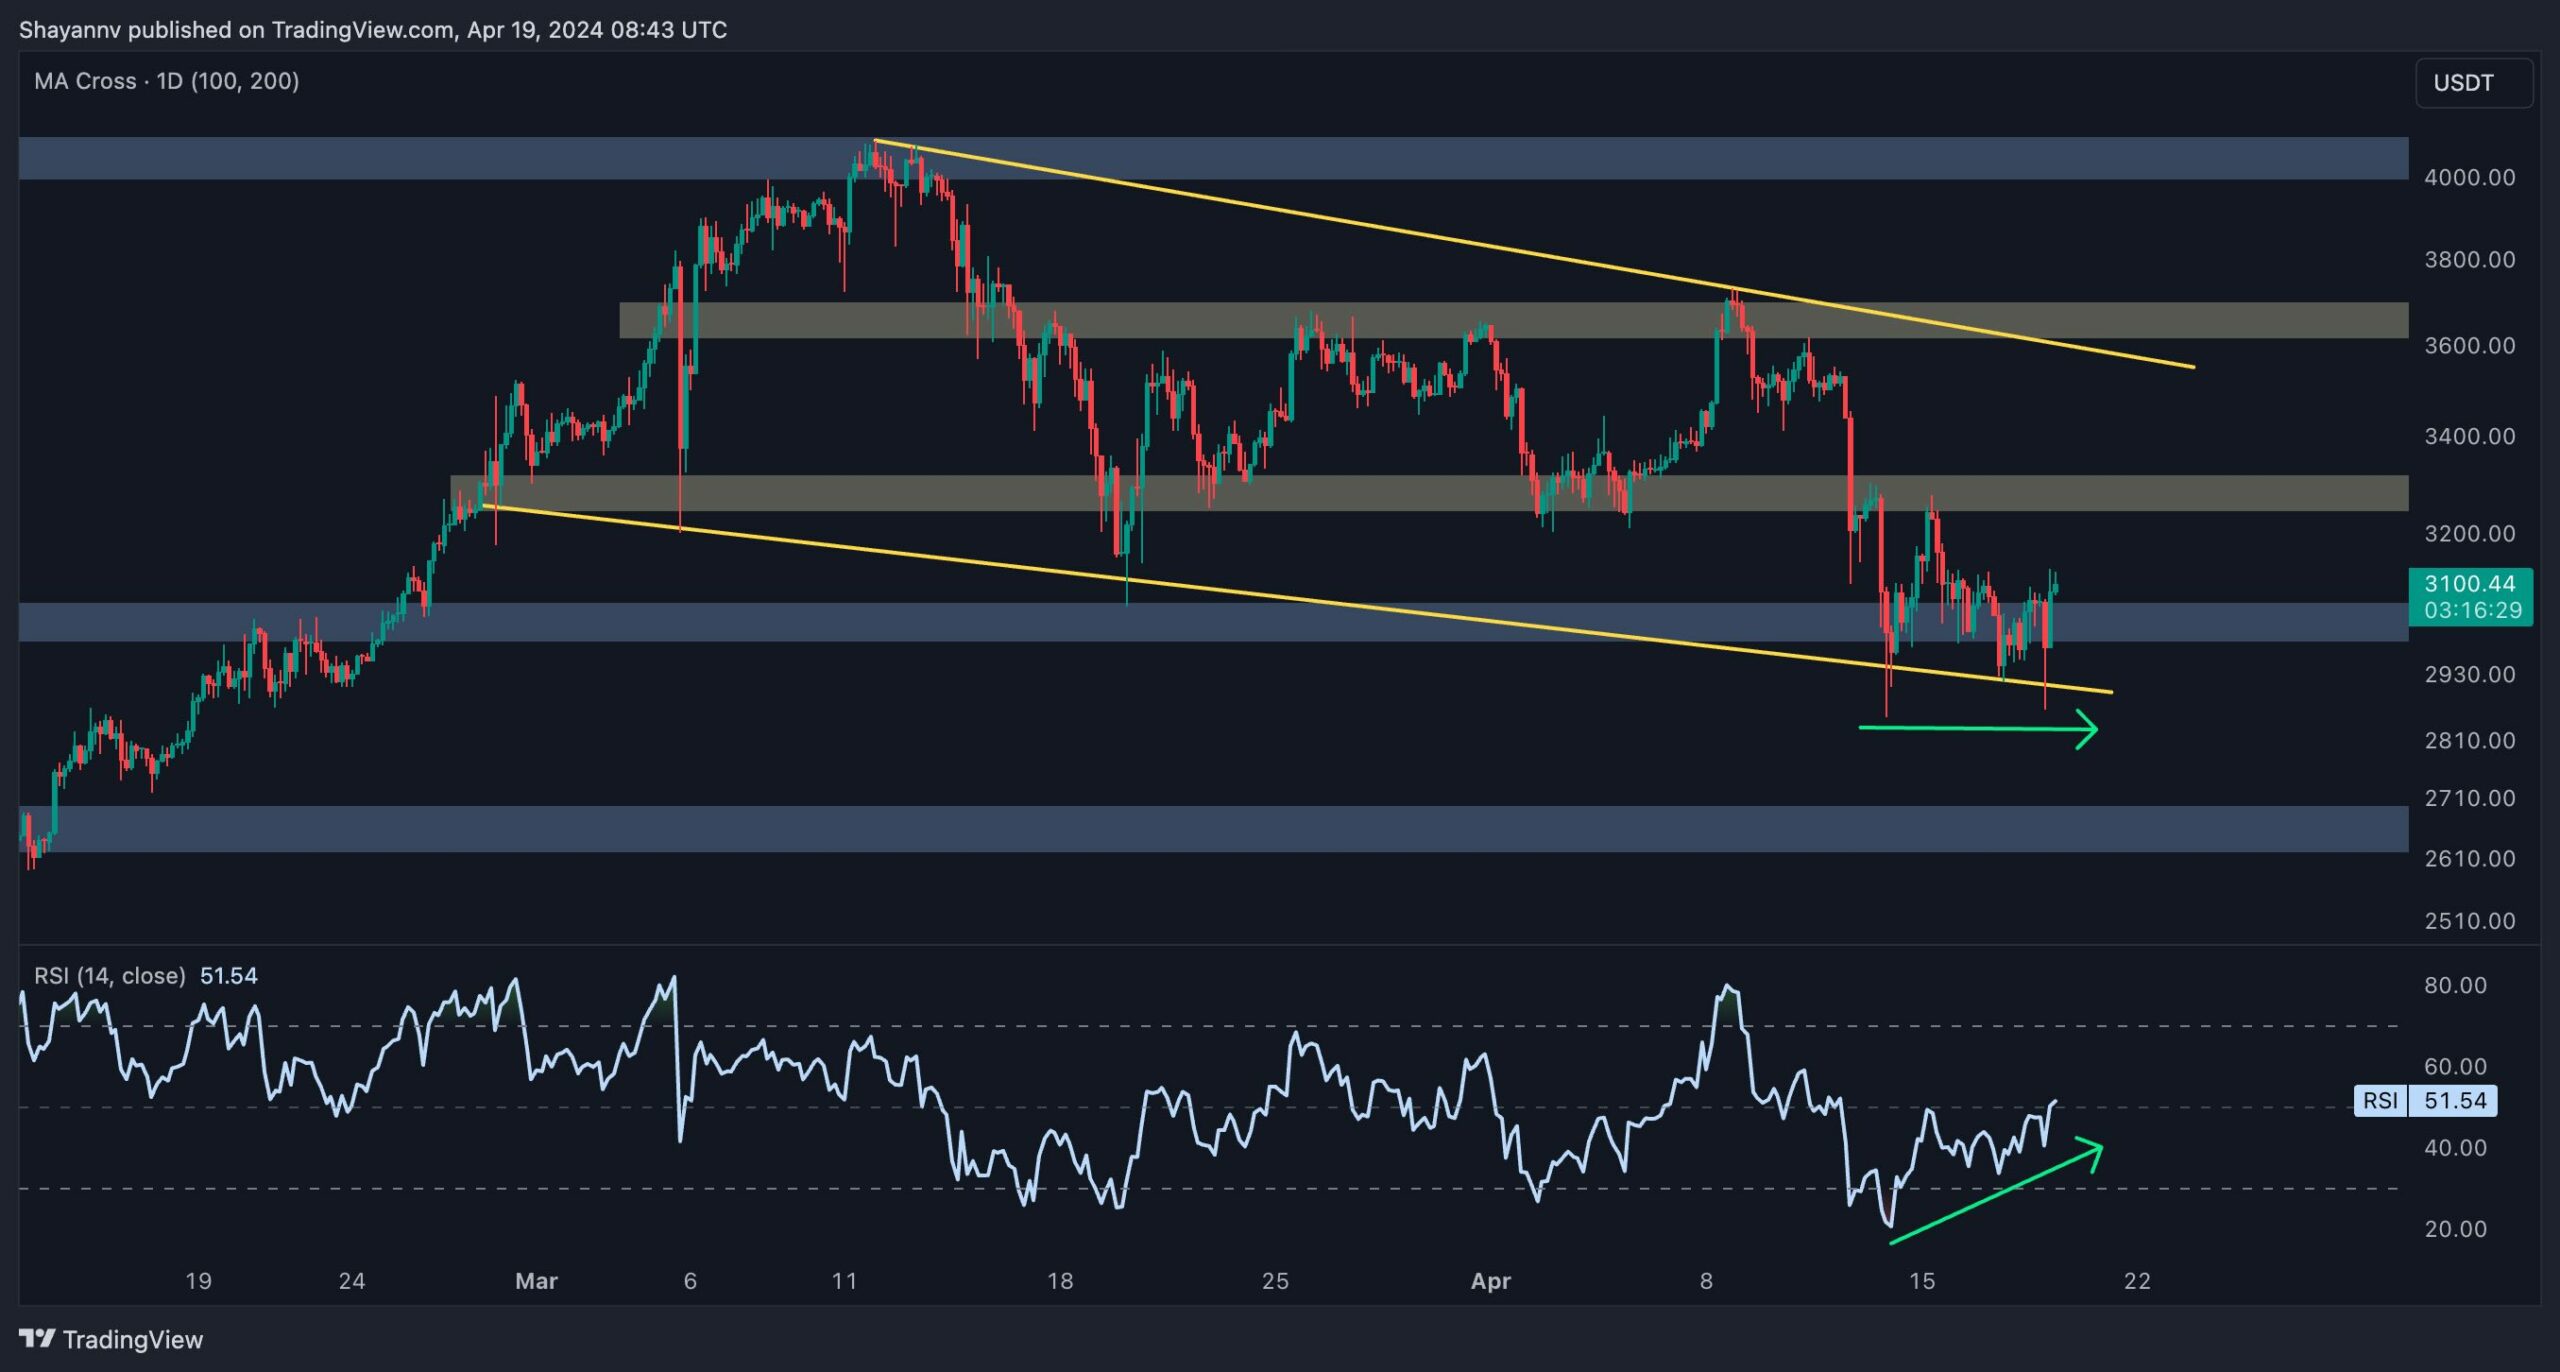
Looking closely at the daily price chart reveals several weeks of price declines, or corrections, which ended when the price reached and bounced off a significant support level.
Within this area lies the $3050 mark, which represents the 100-day moving average, as well as a notable price span stretching from approximately $3190 to around $2972. These values correspond to the 0.5 and 0.618 Fibonacci levels, respectively.
The price range is important as it draws strong interest, which might prevent additional selling pressure from the market. Furthermore, there’s a slight bullish signal from the RSI (Relative Strength Index) line not aligning with the price trend, suggesting a possible price increase towards reclaiming the $3.5K mark. However, even with these positive signs, a sudden drop below this crucial support level could lead to a chain reaction that brings the price down to the 200-day moving average at $2.5K.
The 4-Hour Chart
Looking more closely at the price action on the 4-hour chart, we notice the development of a descending triangle formation during a lengthy correction period. After a notable drop, the price has touched the lower edge of this pattern and is currently hovering near the $3K support area.
Despite the possible demand for purchasing at this important level, the price is now going through a quieter period where prices don’t fluctuate much.
The current price movement represents a battle between buyers and sellers. However, a significant discrepancy between the price and the RSI indicator on the 4-hour chart implies that buyers have more power, boosting the chances of a bullish trend in the near future. In this case, the next objective for the price would be the crucial resistance point at $3.5K. Alternatively, if there’s a breach of the support level, a slide towards the $2.7K support becomes more likely.
Sentiment Analysis
By Shayan
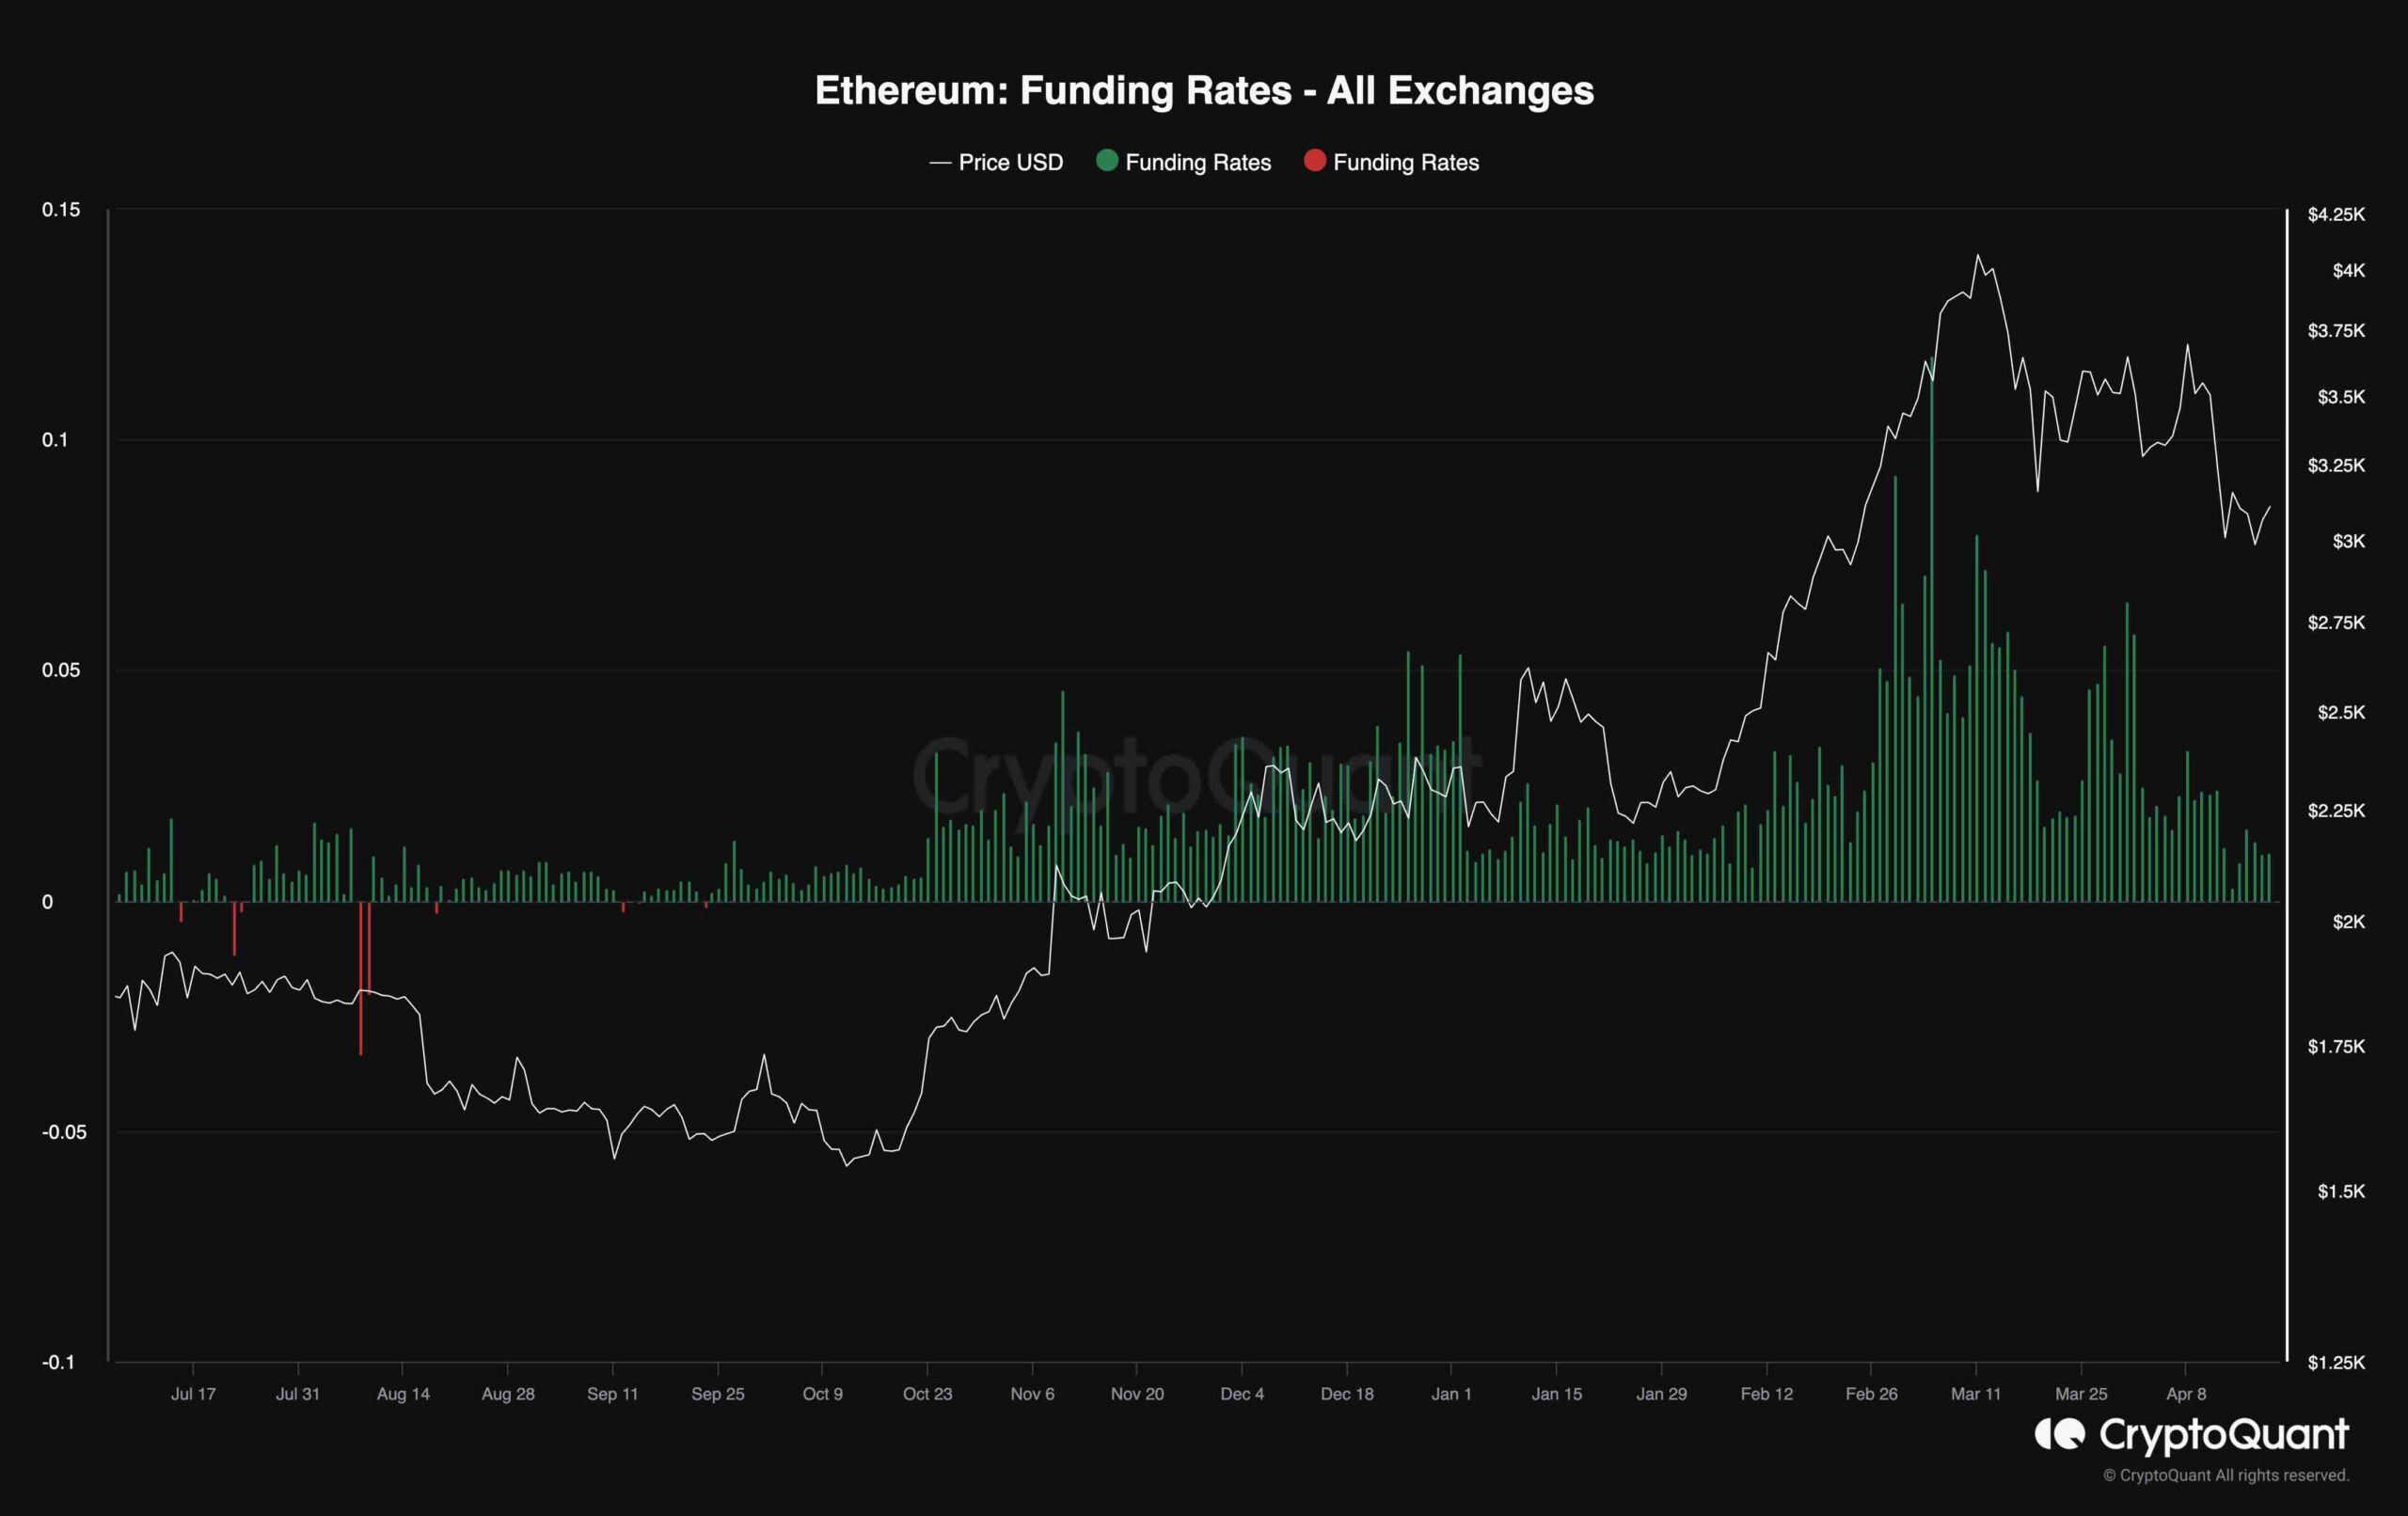
When Ethereum’s price starts to bounce back, it’s important to figure out if this revival is due to regular purchases or futures contracts with leverage. A useful indicator for this assessment is funding rates: if they are positive, it means investors are optimistic, while negative values suggest market anxiety.
In simpler terms, the price decrease of Ethereum over the past while has been reflected in the funding rate, which has also dropped significantly and nearly reached zero. This correlation implies that many positions were liquidated in the perpetual market due to the price drop, causing a cooling effect on Ethereum futures. As a result, there seems to be an opportunity for new long positions, potentially leading to another price increase.
Read More
- Finding Resources in Palworld: Tips from the Community
- UFO PREDICTION. UFO cryptocurrency
- Skull and Bones: Navigating the Quest for Extra Teeth in the Game
- AAVE PREDICTION. AAVE cryptocurrency
- Uncovering the Mystery of Red King Players in Clash Royale – What Reddit Users Have to Say
- BONE PREDICTION. BONE cryptocurrency
- The Last Epoch Dilemma: Confronting the Gold Dupe Crisis
- Discovering the Infinite Power: The Abiotic Factor that Could Change Everything
- Unveiling the Mystery of Palworld IVs: What Redditors Have to Say
- Gaming News: Like a Dragon: Infinite Wealth’s Dondoko Island Takes Expansion to New Heights
2024-04-20 08:30