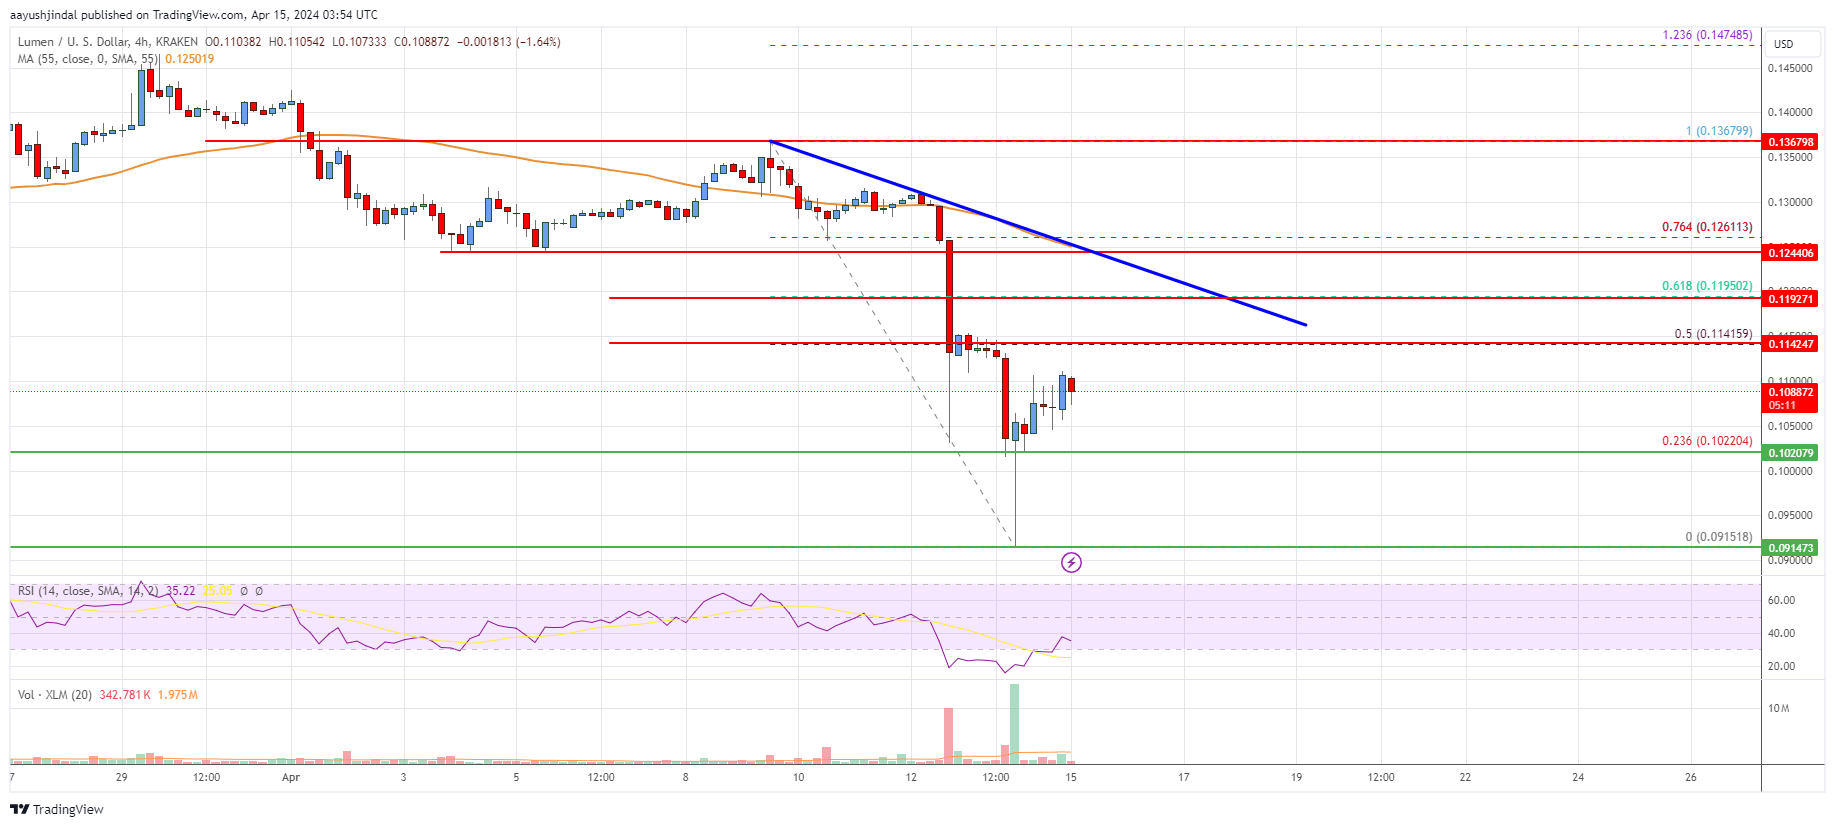
- Stellar lumen price is attempting a recovery wave from the $0.0920 zone against the US Dollar.
XLM price is now trading below $0.1200 and the 55 simple moving average (4 hours).
There is a key bearish trend line forming with resistance at $0.1195 on the 4-hour chart (data feed via Kraken).
The pair could start a decent increase if there is a clear move above the $0.1200 resistance zone.
The price of Stellar Lumens (XLM) on the dollar chart is holding steady above the $0.1020 mark, mirroring Bitcoin‘s pattern. For XLM to regain bullish energy, it needs to surpass the $0.1200 threshold.
Stellar Lumen Price Analysis (XLM to USD)
Following a continuous upward trend, the price of Stellar lumen versus the US dollar reached a resistance point around $0.1365. Consequently, the XLM/USD pair dipped below the $0.1200 support level and approached the $0.1150 mark.
Near $0.09151, a depression in price formed and now the market is trying to bounce back. The price surpassed the previous resistance at $0.1000. It also rose above the 23.6% mark of the fibonacci retracement, which represents the downward trend from the peak of $0.1367 to the trough of $0.09151.
XLM currently trades under $0.1200 and the 4-hour Simple Moving Average (SMA) of $0.1200. On the positive side, the price encounters resistance around $0.1142 – a point close to the 50% Fibonacci retracement level of the price drop from the peak at $0.1367 down to the low at $0.09151.
An approaching significant resistance lies around $0.1195. Additionally, a notable downward trendline emerges on the 4-hour chart at this level, adding to the resistance. Overcoming $0.1195 could potentially propel the price towards $0.1250.
If the price continues to rise, it may reach $0.1285 or even $0.1320. On the other hand, if it falls further, support can be found around $0.1050. The significant support lies at $0.1000. In the event of more losses, the price could drop to $0.0920 in the short term, and there’s a possibility it might revisit $0.0880.

The graph shows that XLM is currently priced below $0.1150 and the 4-hour Simple Moving Average (SMA) of $0.1155. If XLM manages to break above the resistance level of $0.120, it may initiate a significant price rise.
Technical Indicators
4 hours MACD – The MACD for XLM/USD is losing momentum in the bearish zone.
4 hours RSI – The RSI for XLM/USD is now below the 50 level.
Key Support Levels – $0.1020 and $0.0920.
Key Resistance Levels – $0.1142, $0.1195, and $0.1250.
Read More
- Hades Tier List: Fans Weigh In on the Best Characters and Their Unconventional Love Lives
- Smash or Pass: Analyzing the Hades Character Tier List Fun
- Why Destiny 2 Players Find the Pale Heart Lost Sectors Unenjoyable: A Deep Dive
- PENDLE PREDICTION. PENDLE cryptocurrency
- Why Final Fantasy Fans Crave the Return of Overworlds: A Dive into Nostalgia
- Sim Racing Setup Showcase: Community Reactions and Insights
- W PREDICTION. W cryptocurrency
- How to Handle Smurfs in Valorant: A Guide from the Community
- FutureNet Co-Founder Roman Ziemian Arrested in Montenegro Over $21M Theft
- Understanding Movement Speed in Valorant: Knife vs. Abilities
2024-04-15 08:22