Experienced trader Peter Brandt recently shared a chart analyzing XRP’s potential for further price drops. He’s asking traders to predict how low XRP might go, and his chart suggests XRP hasn’t definitively broken out with strong momentum. Instead, it indicates the market is testing whether the price gains from late 2024 will hold as a stable base.
Peter Brandt, known as @PeterLBrandt on X (formerly Twitter), recently asked the XRP community how low he thinks the price of XRP could fall. He shared a chart and directly addressed XRP enthusiasts, affectionately calling them “Ripplettes,” to get their opinions.
What This Means For XRP
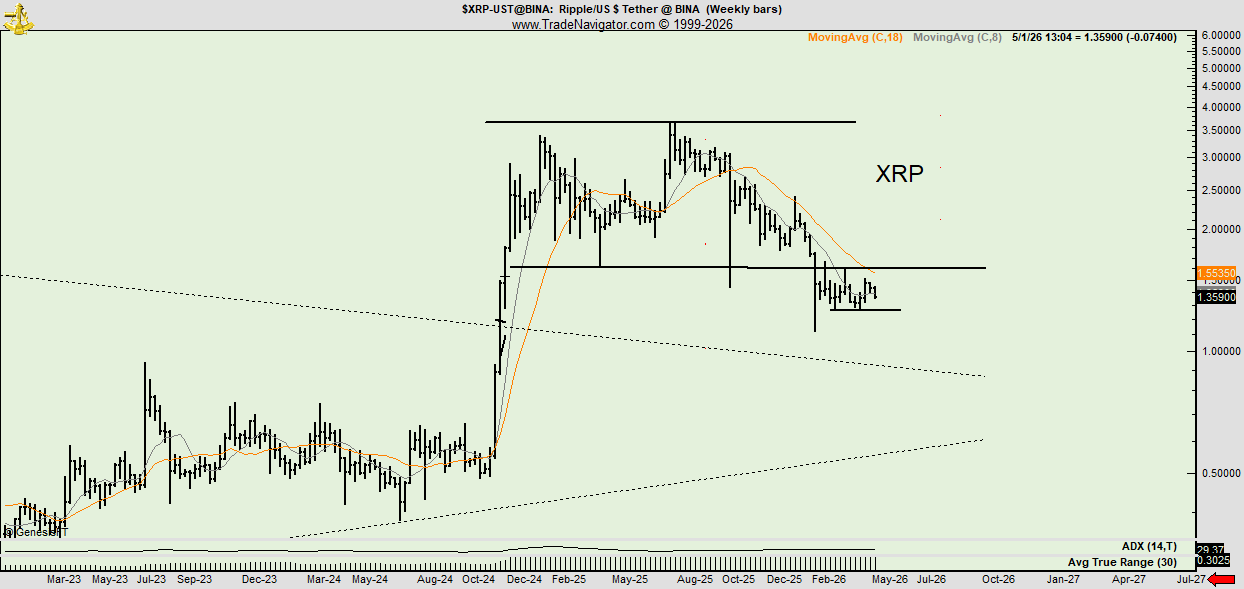
The chart shows the price of XRP against the US dollar on Binance, looking at weekly data. An analyst named Brandt identified a pattern starting with a long period of sideways price movement throughout 2023 and most of 2024. This was followed by a quick price increase in late 2024, then a period where the price moved sideways again, eventually dropping back slightly. A price level around $1.55 seems important, as the price previously traded in this range and is now testing it again.
The $1.55 price level helps explain why traders who believe XRP will rise (bulls) are feeling uneasy. XRP has already fallen below this point. When a price falls below a previous trading range, analysts often look for the next levels where buyers stepped in to support the price. According to Brandt’s analysis, these support levels appear as horizontal lines on his chart – one near the recent low point, another around a deeper support level after the initial price increase, and then the broader base that existed before the price started to rise.
The poll connected to the post clearly showed where support levels were. Brandt presented four options: a strong bottom, support around .93, support around .72, and just above zero.
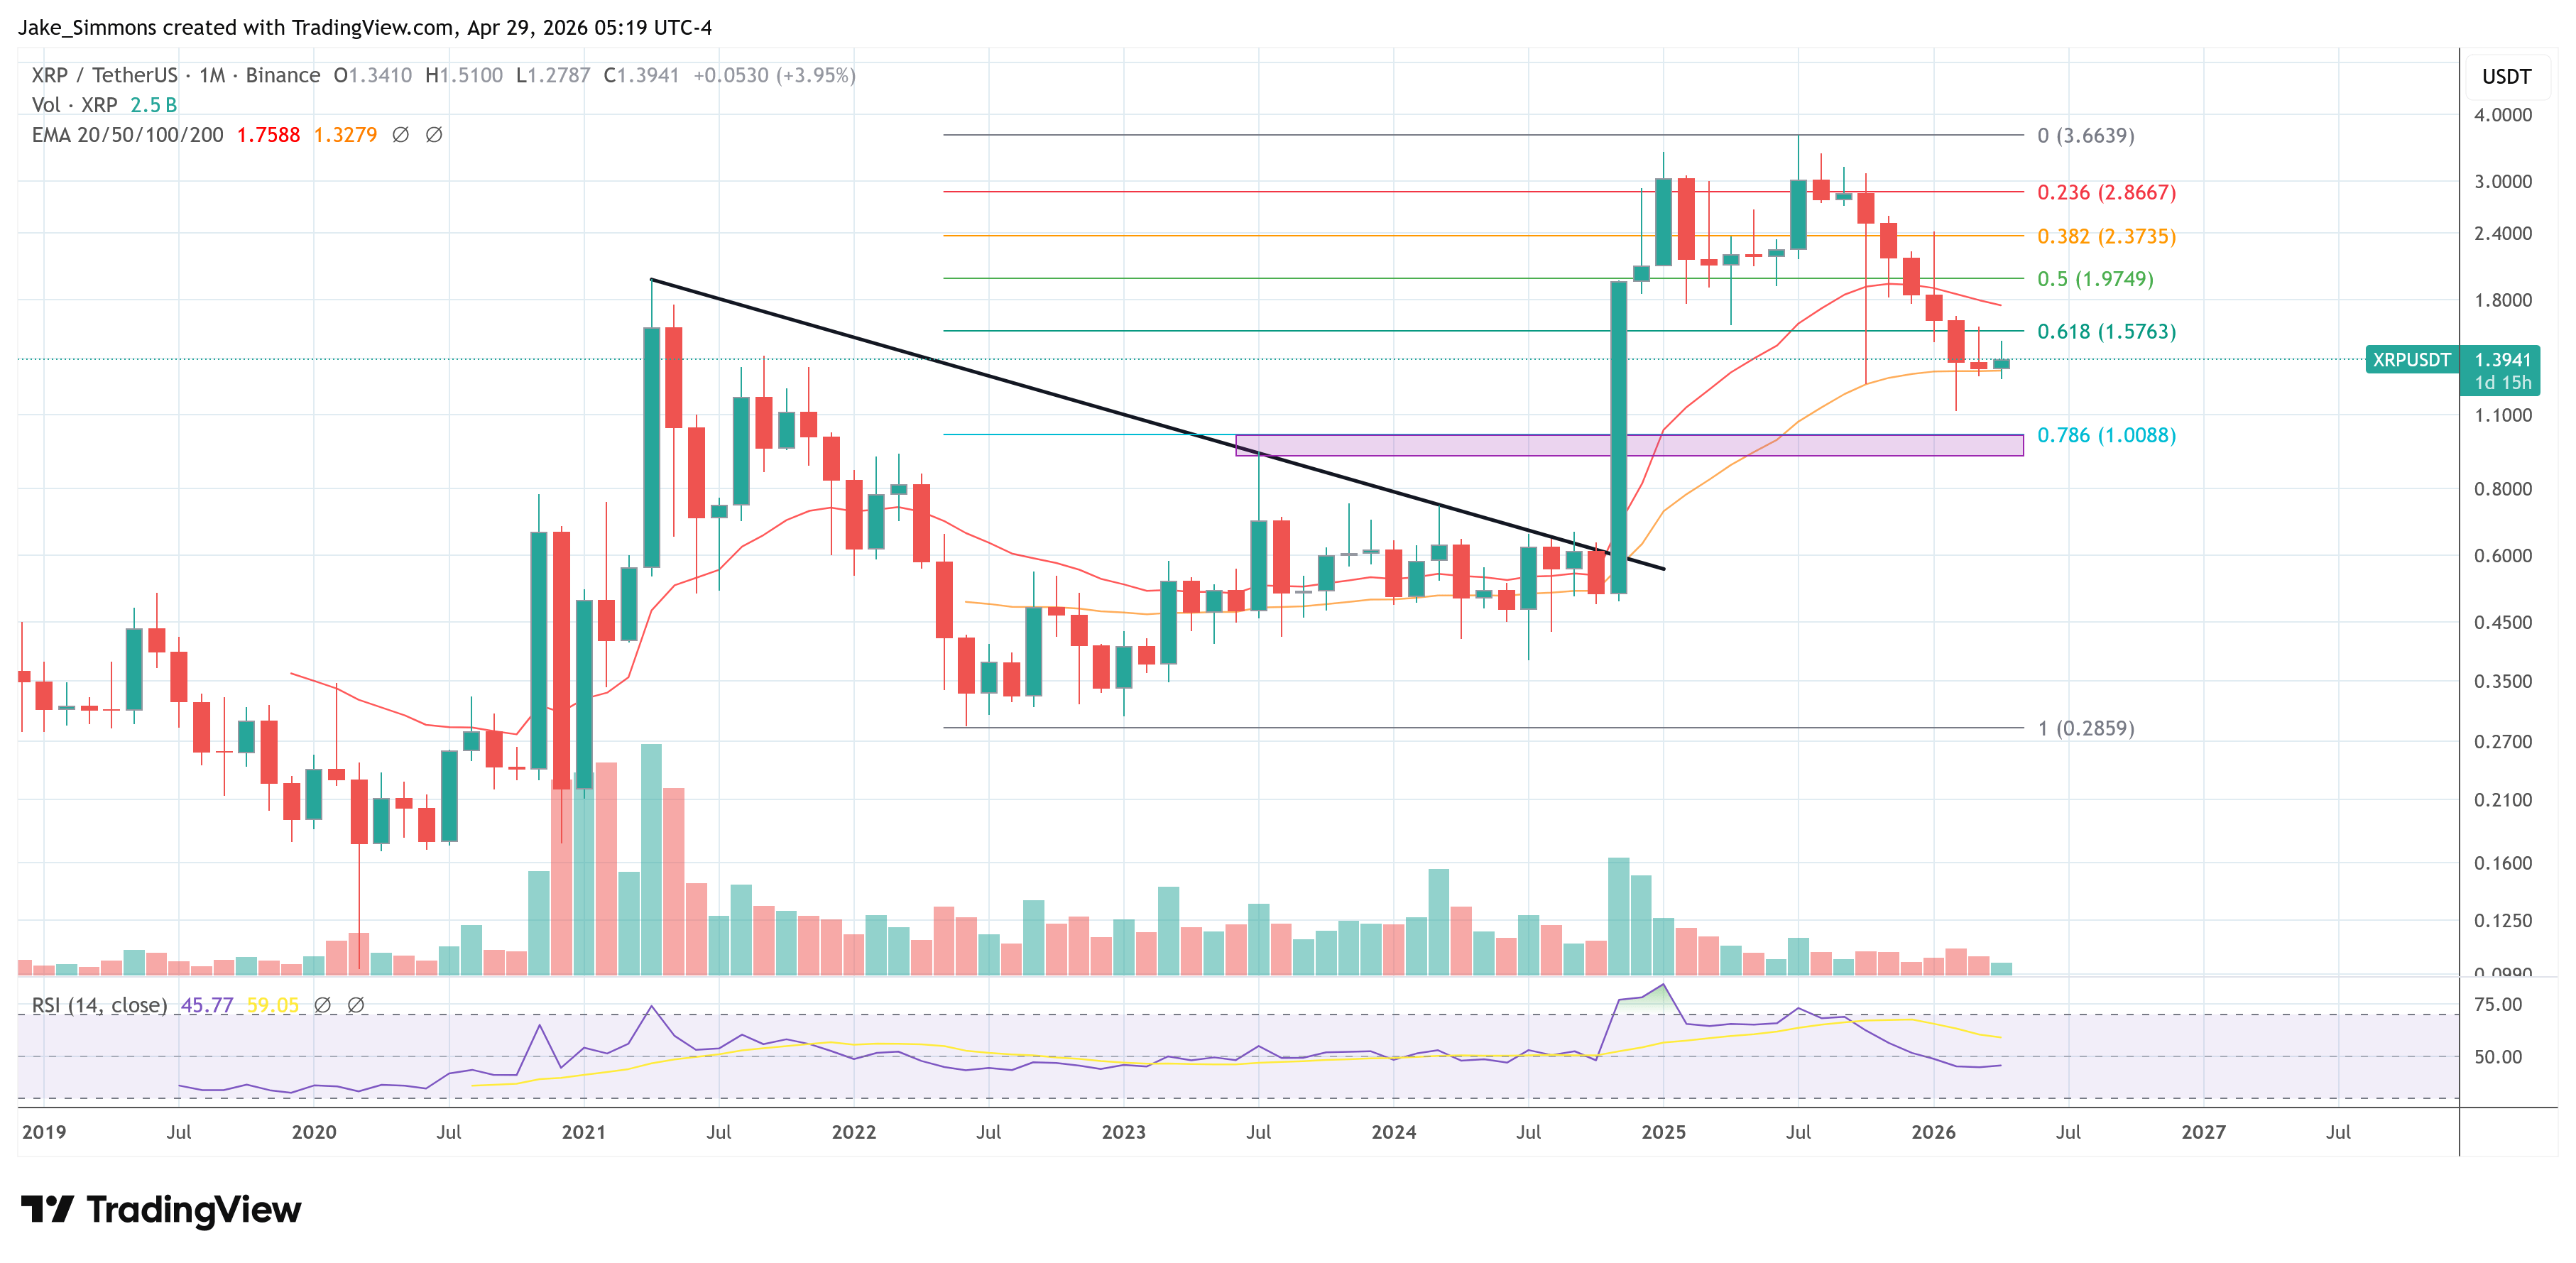
The price level around $0.93 seems to be based on a downward trend that started at the high point in 2021. The $0.72 level is a more significant support area. Looking at the weekly chart, it corresponds with an upward trendline that formed XRP’s previous trading range in 2023-2024, and a long-term support line that existed before the price increase in late 2024. This means it’s not an arbitrary price point, but rather a potential complete retest of the previous breakout pattern.
Brandt seems to be pointing out a common pattern: when XRP makes a big jump in price, followed by a breakout from a period of stability, it often fails to maintain that momentum. Specifically, XRP recently broke out of a long period of sideways trading, surged past $3, and then entered a choppy phase with several unsuccessful attempts to climb further.
As a crypto investor watching XRP, I’m looking at the $1.55 level as a key point. If XRP can break back above that price and *stay* there on the weekly chart, it suggests we’re just seeing a healthy pullback after a breakout, not a sign that the whole uptrend is falling apart. Basically, it’ll confirm the breakout is still valid if we can hold above $1.55.
If the price rises back to its previous high, it suggests buyers are still trying to protect that level and the initial upward move after breaking through it hasn’t completely failed. However, if the price doesn’t recover, then lower support levels become more important, as the price will stay below the previous trading range.
A recent poll revealed traders were quite divided on whether the recent price drop had bottomed out. Three options – “Bottom is in,” “Support at .72xx,” and “Slightly above zero” – each received 27% of the votes. A more conservative view, “Support at .93xx,” received 19% of the votes and was highlighted in a screenshot. With nearly 12 hours left, the poll had 364 responses, and XRP was trading at $1.3941.
Read More
- Scientology speedrun trend escalates as viewers map out Hollywood facility
- Vegan nugget startup founder charged with assaulting influencer ex-girlfriend Evelyn Ha
- Makoto Kedouin’s RPG Developer Bakin sample game is now available for free
- NBA 2K26 Season 6 Rewards for MyCAREER & MyTEAM
- Where Winds Meet’s new Hexi expansion kicks off with a journey to the Jade Gate Pass in version 1.4
- Over Your Dead Body Ending Explained: Who Survives The Grisly Anti-Romcom (And What It’s All About)
- MrBeast lets fans from every country vote for Beast Games Season 3 contestants
- What Fast Mode is in Bannerlord and how to turn it on
- How to Get to the Undercoast in Esoteric Ebb
- Seeing Beneath the Surface: AI Advances in Skin Disease Diagnosis
2026-04-30 21:06