The token, which once soared to $2.40 like it had a personal vendetta against gravity, now looks like a deflated balloon. 🎉💥 Traders are now debating whether this is a temporary nap or the beginning of a long, sad siesta. 🧠
Speculative Demand Fades as Price Consolidates
In a recent chart, signs of weakening momentum appeared not long after WLD topped above $2.40. As the price declined, the 4-hour chart began to show a pattern of lower highs, signaling that sellers were steadily regaining control. Despite brief relief rallies, the broader market structure has remained bearish, keeping the token pinned closer to local support levels. 📉📉
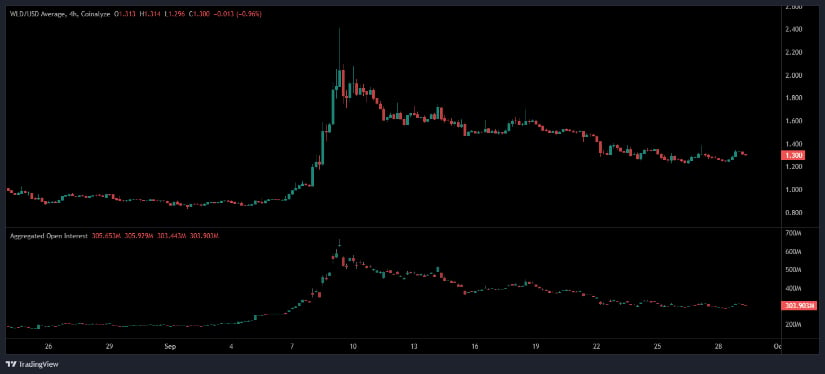
Open Interest (OI) data is like a broken scale-during the rally, it was skyrocketing, but now it’s plummeting faster than a poorly made soufflé. 🥮 This suggests that many of those long positions were liquidated, and speculative appetite has cooled dramatically. 🧊
Currently, aggregated OI stands at roughly $303 million, well below the levels recorded during September’s highs. This indicates that traders are adopting a more defensive stance, deploying less leverage and waiting for stronger signals before committing fresh capital. Without a meaningful recovery in OI and trading volume, it will be difficult for the coin to establish lasting bullish traction. 💸
Market Metrics Highlight Fragile Recovery Signs
According to BraveNewCoin, Worldcoin is trading at $1.31, marking a 4.80% gain in the past 24 hours. The token’s market capitalization stands at $2.76 billion, supported by a daily trading volume of $161.8 million. 📈 But let’s be real-this is just a tiny flicker of hope in a sea of despair. 😴
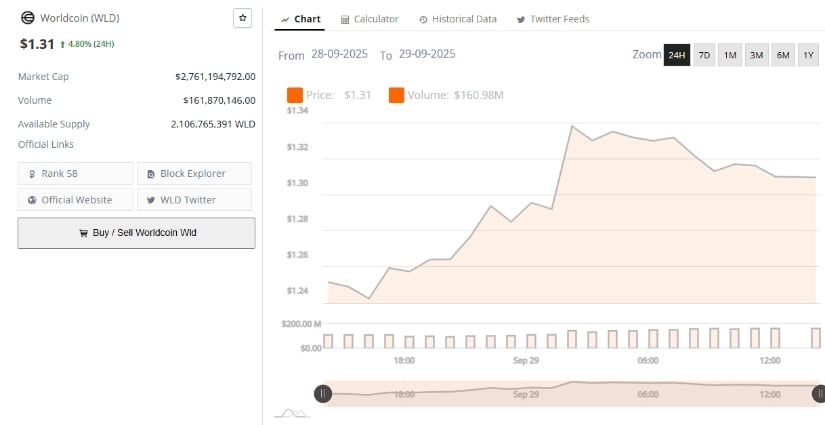
Despite the broader correction, this short-term gain hints that some bargain hunters may be stepping in at lower levels. The fact that the token has managed to post positive daily performance suggests that support near the $1.20-$1.25 zone is attracting buyers. 🕵️♀️
Technical Signals Warn of Persistent Bearish Pressure
The TradingView daily chart reinforces the cautious outlook. WLD is currently trading well below the Bollinger Band basis at $1.48, keeping it closer to the lower band at $1.15. Historically, when a token trades near or below the lower band, it reflects persistent selling momentum and bearish dominance. 🏹
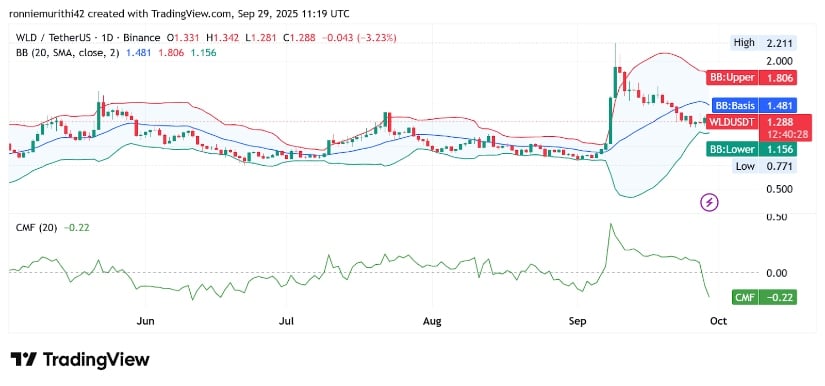
Adding to the bearish tone, the Chaikin Money Flow (CMF) sits at -0.22, indicating capital outflows far exceed inflows. This negative reading suggests that buyers remain hesitant and that selling pressure continues to outweigh accumulation. 💸
Key levels now define the short-term roadmap. Support at $1.15 is critical – a breakdown below could push the coin toward the $1.00 psychological level. On the flip side, the token faces strong resistance around $1.48. Only a decisive close above this level would open the door for a test of higher ranges between $1.60 and $1.80. 🤷♀️
Read More
- Gold Rate Forecast
- Avengers: Doomsday Spoilers & Leaks Addressed By Director Joe Russo: “It’s Over-Policed”
- Assassin’s Creed is getting a live stage spin-off with parkour and choreographed fights
- INJ/USD
- STX/USD
- Detonate codes (December 2025)
- Crimson Desert Guide – How to Pay Fines, Bounties & Debt
- Apple TV’s Imperfect Women Becomes No. 1 Most-Watched Show Globally
- What is Omoggle? The AI face-rating platform taking over Twitch
- Pragmata: Every Hacking Mode, Ranked
2025-09-30 00:19