Author: Denis Avetisyan
A new approach uses real-time data and statistical modeling to quantify the probability of entering a period of significant market stress.
This paper introduces the Market Stress Probability Index (MSPI), a reproducible equity-only measure leveraging cross-sectional fragility signals and L1-regularized logistic regression for real-time monitoring.
Accurately gauging systemic risk remains a persistent challenge in financial econometrics, often relying on lagging indicators. This paper, ‘Algorithmic Monitoring: Measuring Market Stress with Machine Learning’, addresses this limitation by constructing the Market Stress Probability Index (MSPI), a novel, transparent measure designed to forecast equity market stress one month ahead. Utilizing cross-sectional stock characteristics and L_1-regularized logistic regression within a real-time expanding window, the MSPI delivers calibrated stress probabilities with improved accuracy compared to traditional benchmarks. Could this approach to algorithmic stress monitoring offer a more proactive and informative tool for risk management and financial stability assessment?
The Illusion of Control: Why Traditional Risk Assessments Fail
The proliferation of electronic and algorithmic trading has fundamentally reshaped financial markets, introducing dynamics that challenge the efficacy of conventional risk assessment techniques. These systems, while enhancing liquidity and speed, operate on complex feedback loops and can amplify market movements in ways not captured by historical volatility or correlation-based models. Traditional measures often assume linear relationships and normal distributions, yet modern markets exhibit non-linear behavior, herding effects, and ‘flash crashes’ – rapid, dramatic price declines – that defy these assumptions. The sheer velocity of trades executed by algorithms, often responding to minute price discrepancies, creates a dense web of interactions where systemic risk can accumulate unseen, demanding more sophisticated analytical tools to discern potential instabilities and accurately quantify exposure.
The intricate architecture of modern markets, known as market microstructure, profoundly influences the propagation of risk, yet conventional analytical tools frequently fall short in anticipating emerging vulnerabilities. These tools often rely on historical data and linear models, proving inadequate when faced with the non-linear, dynamic shifts inherent in high-frequency trading and algorithmic interactions. Subtle imbalances, order book distortions, and the build-up of hidden liquidity – indicators of latent stress – are often overlooked until they manifest as sudden price swings or flash crashes. Consequently, a deeper understanding of how these microstructural elements interact is essential; however, capturing these pre-crisis states requires moving beyond traditional statistical methods and embracing more sophisticated techniques capable of detecting nuanced changes within the market’s operational framework.
The capacity to pinpoint potential downside risk remains central to effective investment strategies and robust regulatory oversight, yet contemporary financial ecosystems present unprecedented challenges. Driven by high-frequency trading, complex derivatives, and the proliferation of algorithmic strategies, markets now operate at speeds and scales that overwhelm traditional risk assessment tools. These systems often rely on historical data and static models, proving inadequate when faced with rapidly evolving conditions and emergent systemic vulnerabilities. Consequently, there is a growing need for innovative solutions – incorporating real-time data analysis, machine learning techniques, and network theory – to proactively identify and mitigate threats before they cascade into broader market instability. These advanced methods aim to move beyond reactive risk management and enable a more anticipatory approach, safeguarding both investor portfolios and the overall financial system.
The MSPI: A Cross-Sectional View of Systemic Fragility
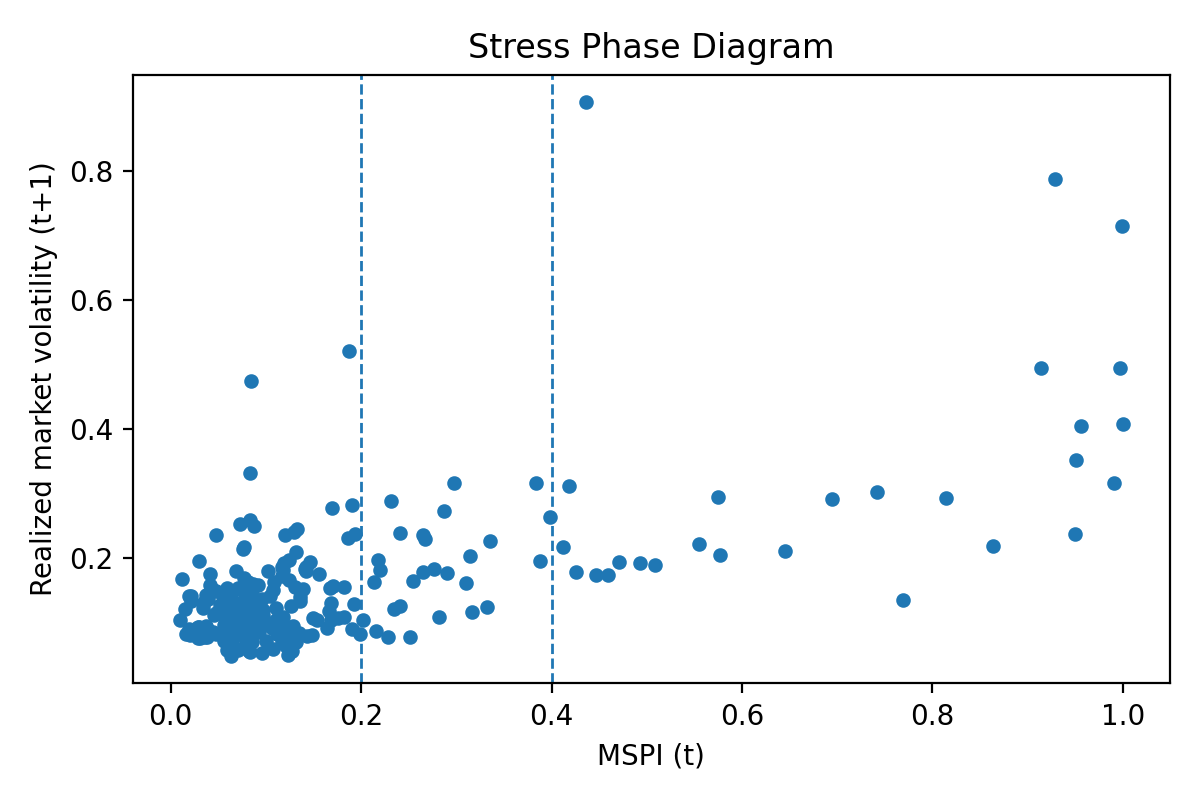
The Market Stress Probability Index (MSPI) quantifies the likelihood of near-term market stress by aggregating signals derived from the cross-section of financial instruments. This index doesn’t rely on time-series modeling of individual assets, but instead evaluates the collective fragility of the market at a specific point in time. The cross-sectional signals used in the MSPI’s construction are designed to identify assets exhibiting characteristics indicative of vulnerability to adverse shocks. These signals can include measures of liquidity, volatility, and credit spreads, among others. By combining these signals, the MSPI provides a composite measure of systemic risk, offering a current assessment of market stress levels and potential vulnerabilities.
The Market Stress Probability Index (MSPI) utilizes L1-regularized logistic regression as a key component of its model building process. This technique introduces a penalty term proportional to the absolute value of the coefficients during model training, effectively shrinking some coefficients to zero. This results in a sparse model – one with fewer non-zero parameters – which simplifies computation and reduces the risk of overfitting to historical data. Overfitting is particularly problematic in real-time applications where the model must generalize to new, unseen data; the sparsity enforced by L1 regularization enhances out-of-sample performance and ensures the MSPI remains computationally efficient for continuous, real-time assessment of market stress. The L_1 penalty is calculated as \lambda \sum_{j=1}^{p} | \beta_j |, where λ is a tuning parameter and \beta_j represents the model coefficients.
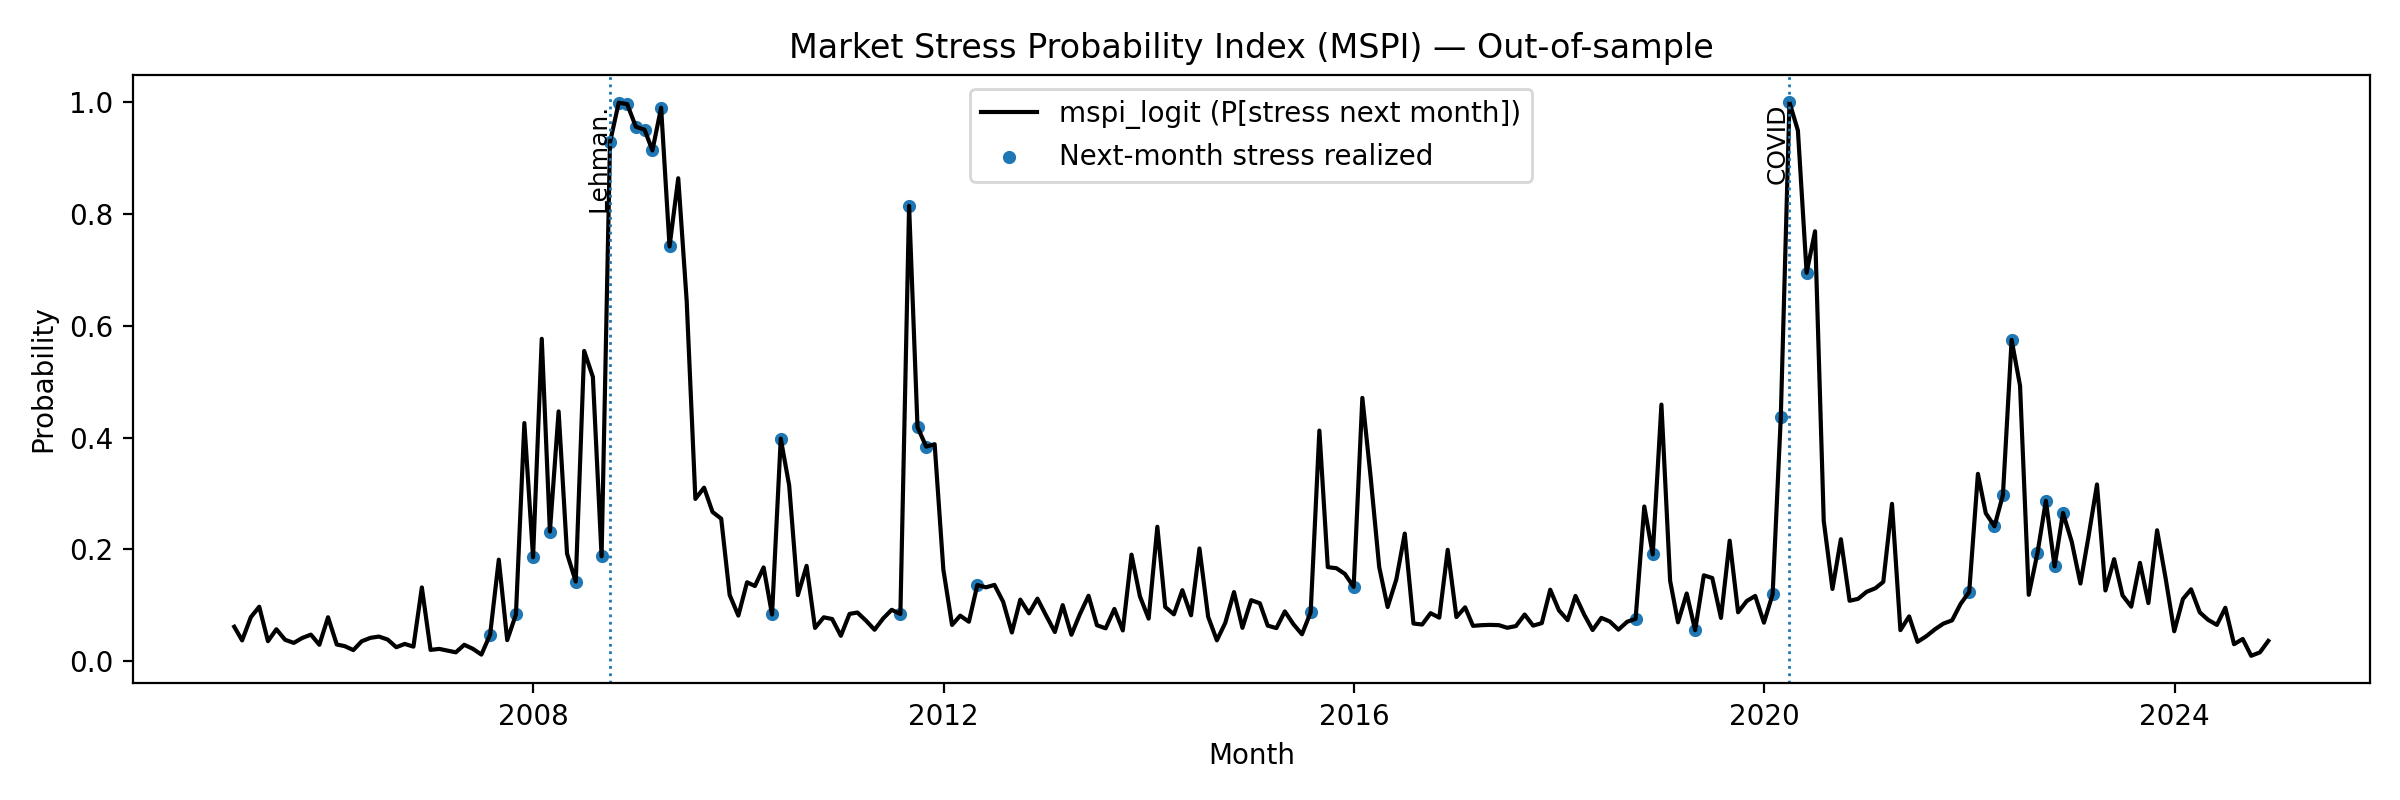
The Market Stress Probability Index (MSPI) utilizes a real-time expanding-window design to maintain current risk assessment capabilities. This methodology involves continuously incorporating new data while discarding the oldest observations, effectively shifting the analysis window forward in time. Parameter updates occur with each new data point, ensuring the model reflects the most recent market dynamics. The window size is fixed, and the model is re-estimated with each observation added, providing a continuously updated assessment of market stress probabilities without requiring computationally expensive re-estimations over the entire historical dataset. This approach prioritizes responsiveness to evolving conditions over incorporating potentially stale or irrelevant historical data.
Empirical Evidence: Validating the MSPI’s Predictive Power
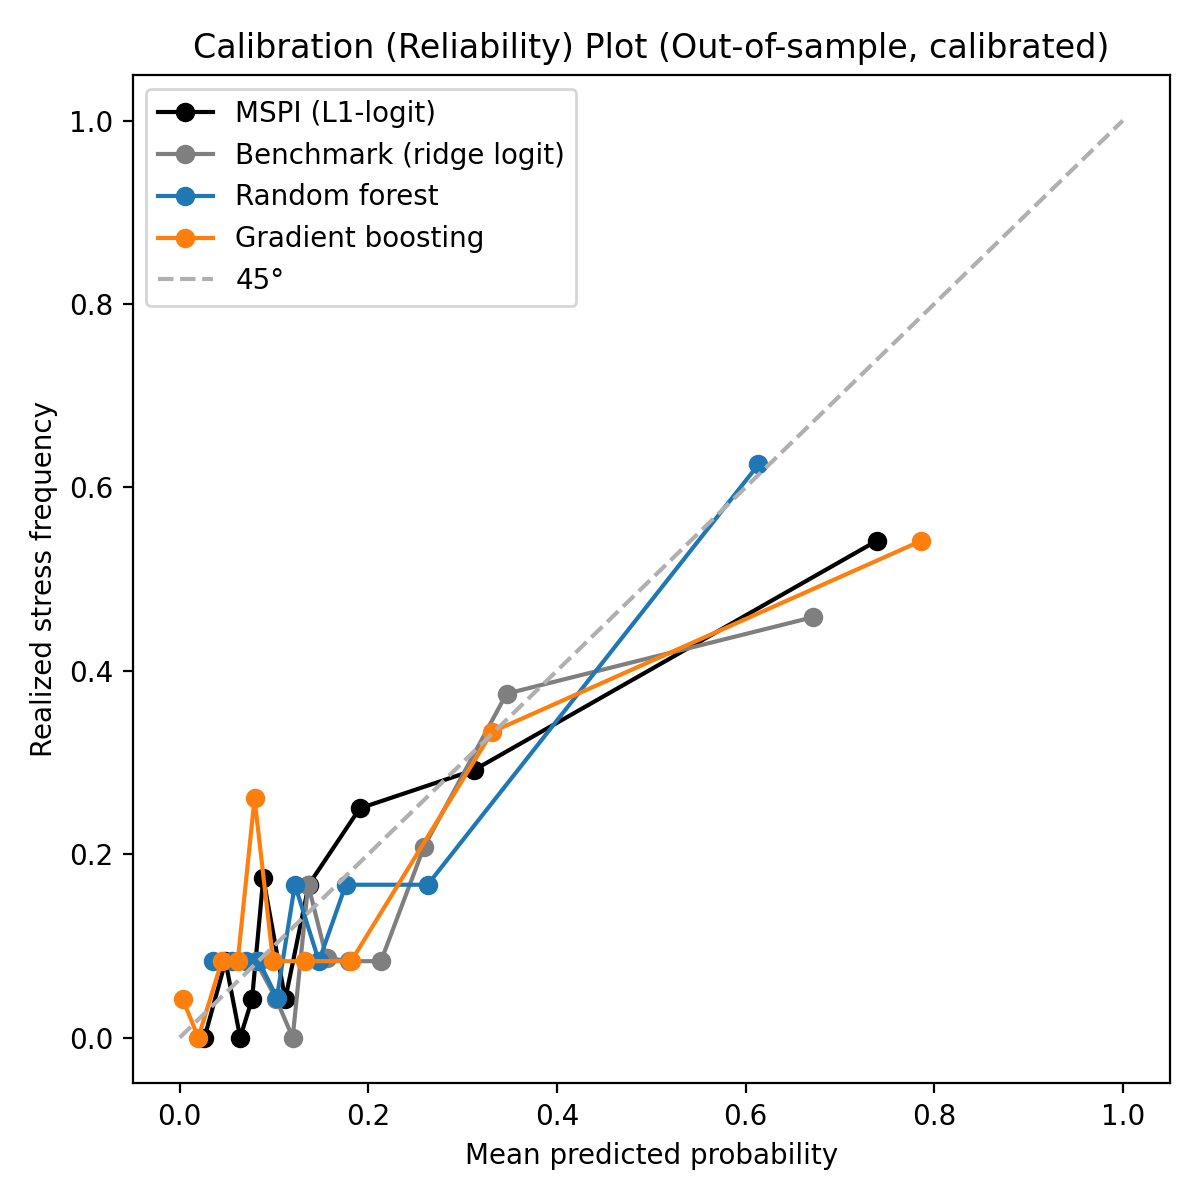
The predictive performance of the MSPI is quantitatively assessed through several established metrics to ensure a comprehensive evaluation of its accuracy and reliability. Brier Score measures the mean squared probability error, with lower values indicating better probabilistic predictions. Log Loss, also known as cross-entropy loss, quantifies the performance of a classification model where the predicted output is a probability value between 0 and 1; minimization of this value demonstrates improved model calibration. Expected Calibration Error (ECE) specifically assesses the difference between predicted confidence and actual accuracy across all confidence levels, providing insight into the trustworthiness of the MSPI’s probability forecasts; a lower ECE signifies better calibration and more reliable probability estimates.
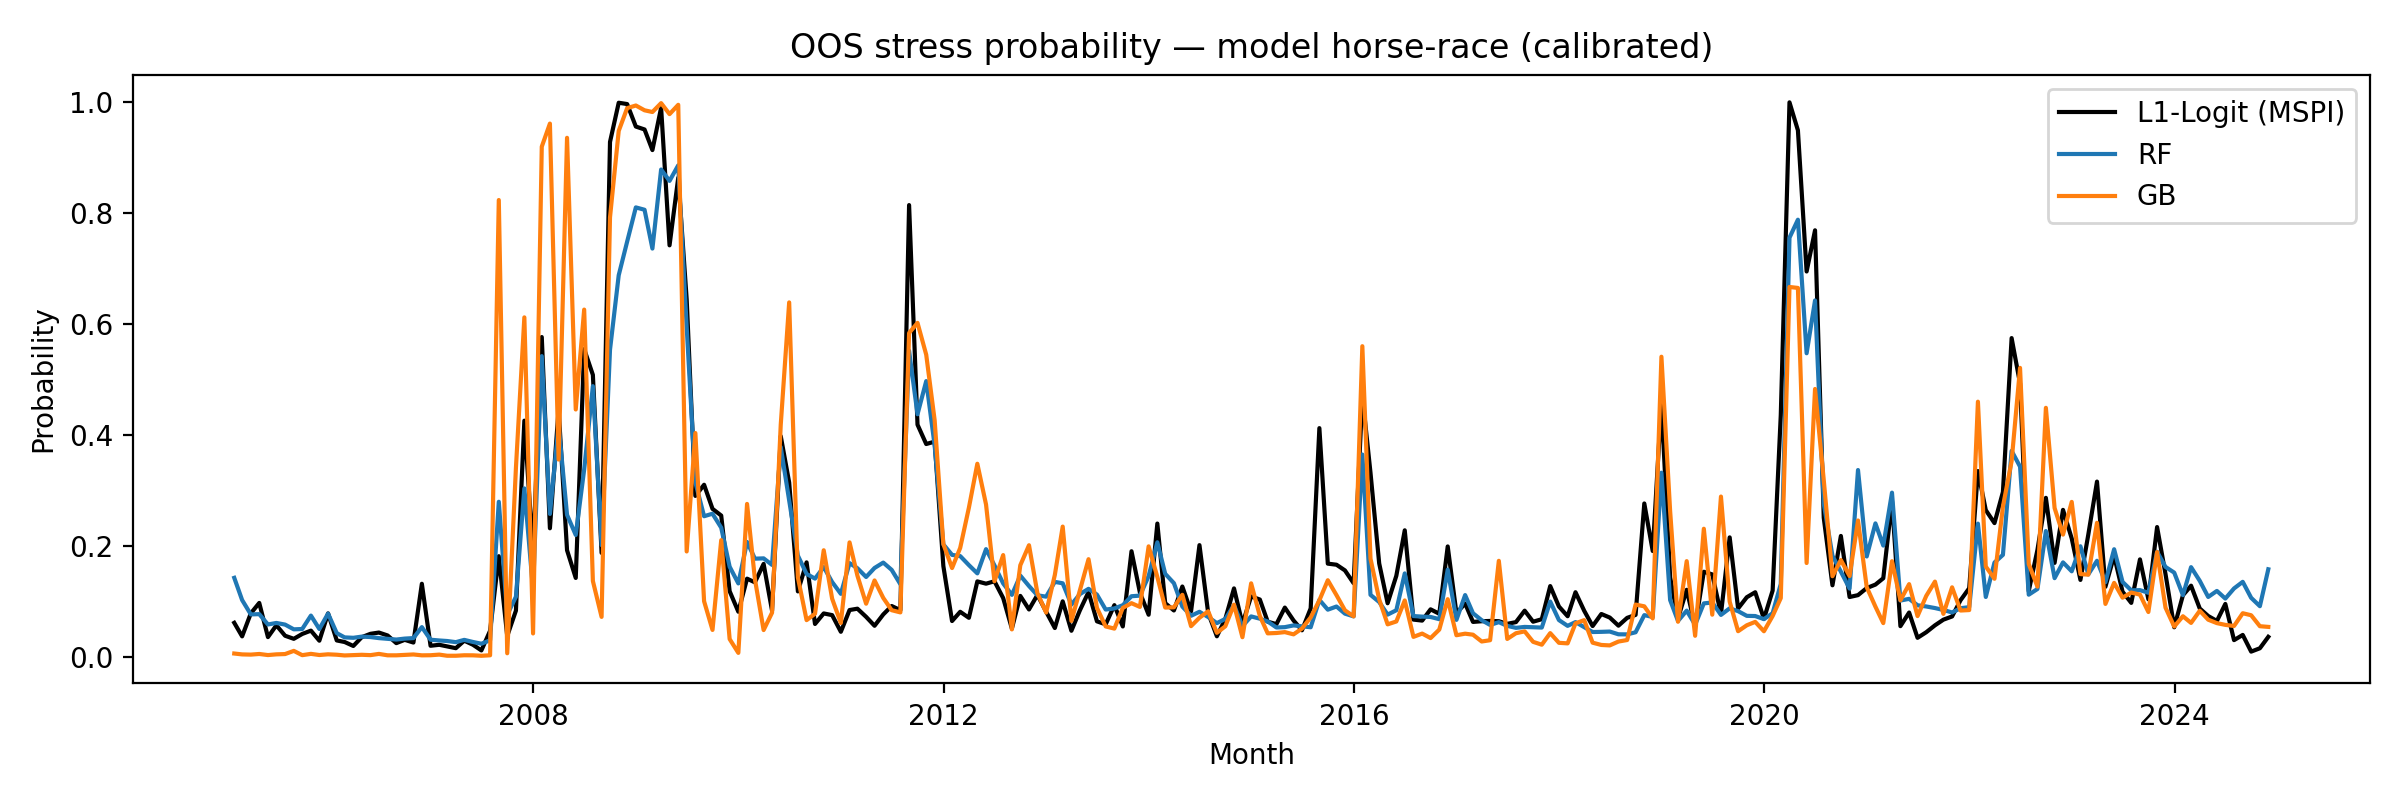
Evaluation of the MSPI against established machine learning models, specifically Random Forest and Gradient Boosting, indicates superior performance. The MSPI achieved an Area Under the Curve (AUC) of 0.800, representing a statistically significant improvement over the benchmark AUC of 0.752. This metric quantifies the model’s ability to discriminate between positive and negative instances, with a higher AUC indicating better performance. The observed difference demonstrates the MSPI’s enhanced predictive capability relative to the comparative algorithms in this evaluation.
Evaluation of the MSPI using standard probabilistic forecasting metrics demonstrates superior performance relative to benchmark models. The MSPI achieved a Brier Score of 0.106 and a Log Loss of 0.352, representing the lowest values among all models tested. Further analysis using Expected Calibration Error (ECE) revealed a value of 0.062 for the MSPI, which is an improvement over the benchmark ECE of 0.080; lower values for all three metrics indicate better-calibrated probabilistic predictions.
Post-hoc probability calibration techniques, such as Platt Scaling, can be implemented on the MSPI to improve the alignment between predicted probabilities and observed frequencies. Platt Scaling involves training a logistic regression model to map the MSPI’s output scores to calibrated probabilities; this process corrects for systematic miscalibration that may arise from the initial model training. Applying Platt Scaling does not alter the ranking of predictions but adjusts the predicted probabilities to more accurately reflect the true likelihood of events, thereby increasing the trustworthiness and reliability of the MSPI’s probabilistic forecasts for downstream applications and decision-making processes.
Beyond Prediction: Towards Proactive Systemic Risk Management
The Market Stress Propagation Index (MSPI) moves beyond traditional risk metrics by acknowledging that systemic vulnerability isn’t solely defined by isolated events, but rather by the way stress diffuses through financial networks. It quantifies how localized shocks – increases in volatility or emerging downside risk in one area – can propagate and amplify across seemingly disparate markets. This is achieved through a dynamic assessment of interconnectedness, identifying channels of influence and assessing the potential for contagion. Consequently, the MSPI doesn’t simply flag risk; it reveals the underlying architecture of systemic fragility, offering a more sophisticated understanding of how a problem in one sector can rapidly escalate into a broader financial crisis, and highlighting the importance of monitoring not just what is happening, but how markets are responding to it.
The Market Stress Probability Index (MSPI) offers a pathway towards anticipating, rather than merely reacting to, financial instability. By continuously monitoring market dynamics and quantifying the likelihood of stress events as they unfold, the MSPI equips investors with the foresight to adjust portfolios preemptively, potentially reducing exposure to downside risk. Simultaneously, regulators can leverage the MSPI’s real-time assessments to refine supervisory practices and implement targeted interventions before systemic vulnerabilities escalate into full-blown crises. This proactive capability represents a significant shift from traditional, lagging indicators, fostering a more resilient financial ecosystem and allowing for a more dynamic and informed approach to risk management across the board.
Ongoing investigations aim to elevate the Market Stress Prediction Index (MSPI) beyond a standalone metric by merging its predictive capabilities with established financial risk indicators, such as credit spreads and macroeconomic data. This synergistic approach promises a more holistic and robust assessment of systemic vulnerability. Researchers are particularly focused on developing early warning systems that leverage the MSPI’s real-time stress event identification to forecast potential market shocks with greater accuracy and lead time. Such systems could enable proactive interventions by both investors – allowing for portfolio adjustments – and regulatory bodies, potentially mitigating the severity of future financial crises and fostering greater market stability. The ultimate goal is to transition from reactive crisis management to a paradigm of proactive risk mitigation, powered by sophisticated predictive analytics.
The pursuit of a quantifiable metric like the Market Stress Probability Index (MSPI) embodies a constant calibration against reality. It’s not about predicting the future, but about establishing a framework where error illuminates the path towards a more accurate model. As Jean-Paul Sartre observed, “Existence precedes essence.” Similarly, the MSPI doesn’t define market stress; it reveals it through observation of cross-sectional fragility. Each failed prediction isn’t a failure of the index itself, but a message – a data point refining the understanding of systemic risk. The index’s transparency, allowing for reproducibility, acknowledges that truth isn’t a fixed point, but an asymptotic approach achieved through repeated testing and refinement.
What’s Next?
The presented Market Stress Probability Index (MSPI) offers a demonstrable, if provisional, answer to the question of real-time stress quantification. However, the very act of assigning probability raises more questions than it resolves. Any predictive model, regardless of its algorithmic sophistication, remains a snapshot of past relationships extrapolated onto an unknowable future. The true test lies not in successful forecasts, but in meticulously documenting each failure – identifying where the cross-sectional fragility signals degrade, and why the L1-regularized logistic regression, a pragmatic choice, ultimately proves insufficient.
Future iterations should confront the inherent limitations of an equity-only approach. Stress, after all, manifests across asset classes, and a comprehensive assessment demands integration with fixed income, commodities, and perhaps even less conventional data. More importantly, the focus must shift from simply predicting if stress will occur, to understanding how it propagates. Agent-based modeling, capable of simulating complex interactions, may offer a more nuanced, though inevitably less precise, pathway toward anticipating systemic vulnerabilities.
Ultimately, the pursuit of a perfect stress indicator is a fool’s errand. The market is not a system to be conquered, but a complex adaptive system to be cautiously observed. The value of the MSPI, and its successors, resides not in its predictive power, but in its ability to force a rigorous, transparent, and perpetually self-correcting approach to risk assessment. The goal isn’t certainty, merely a slightly more informed acknowledgment of uncertainty.
Original article: https://arxiv.org/pdf/2602.07066.pdf
Contact the author: https://www.linkedin.com/in/avetisyan/
See also:
- Off Campus Season 1 Soundtrack Guide
- Chainsaw Man Volume 24’s Cover Art Reveals a Brand-New Denji
- X-Men ’97 Finally Gave Gambit the Hero Moment He Deserved
- 46 Years Later, The Mandalorian & Grogu Answers A Major Empire Strikes Back Question
- HoI4 fans harsh reactions to the announcement of another DLC pack
- 10 Worst End-Game Couples In Sitcom History
- Emily Henry Says to ‘Trust the Vision’ For Beach Read Adaptation
- DoorDash responds after customer uses AI to make food look bad and get a refund
- Hatsune Miku cosplayer goes viral selling $15 cups of “foot juice” to thirsty anime fans
- Gold Rate Forecast
2026-02-10 10:06