Ah, XRP, the financial world’s eternal shrug emoji. 😐 Today, it trades at $2.18, a price as steady as a Tolstoy novel’s pacing, with a market cap of $131 billion and $3.72 billion in 24-hour volume. The intraday price band between $2.16 and $2.25 is like a ballroom dance-enough movement to keep spectators mildly entertained, but no grand jeté to signal a clear direction.
XRP Chart Outlook
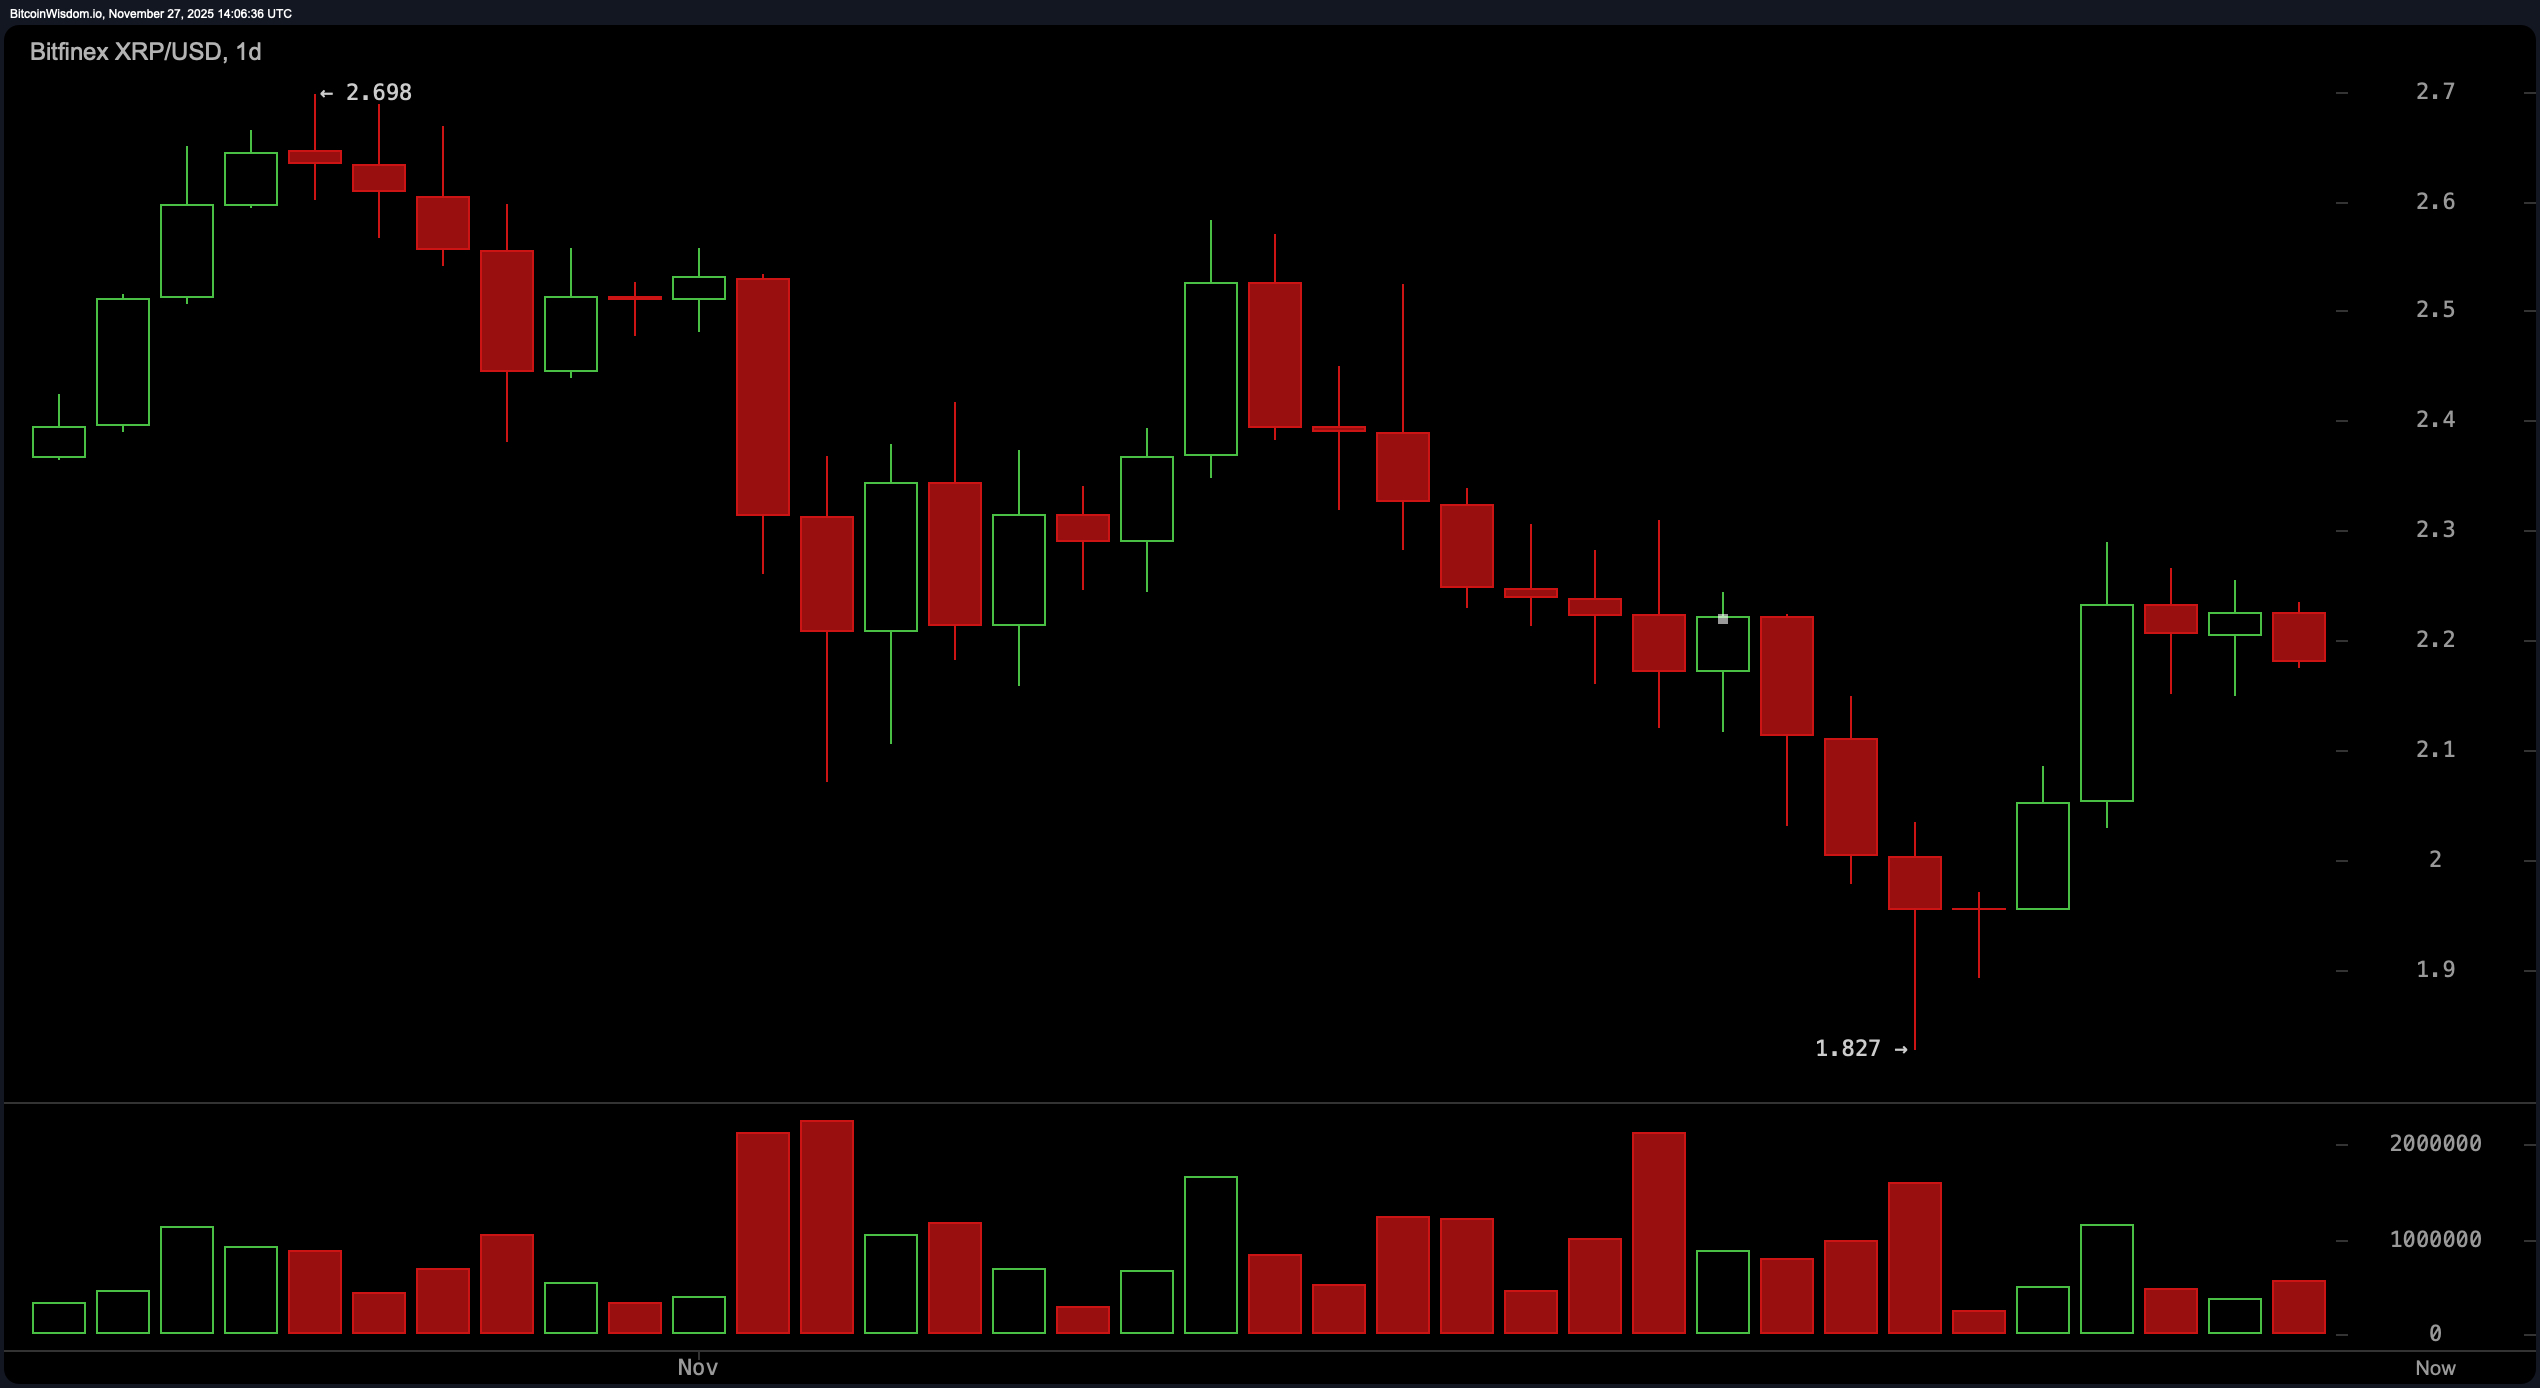
On this fine November day in 2025, XRP’s chart resembles a man trying to decide whether to leave a party or stay for one more drink. 🍷 The broader structure reflects a market attempting to shake off a corrective downswing while grappling with resistance zones as stubborn as a Tolstoy protagonist. The daily chart, with its lower highs from the $2.70 region and capitulation low at $1.827, tells a tale of hesitation. Yet, a recovery into the $2.20-$2.25 pocket suggests traders aren’t ready to call it a night just yet.
A stall in this area-once a cozy support, now a firm ceiling-keeps momentum shoppers on edge. Volume spikes near the lows hint at interest, but follow-through is as muted as a whispered confession. Support between $1.83 and $1.90 remains the fortress, while resistance at $2.25 and $2.40 looms like a judgmental in-law. 🧐
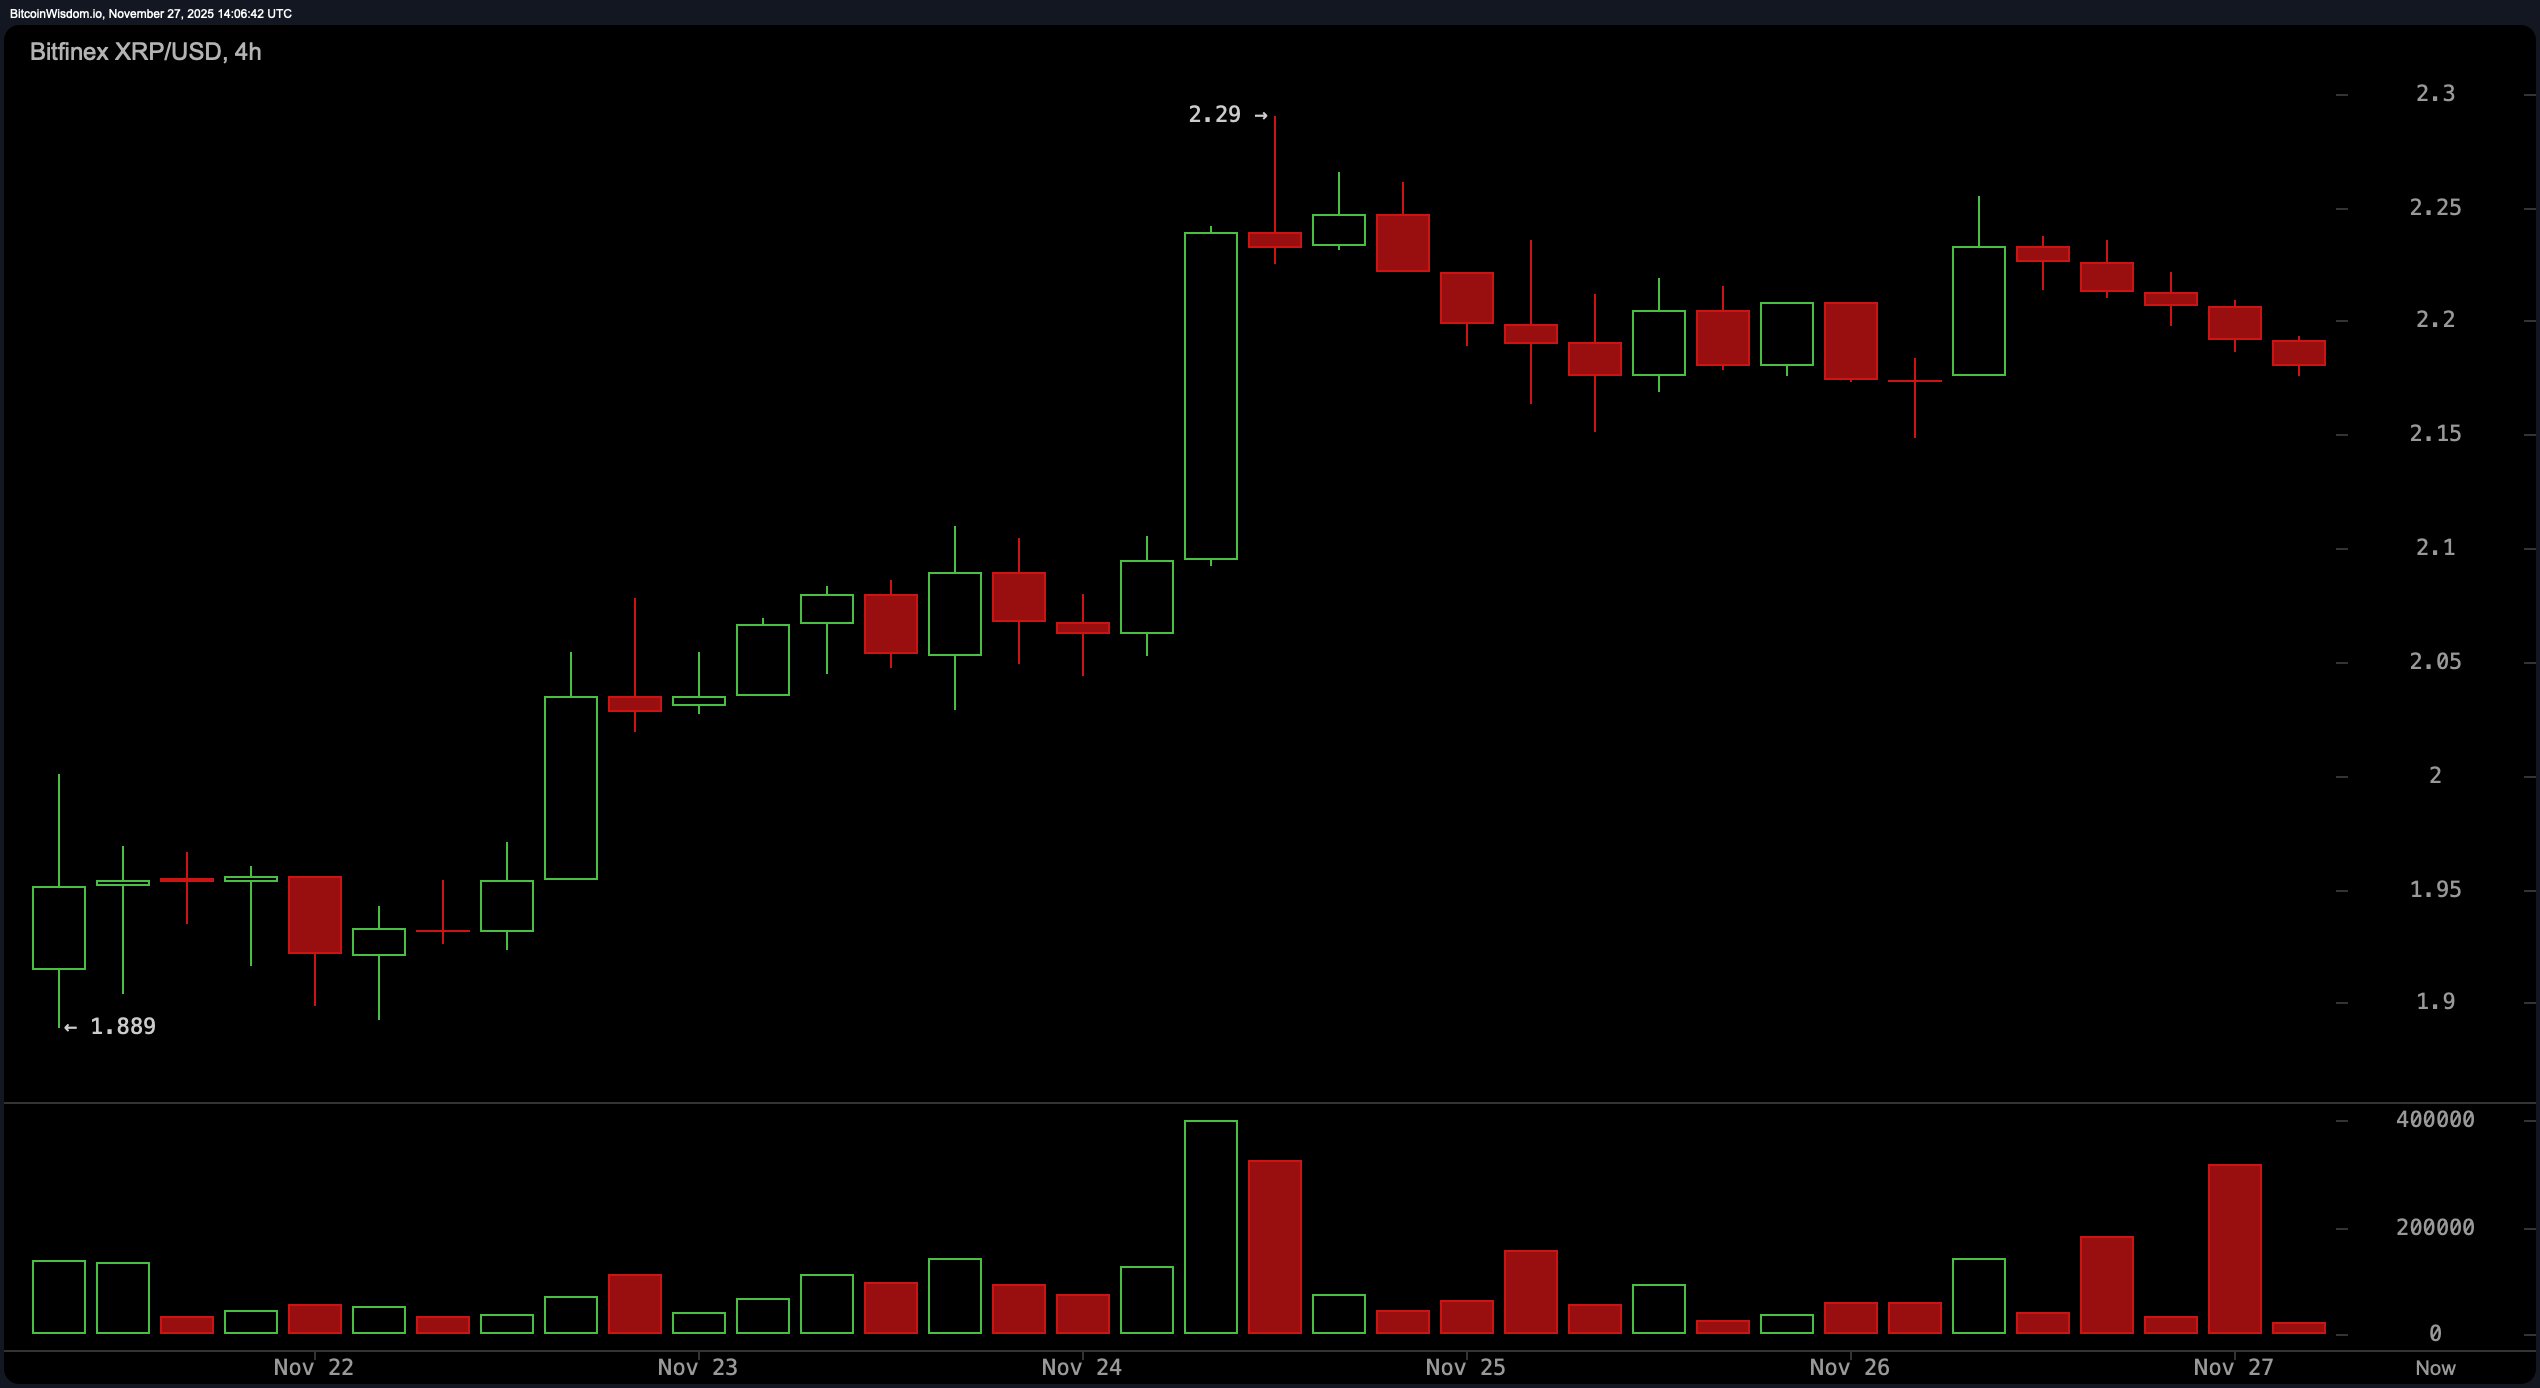
On the four-hour chart, XRP’s behavior shifts from heavy to cautiously optimistic-like a guest who decides to stay for dessert. 🍰 A mini-uptrend rises from the $1.889 low, followed by a push to $2.29 and a slow, steady fade. The decline is orderly, as if traders are quietly slipping out to avoid the post-party cleanup. Price lingers just under $2.20, and reclaiming $2.21-$2.25 is essential before anyone declares this a success. Support between $2.12 and $2.15 remains active, while resistance clamps down from $2.21 upward. A flip of that level could reignite the party.
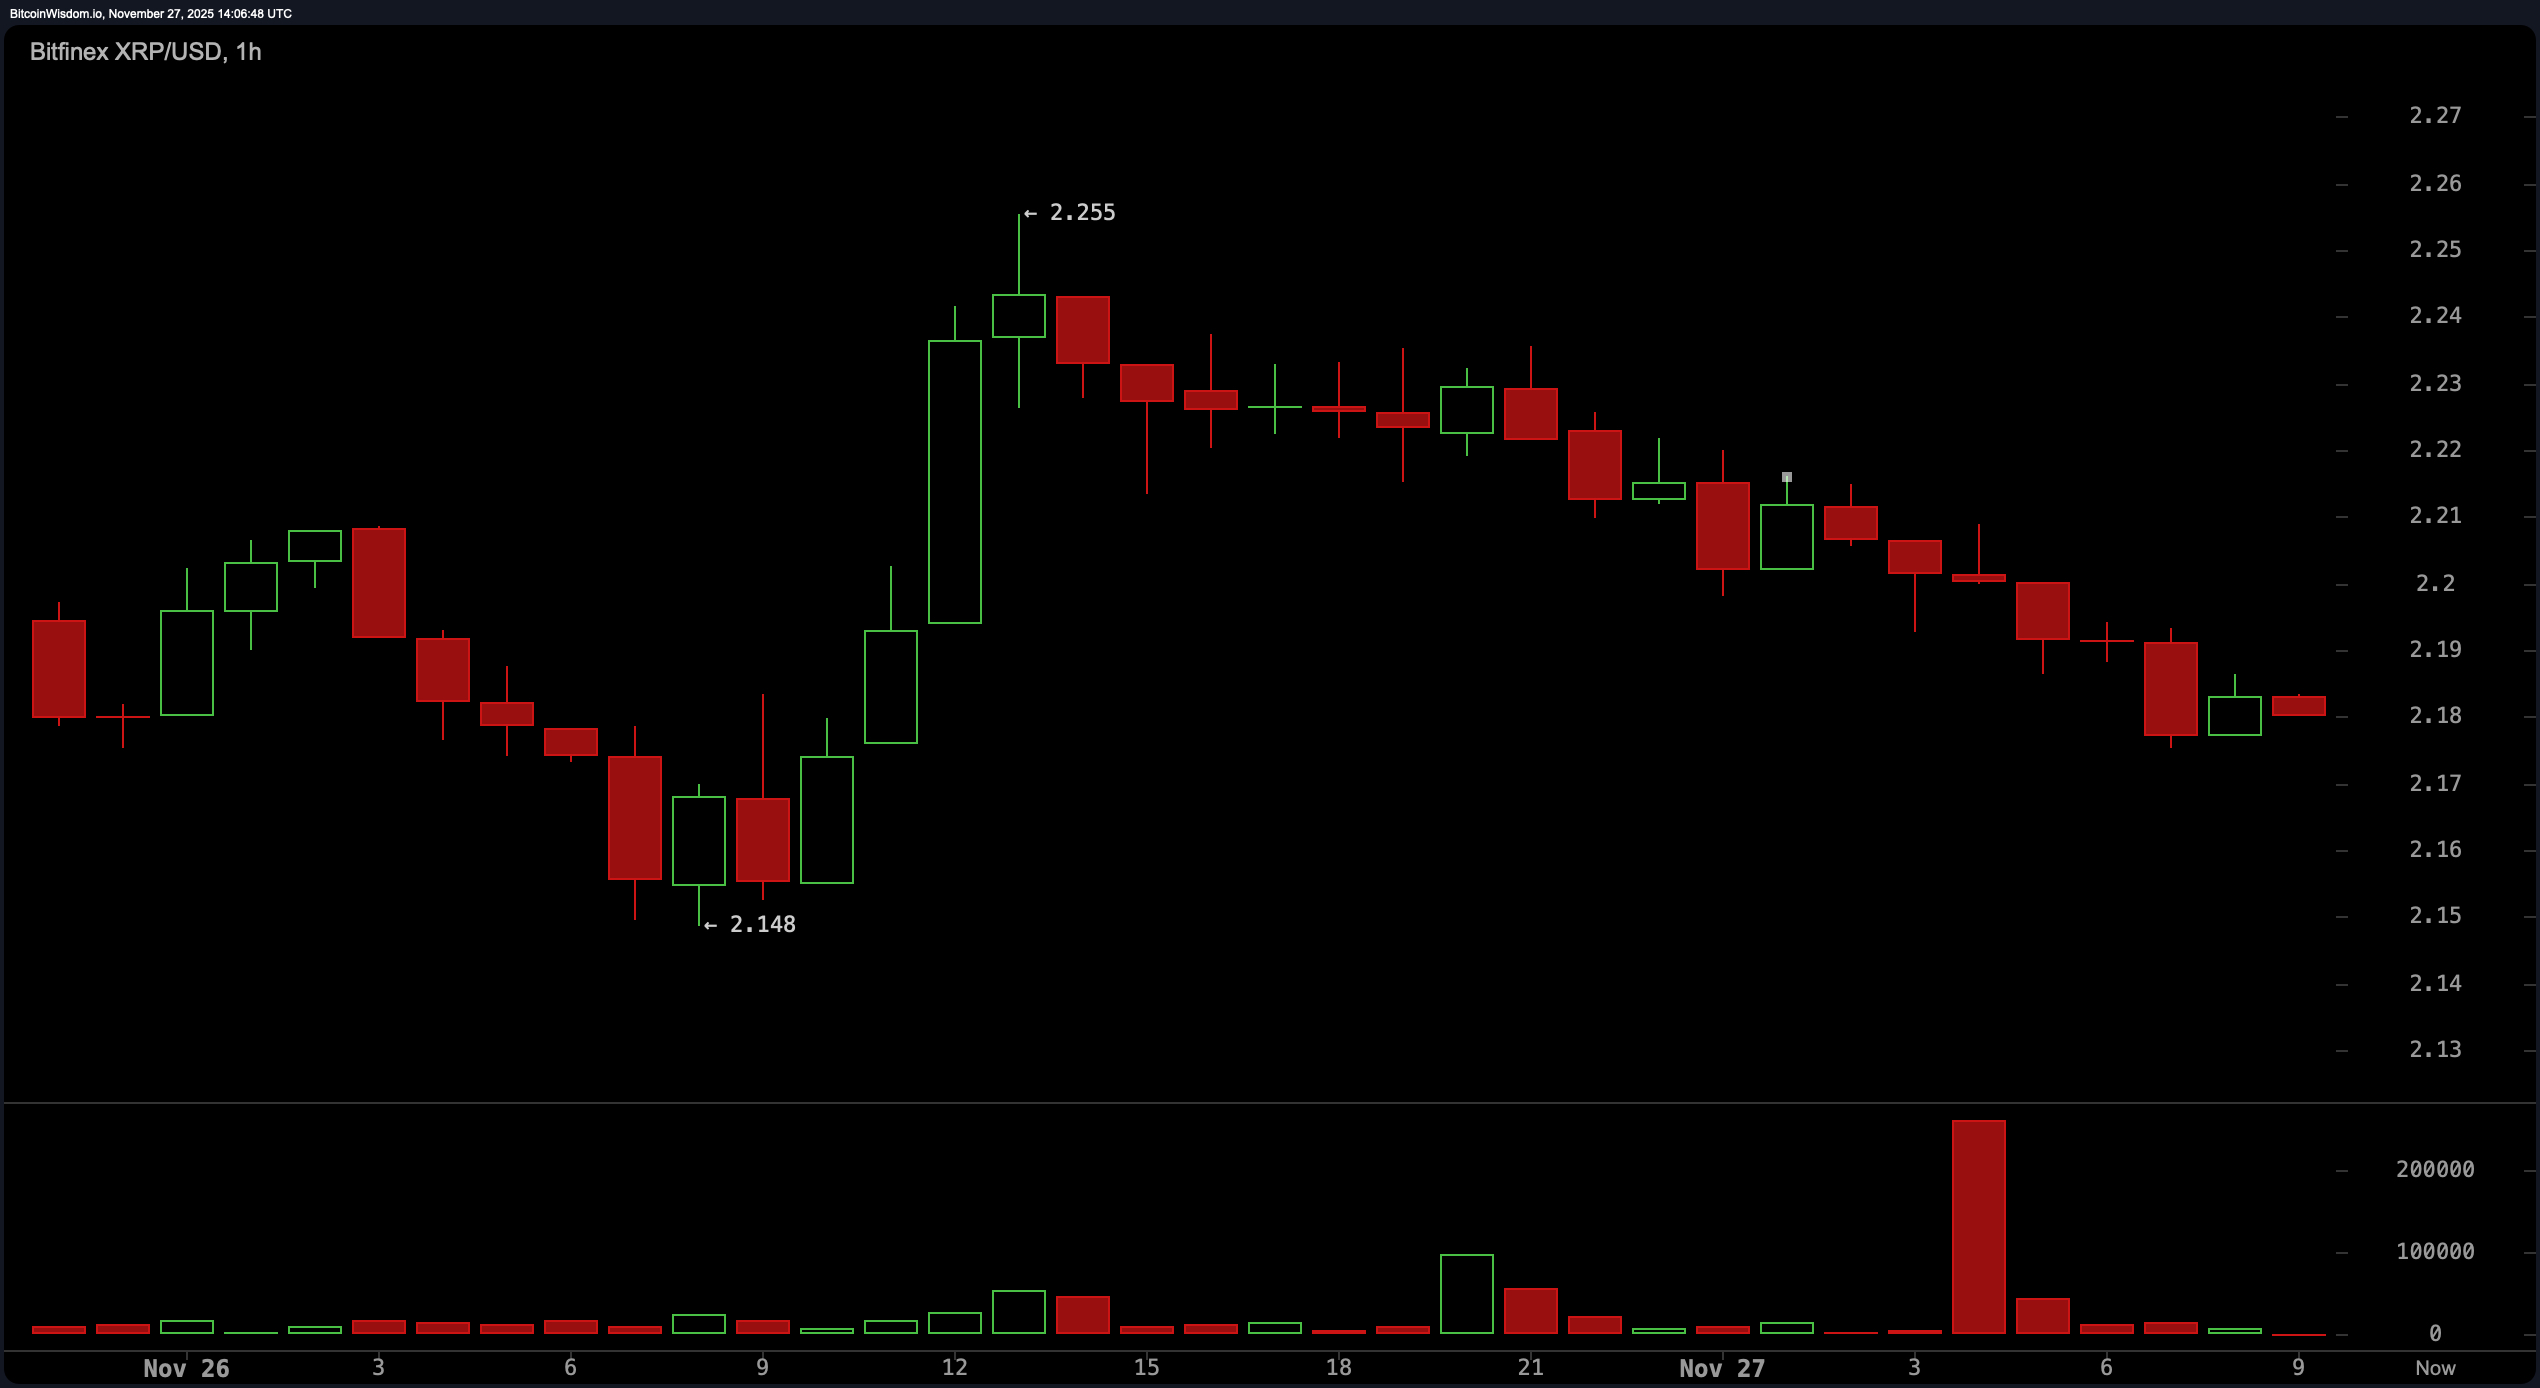
The one-hour chart is sharper, like a witty remark at a dinner party. 🍽️ A rally into $2.255 is followed by a classic grind downward, signaling distribution rather than exhaustion. Price tries to settle around $2.18, but the sequence of lower highs remains unbroken, giving the short-term structure a heavier tone. Resistance at $2.21 and support at $2.16-$2.18 create a setup fit for brief tactical plays, not grand pronouncements. A reclaim of $2.21 would break the stalemate, while failure at that level could send prices tumbling like a poorly constructed argument.
Oscillators add another layer of mixed signals, leaning toward neutrality like a diplomat at a contentious dinner. 🥄 The RSI at 46.28 sits squarely in the middle, the Stochastic at 60.16 keeps the meter balanced, and the CCI at −10.01 remains muted. The ADX at 25.96 signals trend strength that’s present but far from dominant. Tools like the Awesome Oscillator at −0.158 and Momentum at 0.017 whisper rather than shout, while the MACD at −0.07482 tilts gently bullish. It’s a cocktail of signals that invites patience over theatrics.
The moving averages tilt the longer-term narrative downward, like a character arc in War and Peace. While the EMA 10 at 2.15856 and SMA 10 at 2.10966 reflect short-term strength, everything from the EMA 20 through the SMA 200 leans in the opposite direction. The EMA 200 at 2.52062 and SMA 200 at 2.62451 show just how much ground XRP would need to regain before the long-term structure shifts meaningfully. It’s a blend of near-term resilience and broader-trend skepticism that encapsulates XRP’s current state.
Bull Verdict:
XRP is attempting to carve out stability above the $2.16-$2.18 zone, much like a character finding their footing in a Tolstoy novel. The short-term moving averages offer support, giving bulls a workable foothold. A decisive reclaim of $2.21-$2.25 would flip multiple time frames, unlock momentum from the MACD and momentum indicators, and open the door toward retesting $2.29-$2.40 with conviction. 🌟
Bear Verdict:
With lower highs still intact on the one-hour chart and nearly all major moving averages pointing downward, XRP remains vulnerable if it fails to regain $2.21. A slip back through the $2.16-$2.18 support shelf exposes the $1.90 area, where the broader downtrend could reassert itself before bulls regroup. 🐻
FAQ ❓
• What is XRP’s current price today? XRP trades at $2.18 with a $131 billion market cap and $3.72 billion in 24-hour volume.
• What key levels matter most for XRP right now? The crucial range is $2.16-$2.25, a corridor as significant as a plot twist in Crime and Punishment.
• Are XRP’s technical indicators showing strength or weakness? Oscillators remain mostly neutral, while longer-term moving averages lean bearish, like a skeptic at a party.
• What would improve XRP’s short-term outlook? Reclaiming the $2.21-$2.25 zone would strengthen momentum, much like a well-timed revelation in a novel. 📈
Read More
- United Airlines can now kick passengers off flights and ban them for not using headphones
- Crimson Desert: Disconnected Truth Puzzle Guide
- All 9 Coalition Heroes In Invincible Season 4 & Their Powers
- Mewgenics vinyl limited editions now available to pre-order
- Grey’s Anatomy Season 23 Confirmed for 2026-2027 Broadcast Season
- Viral Letterboxd keychain lets cinephiles show off their favorite movies on the go
- Does Mark survive Invincible vs Conquest 2? Comics reveal fate after S4E5
- All Golden Ball Locations in Yakuza Kiwami 3 & Dark Ties
- How to Get to the Undercoast in Esoteric Ebb
- The Boys Season 5 Spoilers: Every Major Character Death If the Show Follows the Comics
2025-11-27 18:54