As Bitcoin reaches heights that would make any digital asset enthusiast faint, the race to predict its future value intensifies. Charting tools like the infamous Rainbow chart and the ever-so-popular Stock-to-Flow (S2F) model have risen to the occasion. A clever attempt to forecast Bitcoin’s price trajectory — let’s see how well these models hold up under scrutiny.
Bitcoin Models Predict Explosive Growth — But Who Are We Kidding, Will Reality Actually Follow Suit?
As of May 9, Bitcoin (BTC) is trading at a cool $103,046, and some optimistic souls are convinced we’ll see new all-time highs before the year is out. Market analysts are burning the midnight oil, scrutinizing charts like desperate teenagers searching for meaning in the latest social media trend. Enter the two forecasting giants: Rainbow and S2F. These two models have proven, in their own ways, to have more hits than misses… well, sometimes.
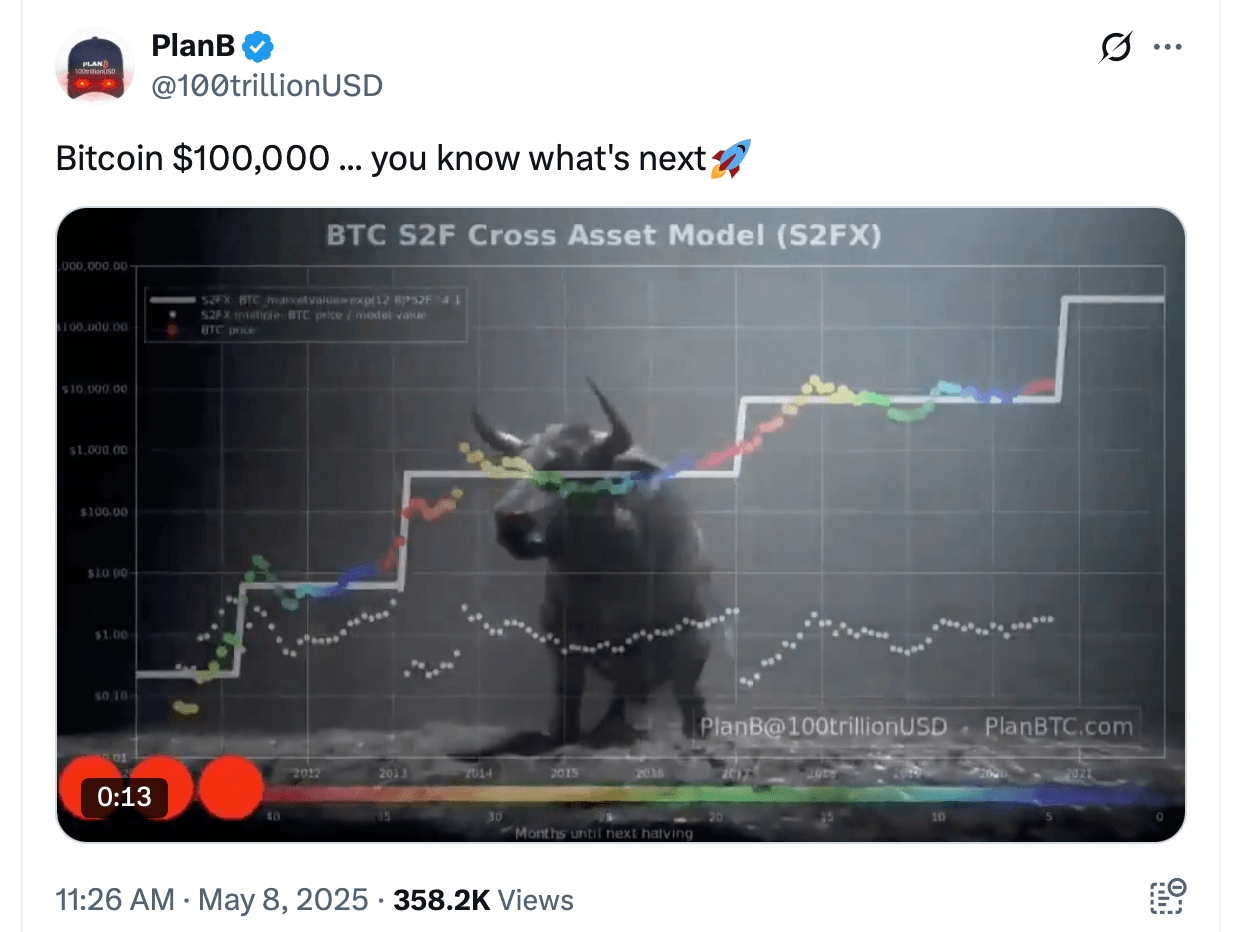
Stock-to-Flow (S2F)
The Stock-to-Flow (S2F) model is essentially a fancy way to talk about scarcity. It compares how many Bitcoin are out there (stock) to how many are being mined (flow). Every four years, Bitcoin’s supply halving further stokes the fires of scarcity, pushing the price into a seemingly inevitable upward spiral.
Currently, we’ve just passed the halving event that happened last year, so the price trajectory is decked out in lovely shades of red and orange. Historically, these post-halving phases have been the time for Bitcoin to flex and climb rapidly for the next 12-18 months. In fact, the proximity of Bitcoin’s current price to the S2F projection implies that the market is sticking to this model more than it ever has before. Or is it?
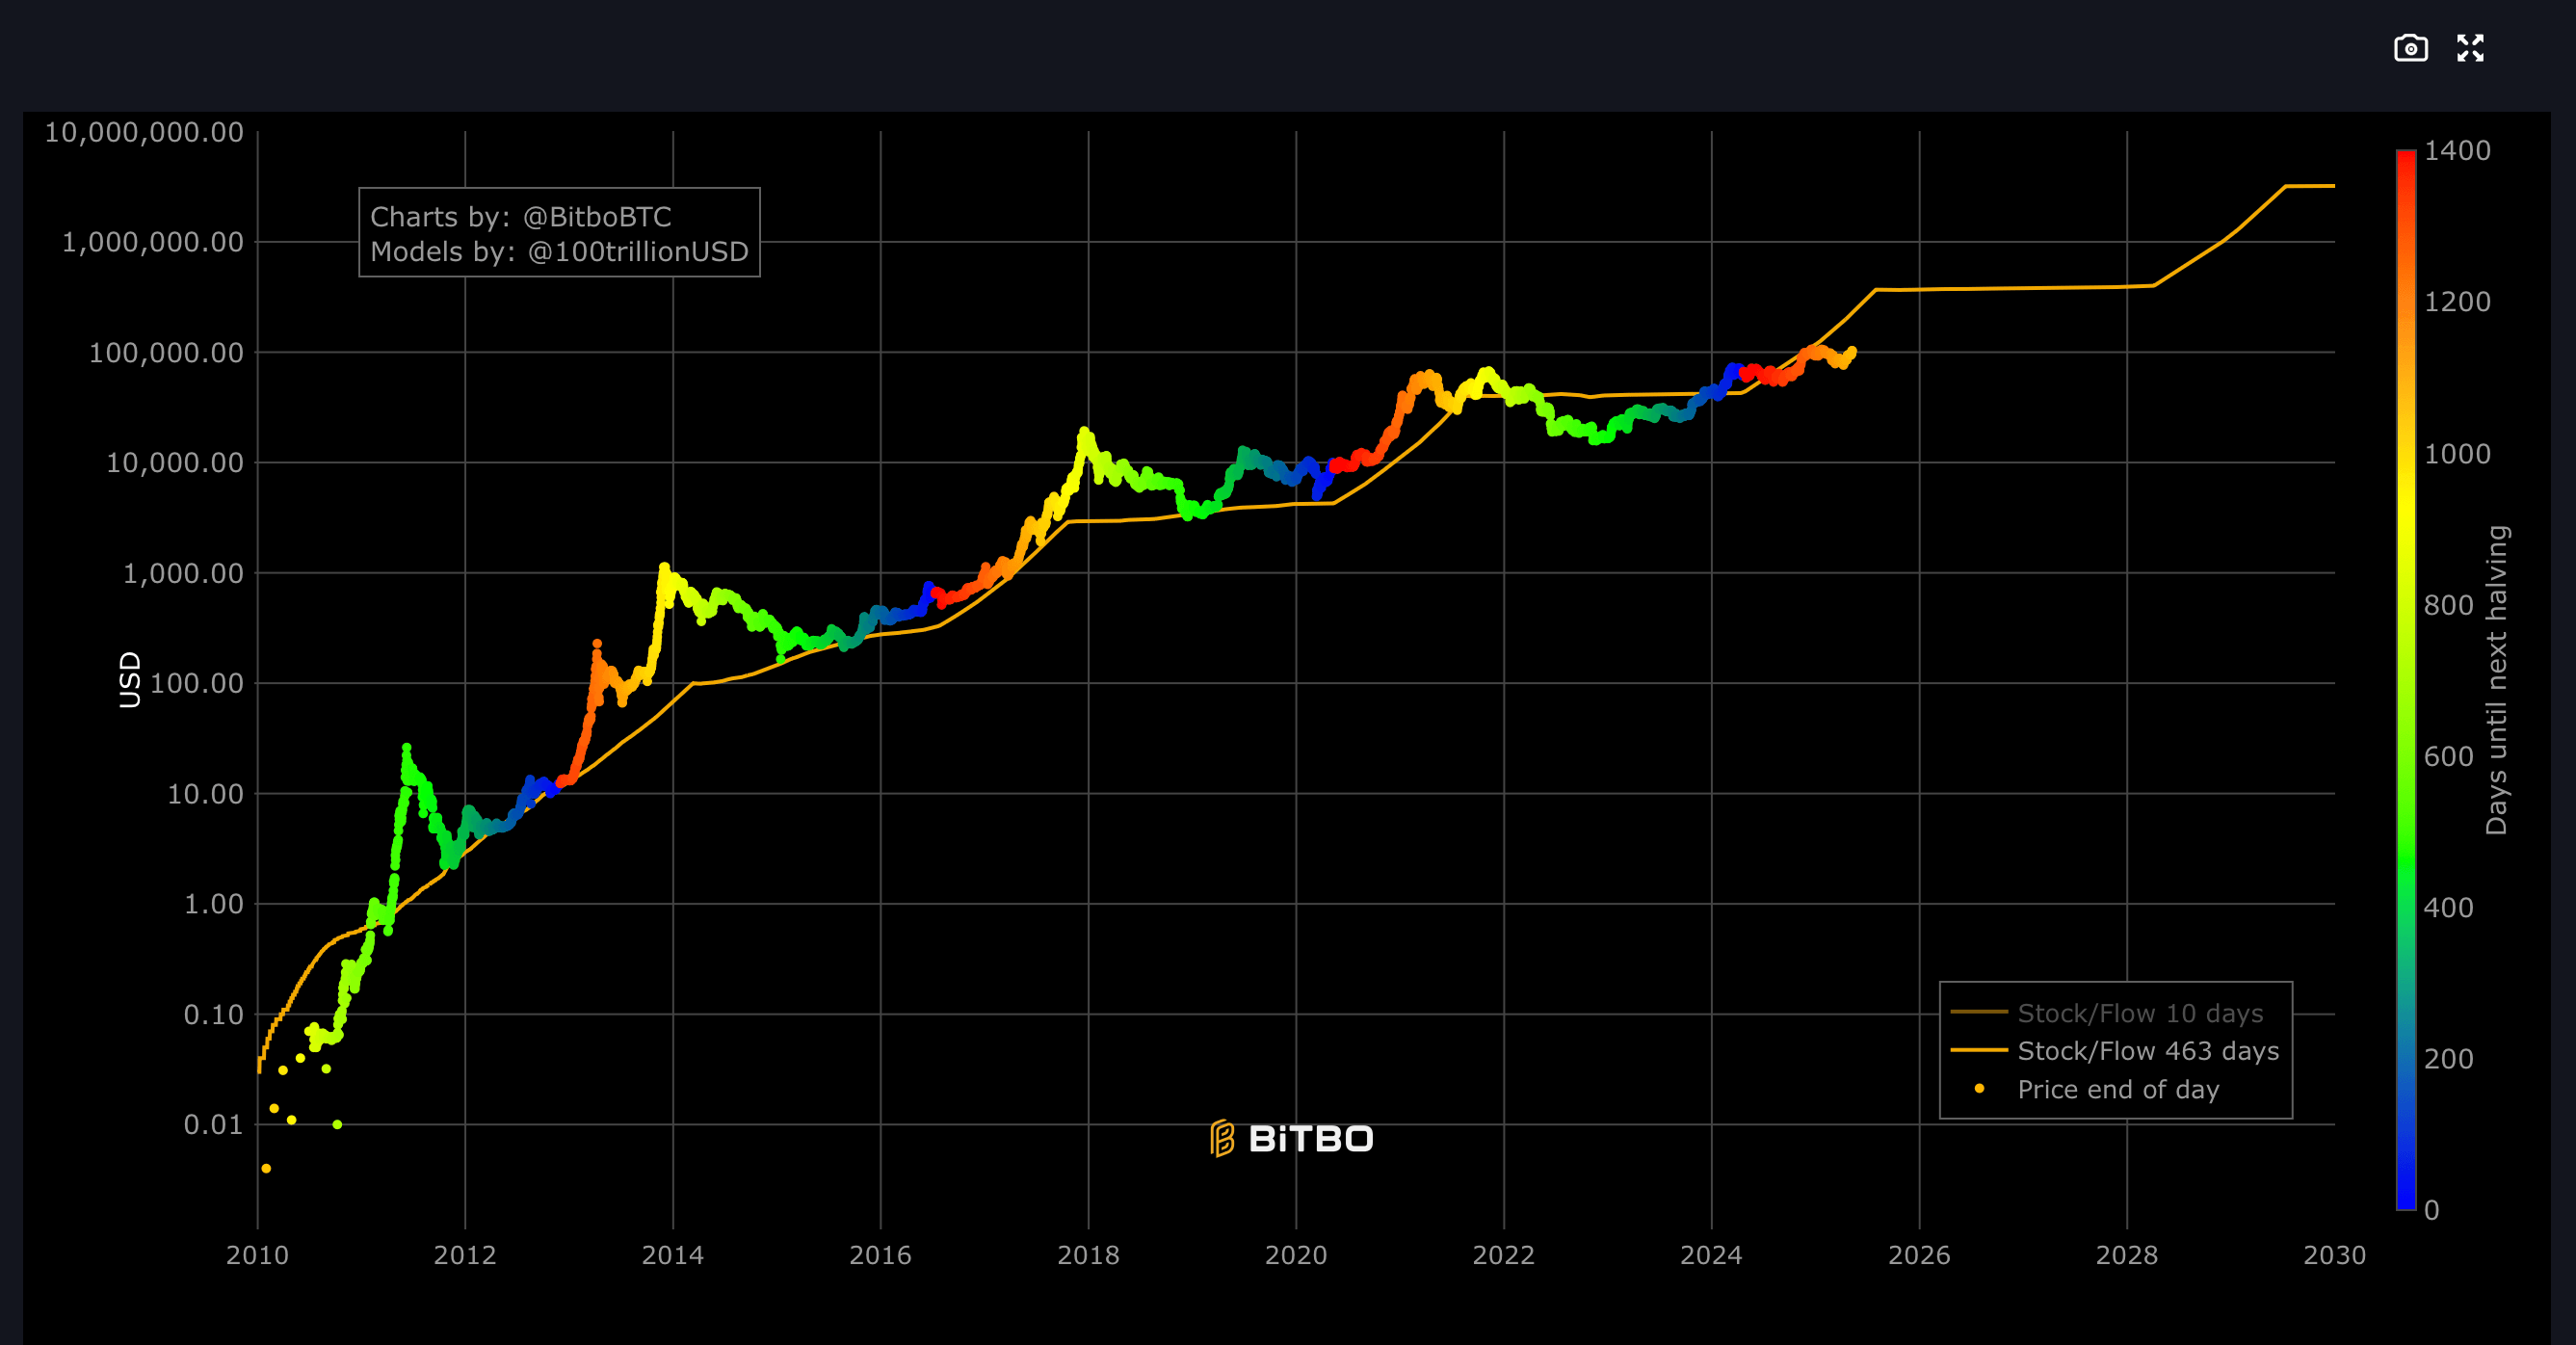
Should Bitcoin follow the S2F model’s predicted path, we could see it hitting around $275,000 by late 2026. That’s the scarcity effect in full force — fewer coins, higher prices. Think of it like a limited-edition luxury watch that only gets more valuable because it’s too rare for your average person to afford.
However, before you start putting all your hopes in S2F’s pretty graphs, remember that external forces like a global recession or, God forbid, another Twitter storm from some eccentric billionaire could totally derail this pristine trajectory. Models, after all, are just mathematical hypotheses, and even the mighty S2F has faced its fair share of criticism.
The Rainbow Chart
The Rainbow Chart is another crowd favorite. According to the chart, Bitcoin’s price will embark on a journey that starts with the “FOMO” band and will eventually spiral its way into the ominous “Is this a Bubble?” zone. Expect a move from just above $100,000 towards a potential range of $290,000–$365,000 by 2026, depending on which color band you ask. It’s like a mood ring for Bitcoin’s value, except the color changes depending on how much everyone is freaking out.
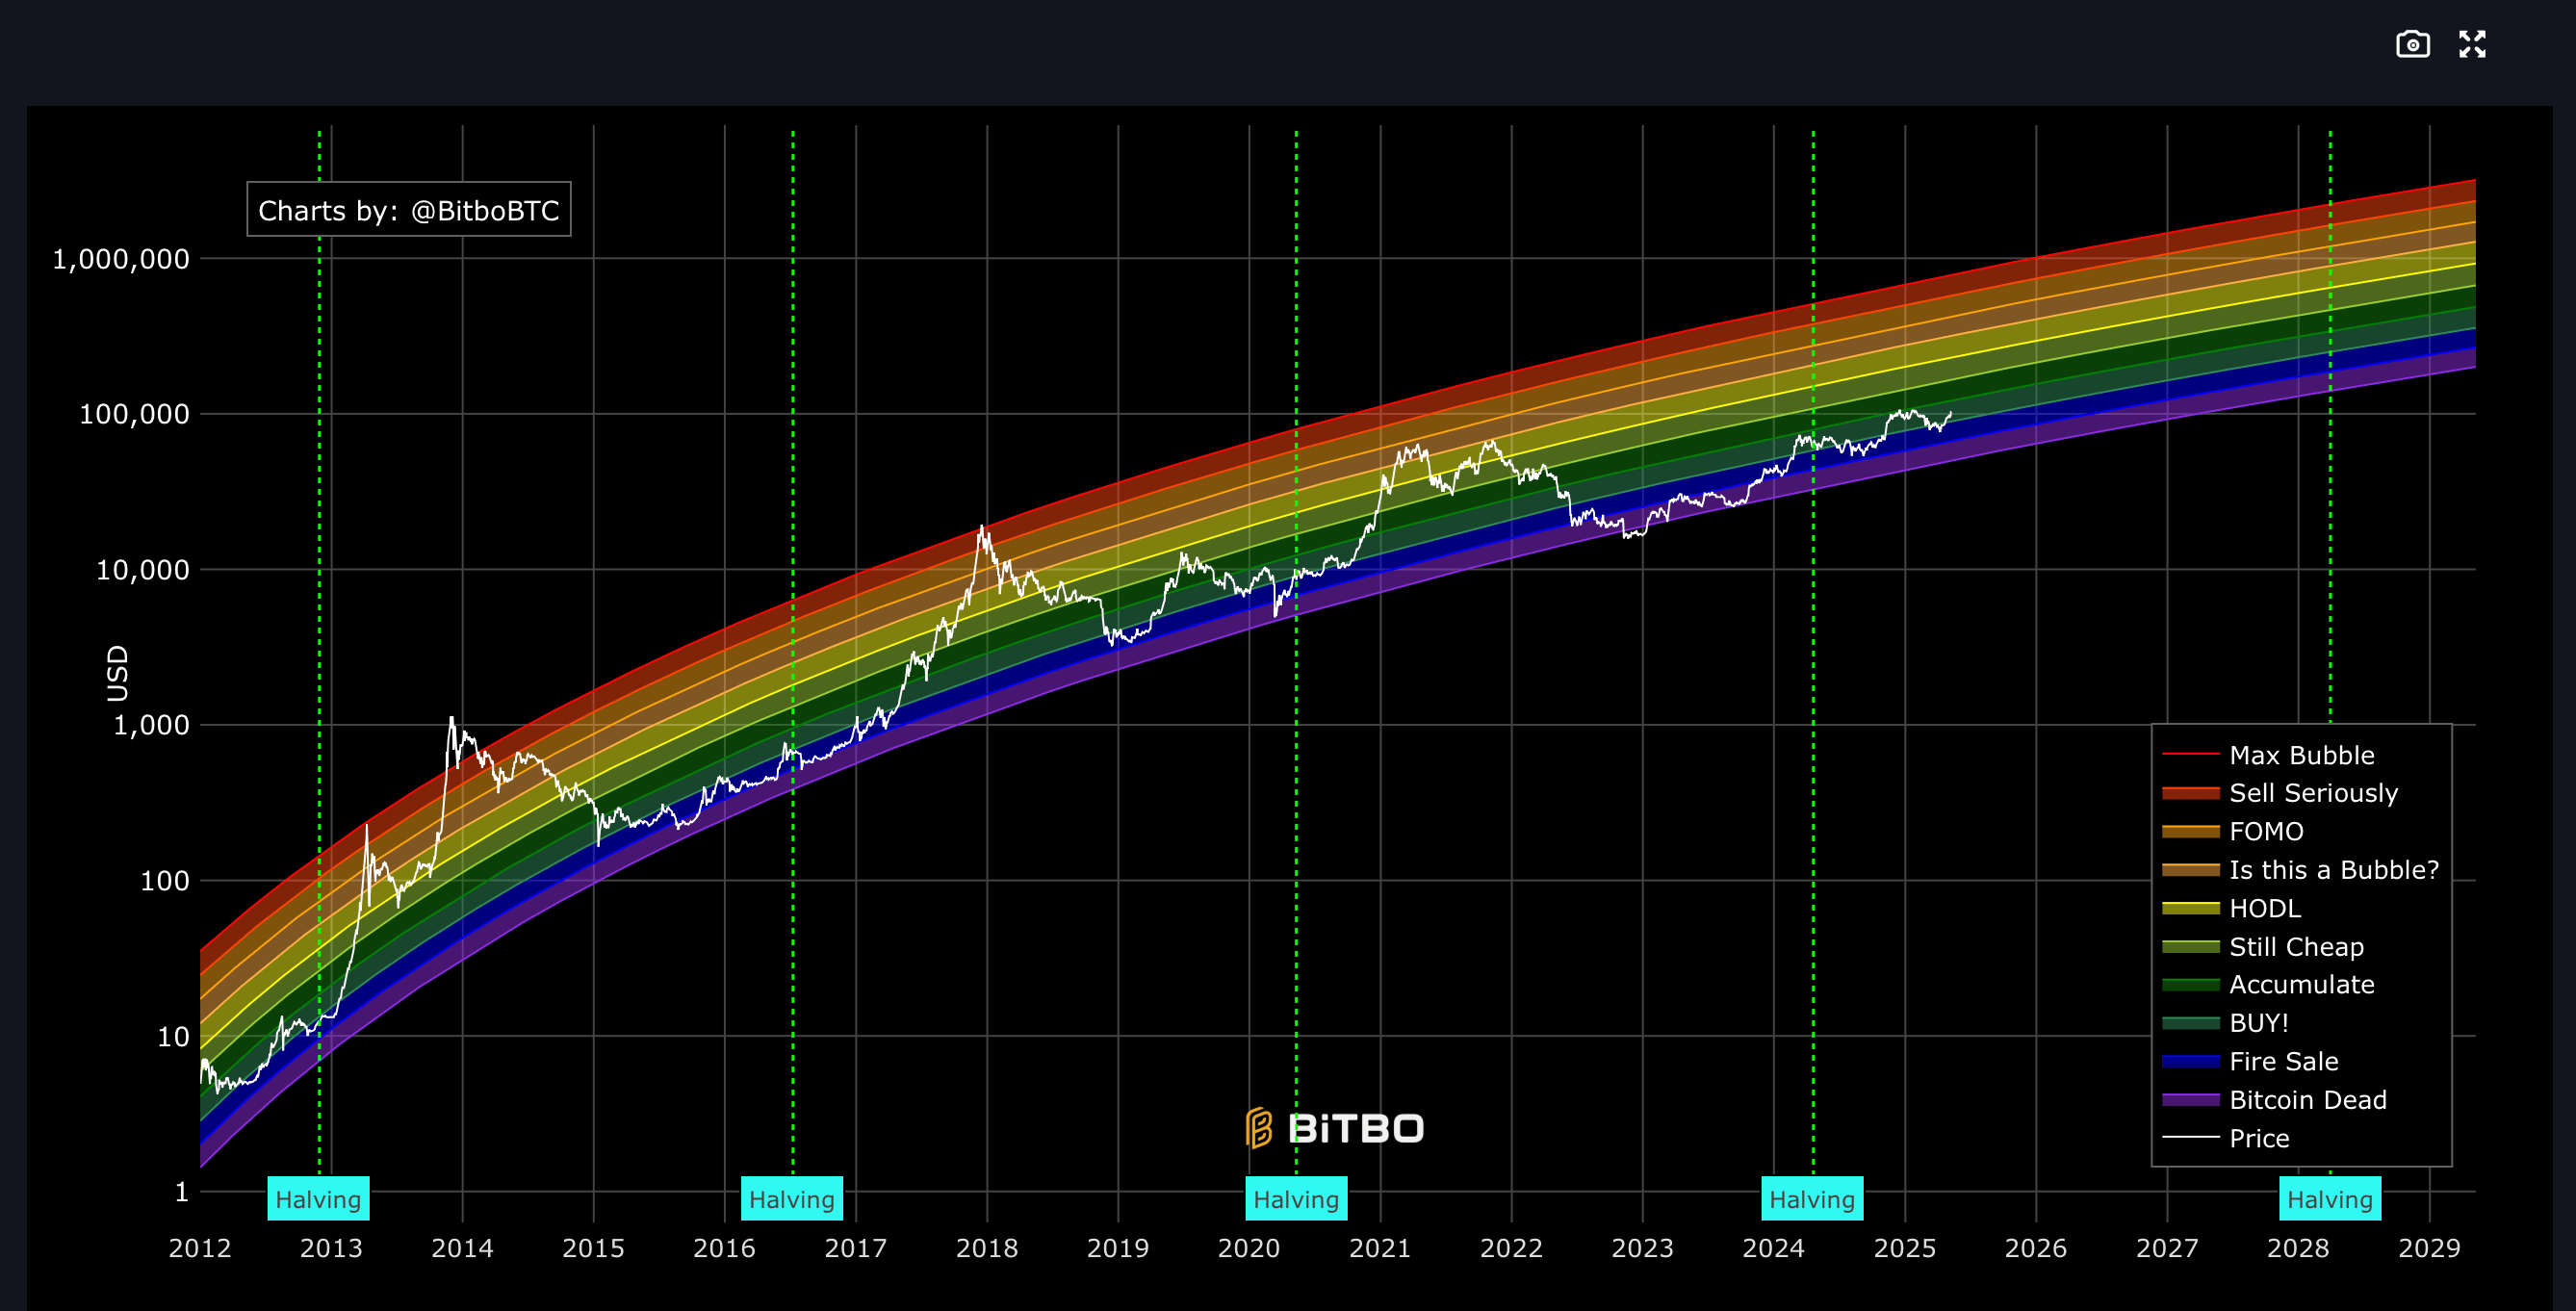
However, the Rainbow Chart hasn’t always been so cheery and reliable. Originally, it was crafted based on a mix of guesswork and a handful of data points, leading to some very optimistic and borderline delusional price projections. But as more data rolled in, the chart was refined with statistical finesse, moving away from the flashy extremes to become a slightly more grounded model. Think of it as a reformed party animal that now insists on attending early dinner reservations.
Still, not everyone’s convinced. Critics argue that both the Rainbow Chart and models like S2F are as flimsy as a used-car salesman’s promises and lack any true empirical backbone. But hey, don’t take their word for it. They probably just missed the memo that Bitcoin is a “new asset class” with a heart of gold.
Models May Shine a Light, But They Don’t Hold the Map
At the end of the day, both of these models point to Bitcoin maturing into something that could be extraordinarily valuable. But let’s not kid ourselves into thinking they’re some crystal ball that can predict the future with certainty. Market psychology, liquidity changes, and that ever-popular wild card known as “geopolitics” are just some of the forces that can make or break the price trajectory.
So, while the colored bands and scarcity metrics might give you something to talk about at your next crypto meetup, don’t stake your next vacation on them. Models are merely guideposts — not gospel — and in this unpredictable market, who knows what the next big catalyst might be?
Read More
- 50 Ankle Break & Score Sound ID Codes for Basketball Zero
- 50 Goal Sound ID Codes for Blue Lock Rivals
- Who Is Harley Wallace? The Heartbreaking Truth Behind Bring Her Back’s Dedication
- Mirren Star Legends Tier List [Global Release] (May 2025)
- League of Legends MSI 2025: Full schedule, qualified teams & more
- Jump Stars Assemble Meta Unit Tier List & Reroll Guide
- 28 Years Later Fans Go Wild Over Giant Zombie Dongs But The Director’s Comments Will Shock Them
- Basketball Zero Boombox & Music ID Codes – Roblox
- Ultimate Myth Idle RPG Tier List & Reroll Guide
- Pacers vs. Thunder Game 7 Results According to NBA 2K25
2025-05-09 17:12