Ah, VanEck. The US asset management giant, the brave soul, has graced us with the submission of its Form S-1 for the Binance Coin (BNB) exchange-traded fund (ETF). What a time to be alive! 💥
This piece of paperwork—nay, this *epic tale*—details the “VanEck BNB ETF.” It carefully outlines the company’s business operations, financial status (because who doesn’t love a bit of financial drama?), and how it plans to set the offering price. Oh, the suspense!
Filing this treasure with the United States Securities and Exchange Commission (SEC) on March 31, VanEck aims to bring BNB into the regulated fold, much like its prior triumphs with Bitcoin and Ethereum ETFs. A financial superhero in action. 🦸♂️
But 💸
Though approval is still hanging in the balance, the buzz surrounding BNB is impossible to ignore. What was once a coin tightly bound to exchanges, is now seen by traders as a pivotal player in the Web3 revolution. Oh, how the tables have turned! 🔄
The BNB Price Conundrum
The filing has set the rumor mills spinning. Will BNB soar to new heights? Could it truly be adopted by traditional finance? The token, trading at $593 at the time of writing, has shown little movement in the past 24 hours. Boring, right? But don’t blink—things are about to get interesting! 🧐
Since February, BNB has been dancing within a symmetrical triangle pattern on the daily chart. Analysts are practically biting their nails as the price nears the apex. A breakout? Oh, it’s coming… just wait for it. 📉📈
If the bulls push BNB past the $615 resistance, the next major targets are in the $640–$650 range. But, and here’s the cliffhanger, if the bears take charge and the price slips below $580, we could see BNB tumbling down to $560. Who doesn’t love a good dramatic plunge? 😱
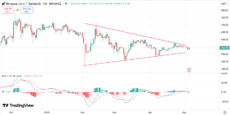
BNB price chart | Source: Trading View
In case you were wondering about the finer details—on the daily BNB price chart, the signal line is hovering just above the MACD line. The result? Minor bearish pressure. But don’t get too comfortable; the histogram shows minimal divergence. A momentum shift is on the horizon! ⏳
The RSI sits comfortably at 52, meaning we’re in neutral territory. Translation: the price could swing either way—because who doesn’t love a little suspense? 😏
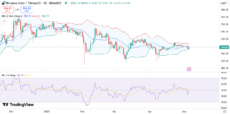
BNB price chart with Bollinger Bands | Source: Trading View
Meanwhile, the Bollinger Bands are narrowing. The price is hugging the middle band, like a cat in a blanket. This hints at a *huge* move just around the corner. A breakout above the upper band, near $614? Oh, that could trigger some serious bullish action. Hold onto your seats, folks! 😲
Read More
- Who Is Harley Wallace? The Heartbreaking Truth Behind Bring Her Back’s Dedication
- 50 Ankle Break & Score Sound ID Codes for Basketball Zero
- Lost Sword Tier List & Reroll Guide [RELEASE]
- 100 Most-Watched TV Series of 2024-25 Across Streaming, Broadcast and Cable: ‘Squid Game’ Leads This Season’s Rankers
- 50 Goal Sound ID Codes for Blue Lock Rivals
- KPop Demon Hunters: Real Ages Revealed?!
- The best Easter eggs in Jurassic World Rebirth, including callbacks to Jurassic Park
- Umamusume: Pretty Derby Support Card Tier List [Release]
- Basketball Zero Boombox & Music ID Codes – Roblox
- Come and See
2025-05-05 18:06