Solana (SOL) has clearly been spending too much time pondering the meaning of life rather than climbing. Despite all the hype surrounding its ETF launch, the token has decided to go down 2.2% in the past 24 hours. Oh, and it’s been on a roller coaster with a 1% drop over the month. Traders? Yeah, they’re being a little cautious.
Now, despite being up more than 11% year-on-year (because Solana does occasionally try to behave), the short-term setup is getting, well, tense. The next 10% move could very well decide if this coin heads straight into a long, cold winter, complete with snowflakes and maybe a few penguins.
Hodlers And Mid-Term Holders Start To Cash Out
Solana’s price weakness is starting to show up on-chain like an awkward dinner conversation. The hodler net position change, a fancy term for whether long-term holders are clinging to their tokens like a lifeline, has been negative for the past three days. That’s not great, folks.
On October 25, the metric stood at -3.82 million SOL. By October 27, it had slightly climbed to -3.90 million SOL, which means more tokens are escaping long-term wallets faster than a cat trying to avoid a bath.
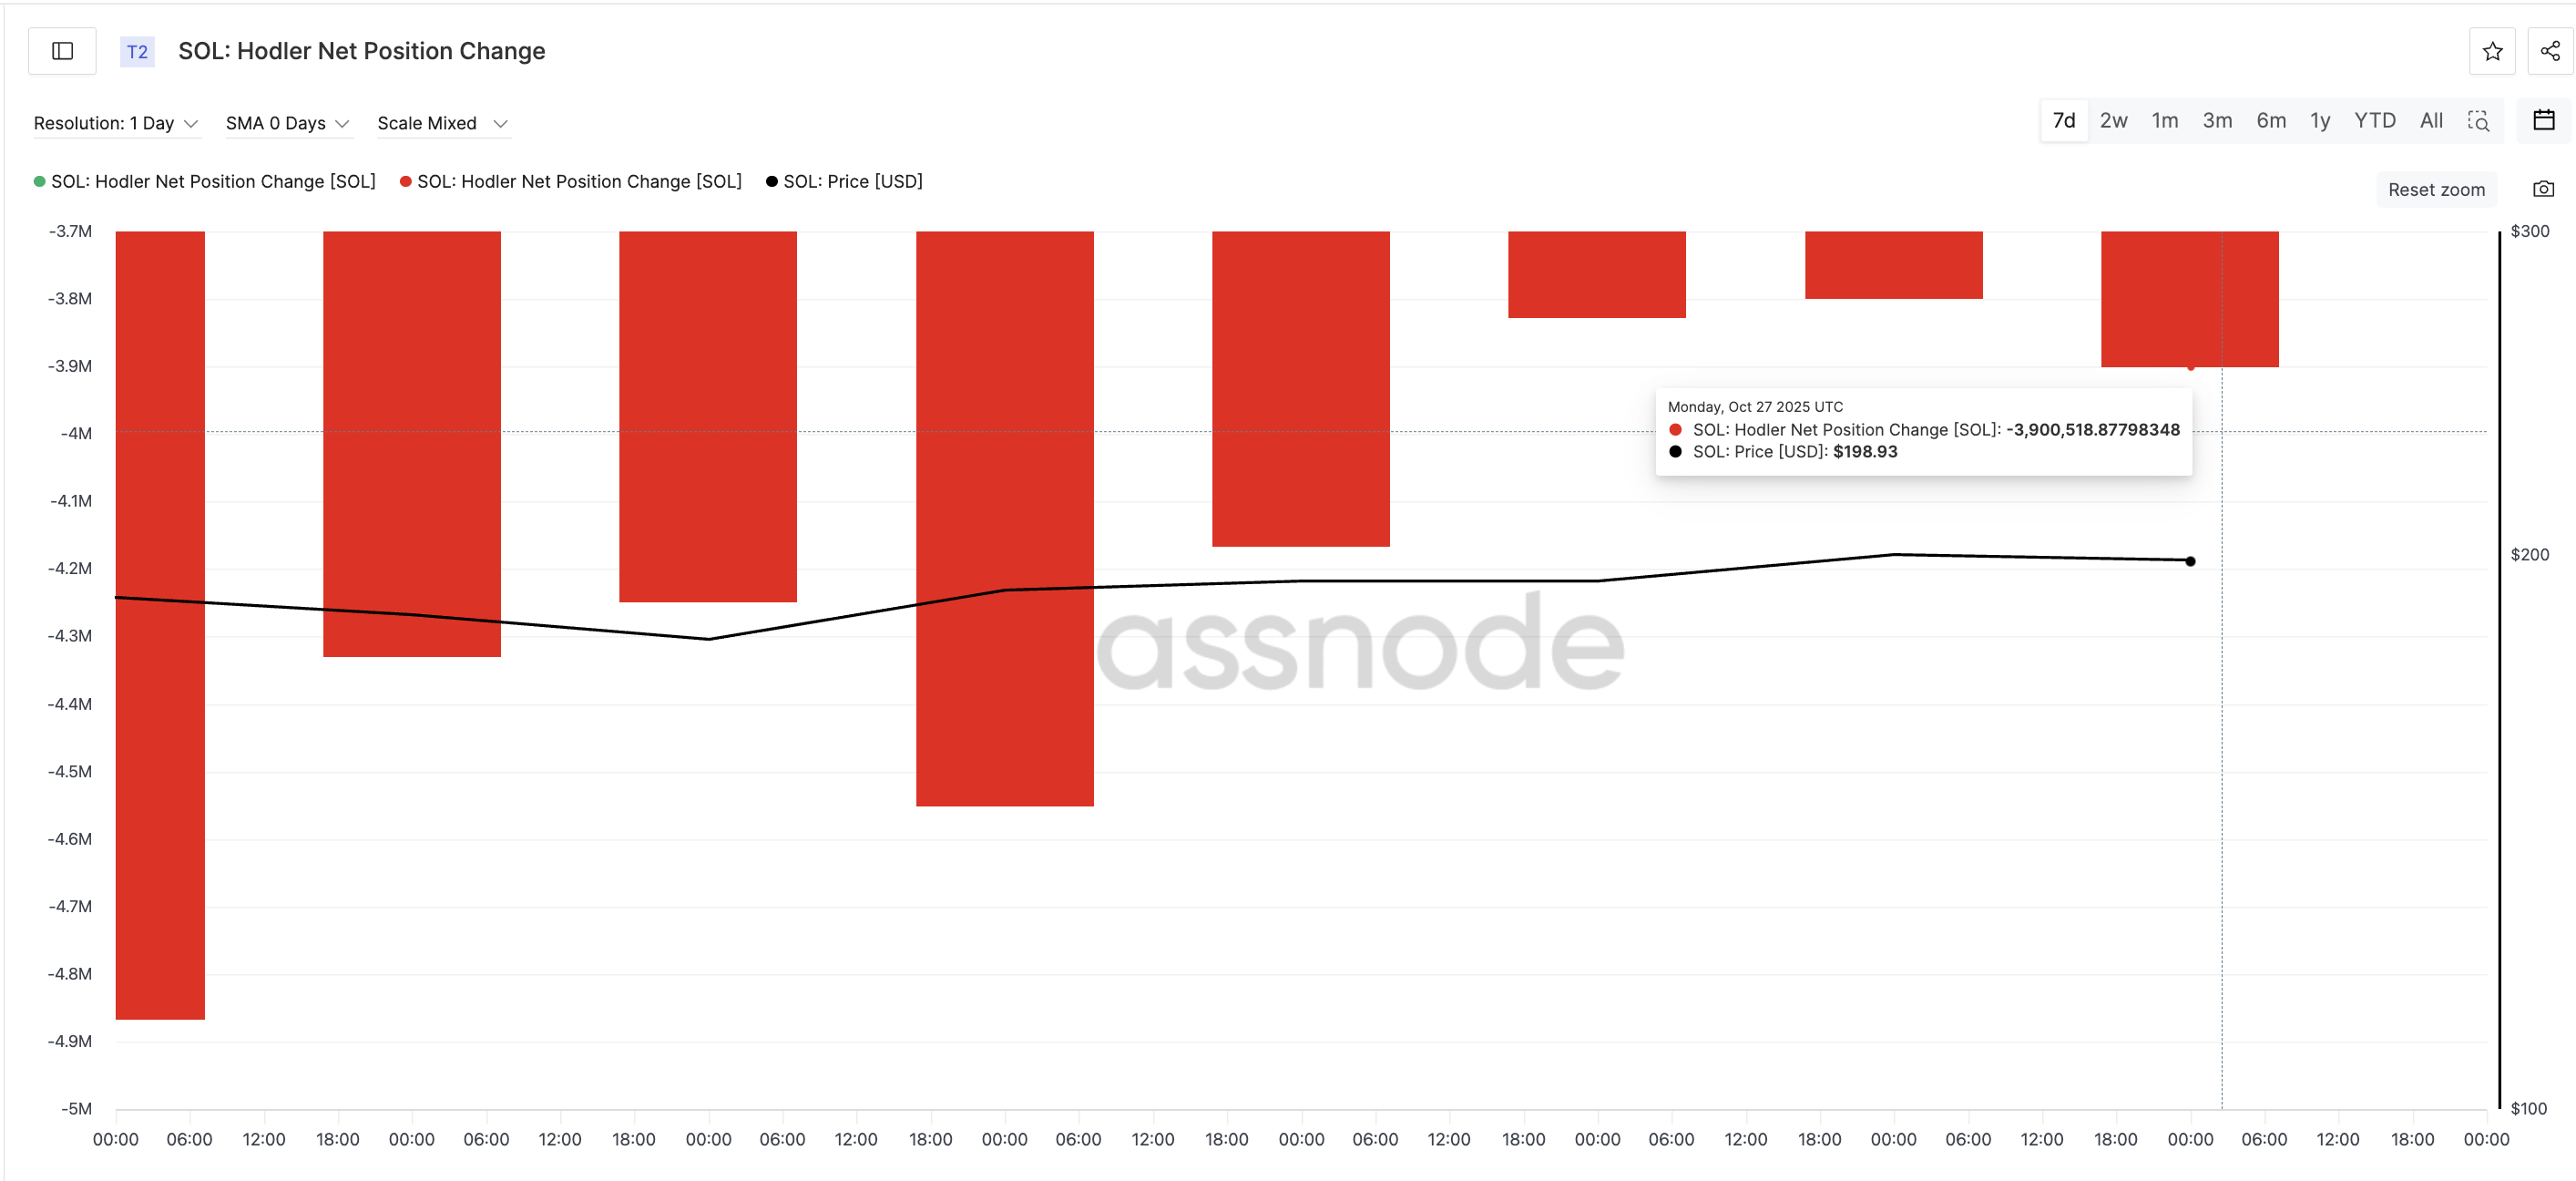
This isn’t as catastrophic as the -4.86 million SOL reading on October 20, but it’s still a sign that long-term investors are packing up and taking their toys elsewhere. Why? Probably to avoid the coming volatility. Smart move, right?
The same pattern shows up in Solana’s HODL waves, which tracks the share of the total supply that is held by different wallet cohorts. Mid-term holders (the ones holding on for about 3-6 months) have reduced their share from 12.76% on September 28 to a neat 11.39% by October 27. That’s a 10.7% decline in just one month. Ouch. This group is slowly heading for the exit while the market remains as exciting as a soggy toast.
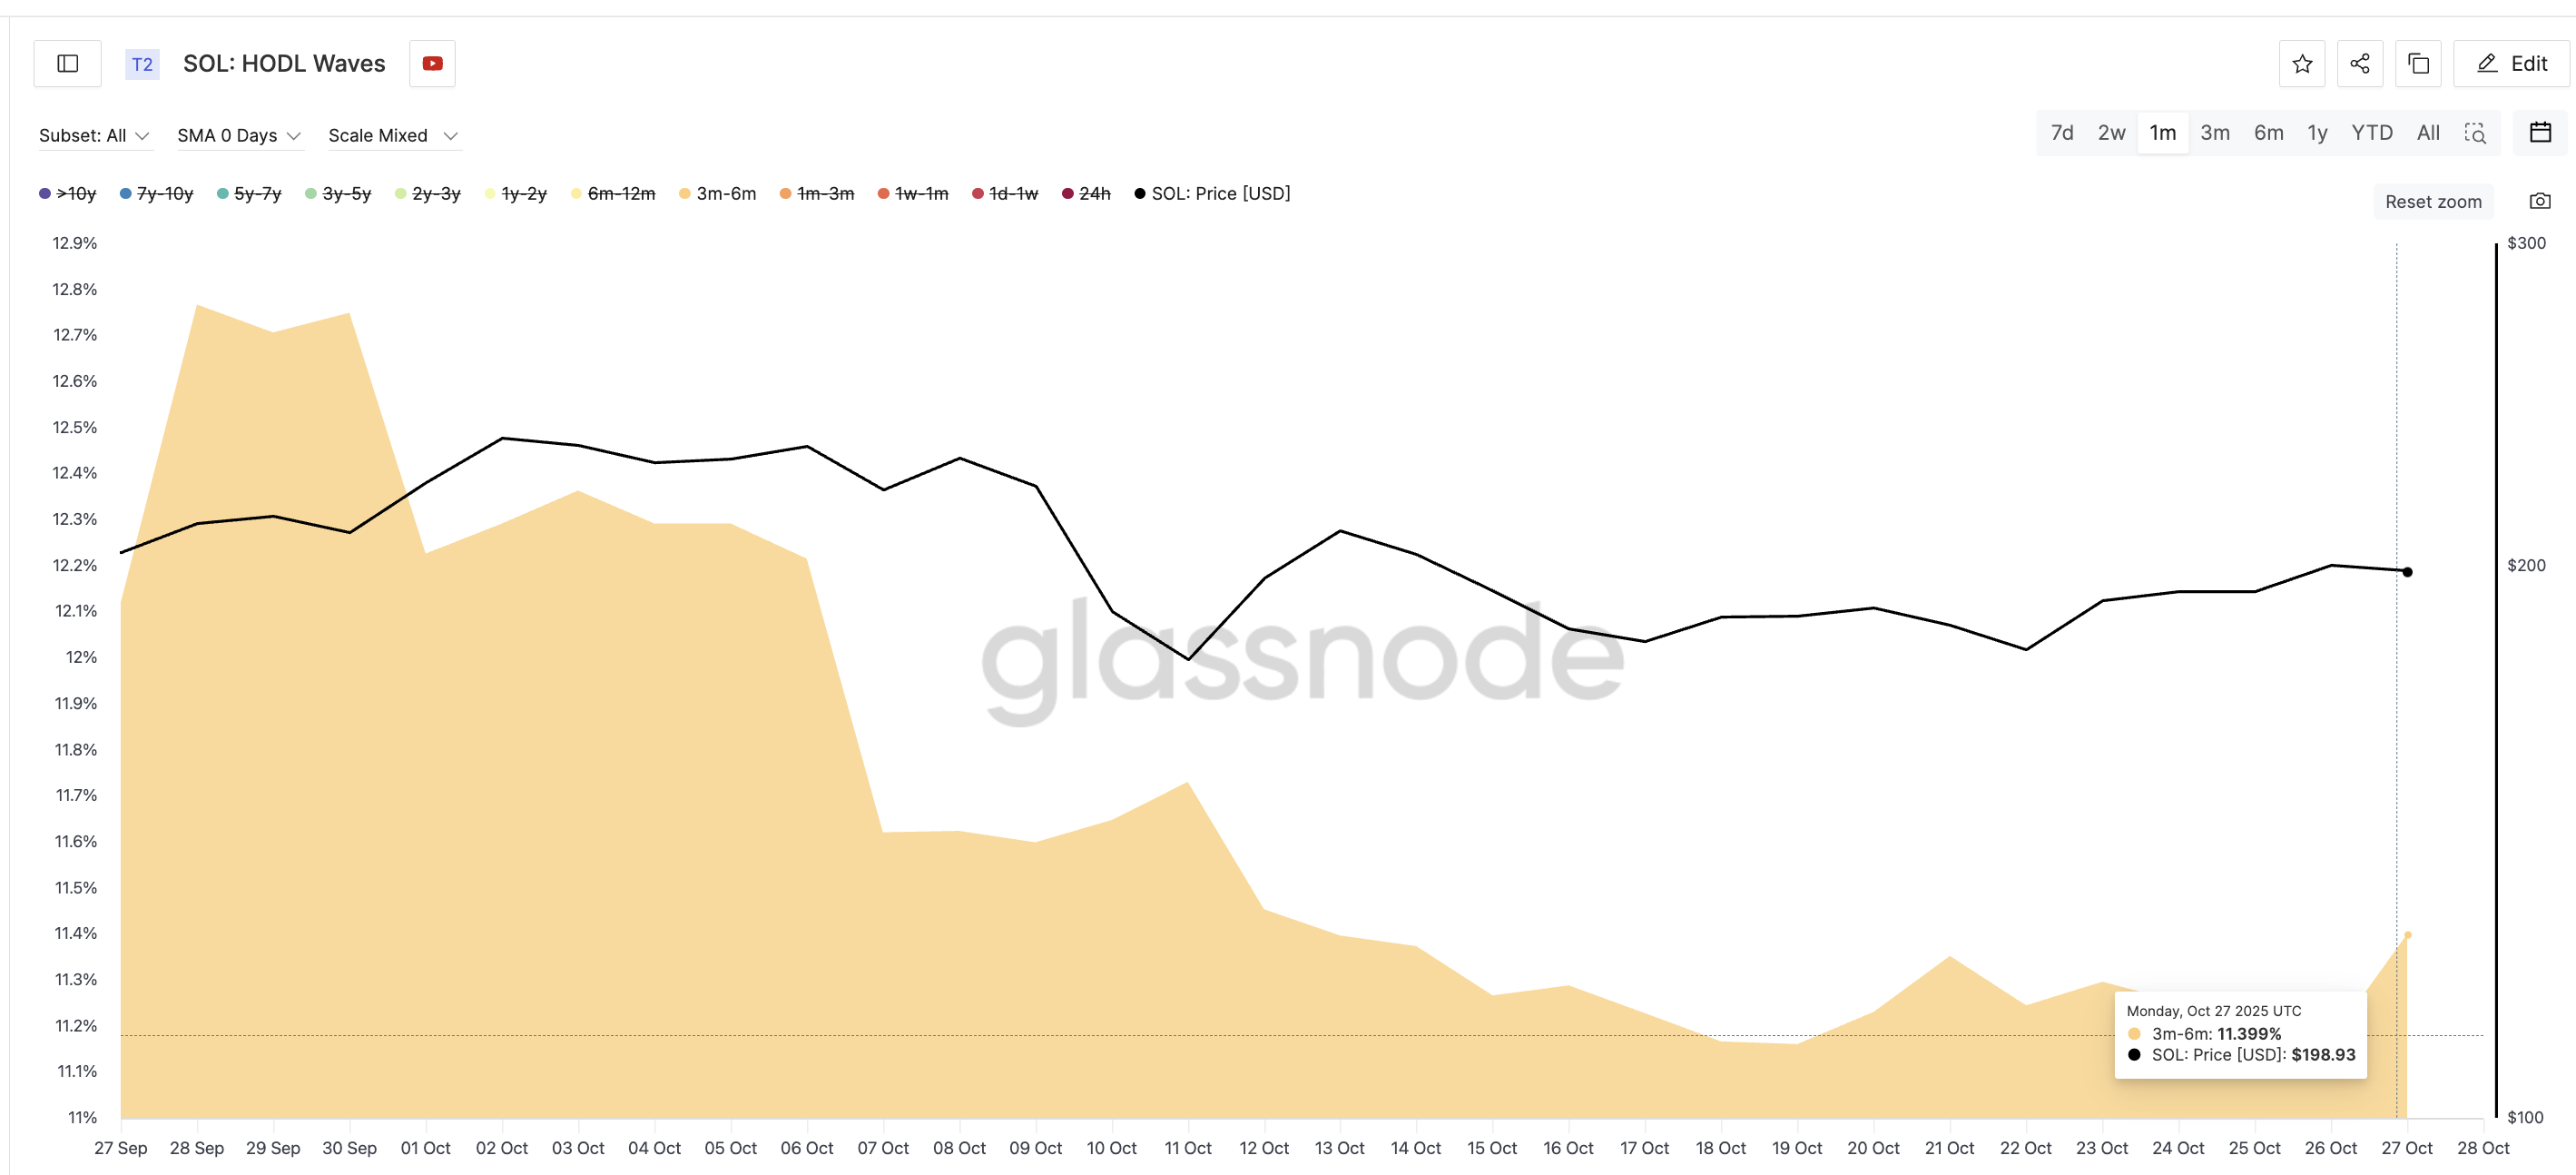
All of this suggests that the once firm conviction in Solana is now… well, not so firm. The wallets that helped stabilize the dips are now backing out, leaving the price more exposed to the whims of short-term sentiment. It’s like trying to hold a balloon in a hurricane.
Leverage Builds Despite Bearish Signs
The derivatives market is shouting at us, and for some reason, traders are covering their ears. They seem to be ignoring the bearish signs. On Bybit, the long-short ratio is tipping dangerously in favor of the longs. Over 80% of positions are long, with about $884.15 million in long leverage compared to a measly $288.42 million in short exposure. Someone’s feeling a bit too optimistic here.
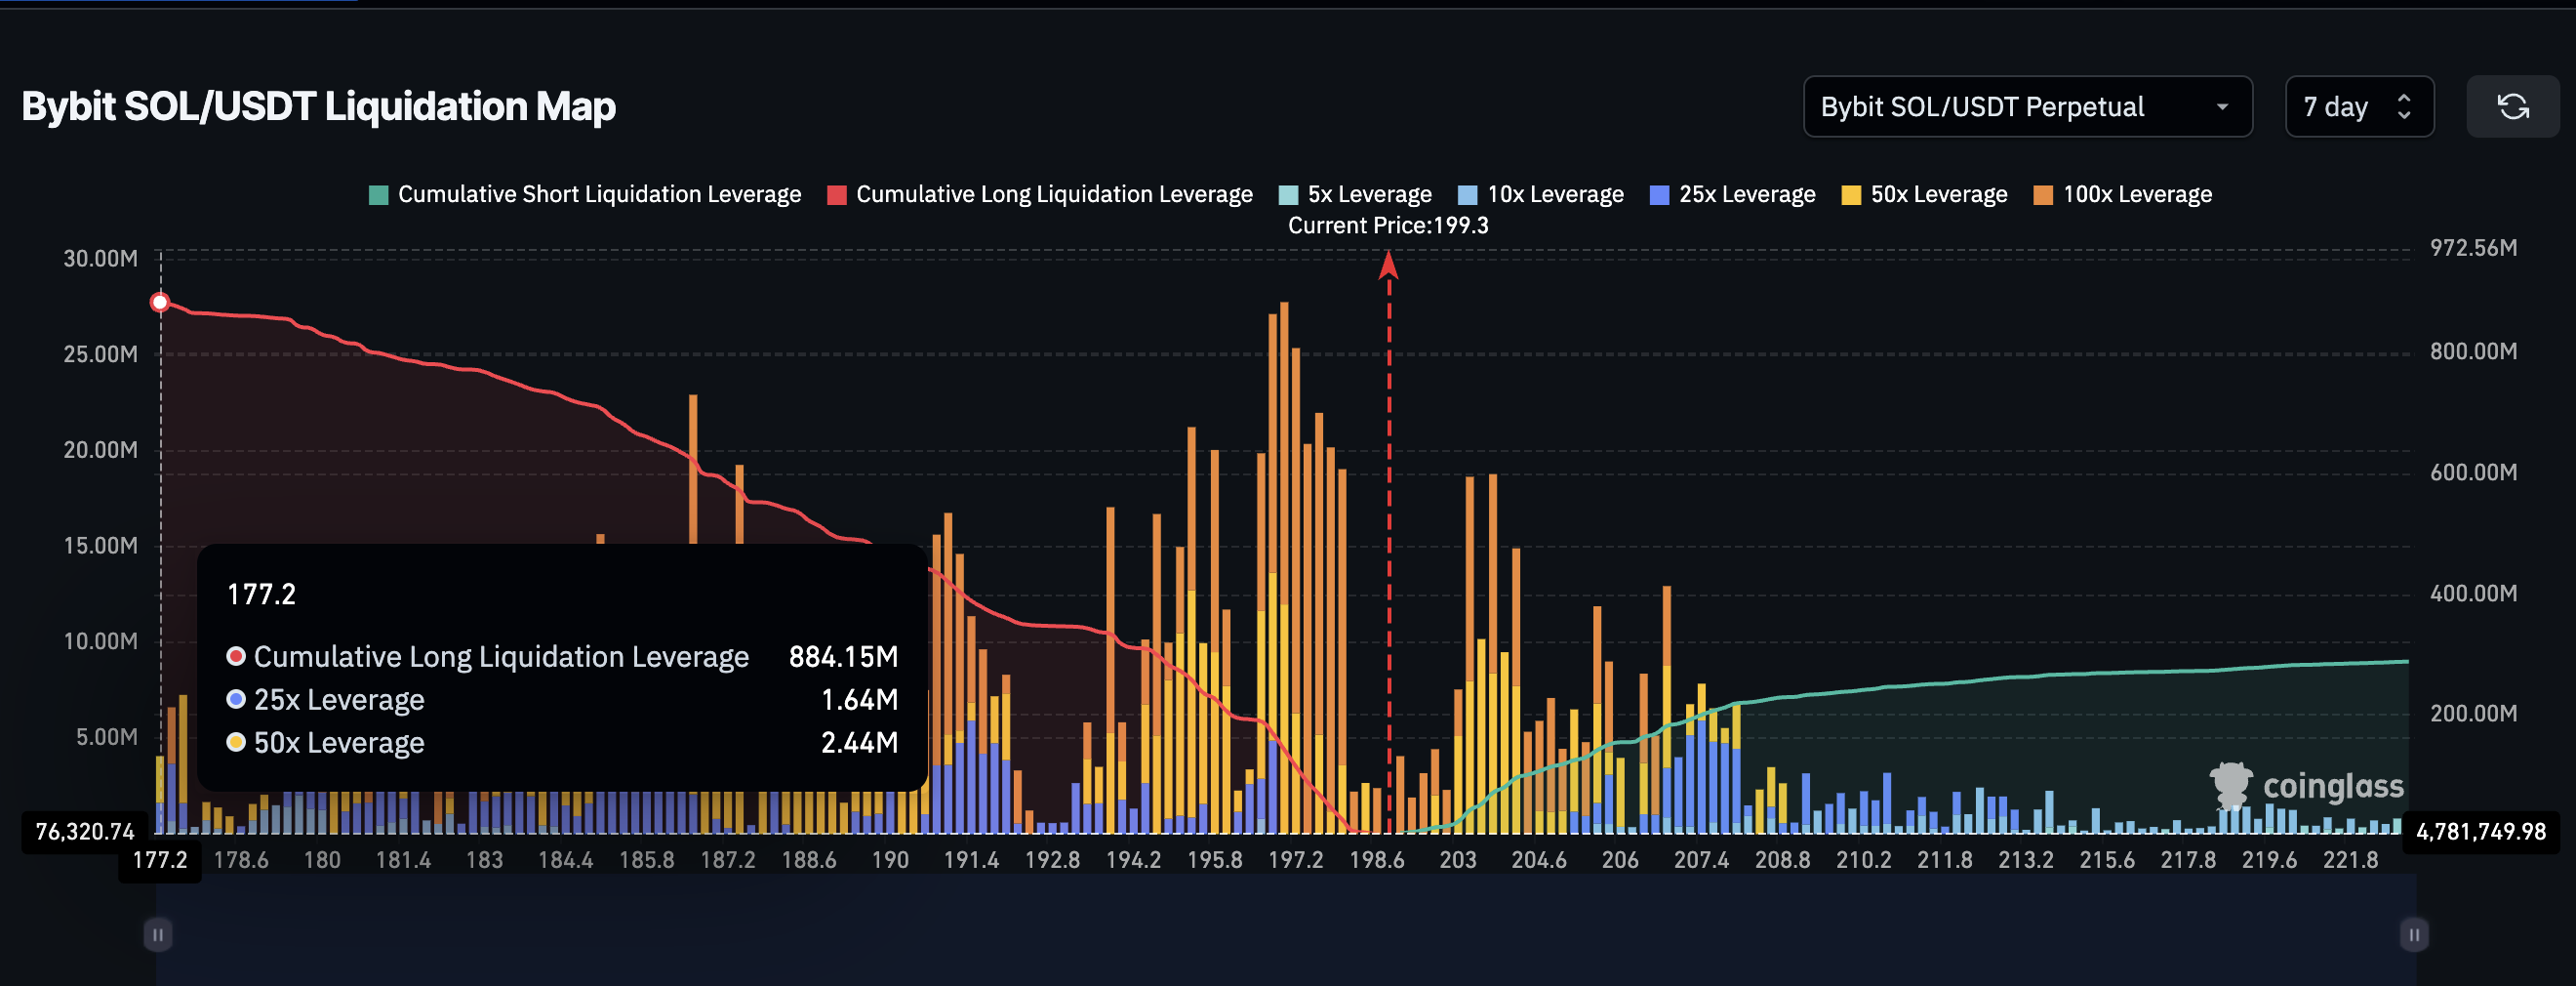
This imbalance is about as risky as jumping on a trampoline during a thunderstorm. If Solana’s price takes a tumble, all those leveraged longs will have to sell to cover their losses, causing a “long squeeze.” Fun, right?
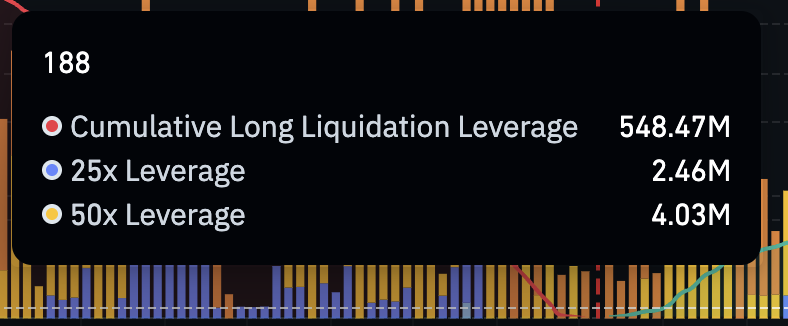
The danger zone? Oh, it’s around $188, where a price drop could wipe out up to $548 million in leveraged positions. Talk about losing your lunch. And guess what? That’s also where Solana’s key support level is. So, in short, this is the moment between a nice, gentle bounce and a catastrophic crash. No pressure.
So, despite traders betting on a rebound, this overwhelming optimism could very well come crashing down if the bearish chart setup decides to have its way. And let’s face it, charts can be a little bit moody sometimes.
Pattern And Divergence Signal Trouble For The Solana Price
Solana’s daily chart is showing us a rising broadening wedge – no, not a new sandwich on the menu. It’s a bearish pattern that widens as volatility expands. Since October 26, the price has been struggling to stay above $201, facing rejection like a bad Tinder date.
Meanwhile, the Relative Strength Index (RSI), which measures buying versus selling strength, has been making higher highs. But guess what? Solana’s price has been making lower highs between October 13 and 26. Surprise, surprise – this is a hidden bearish divergence, indicating that momentum is waning, even while traders are still trying to push the price up. Classic case of wishful thinking.
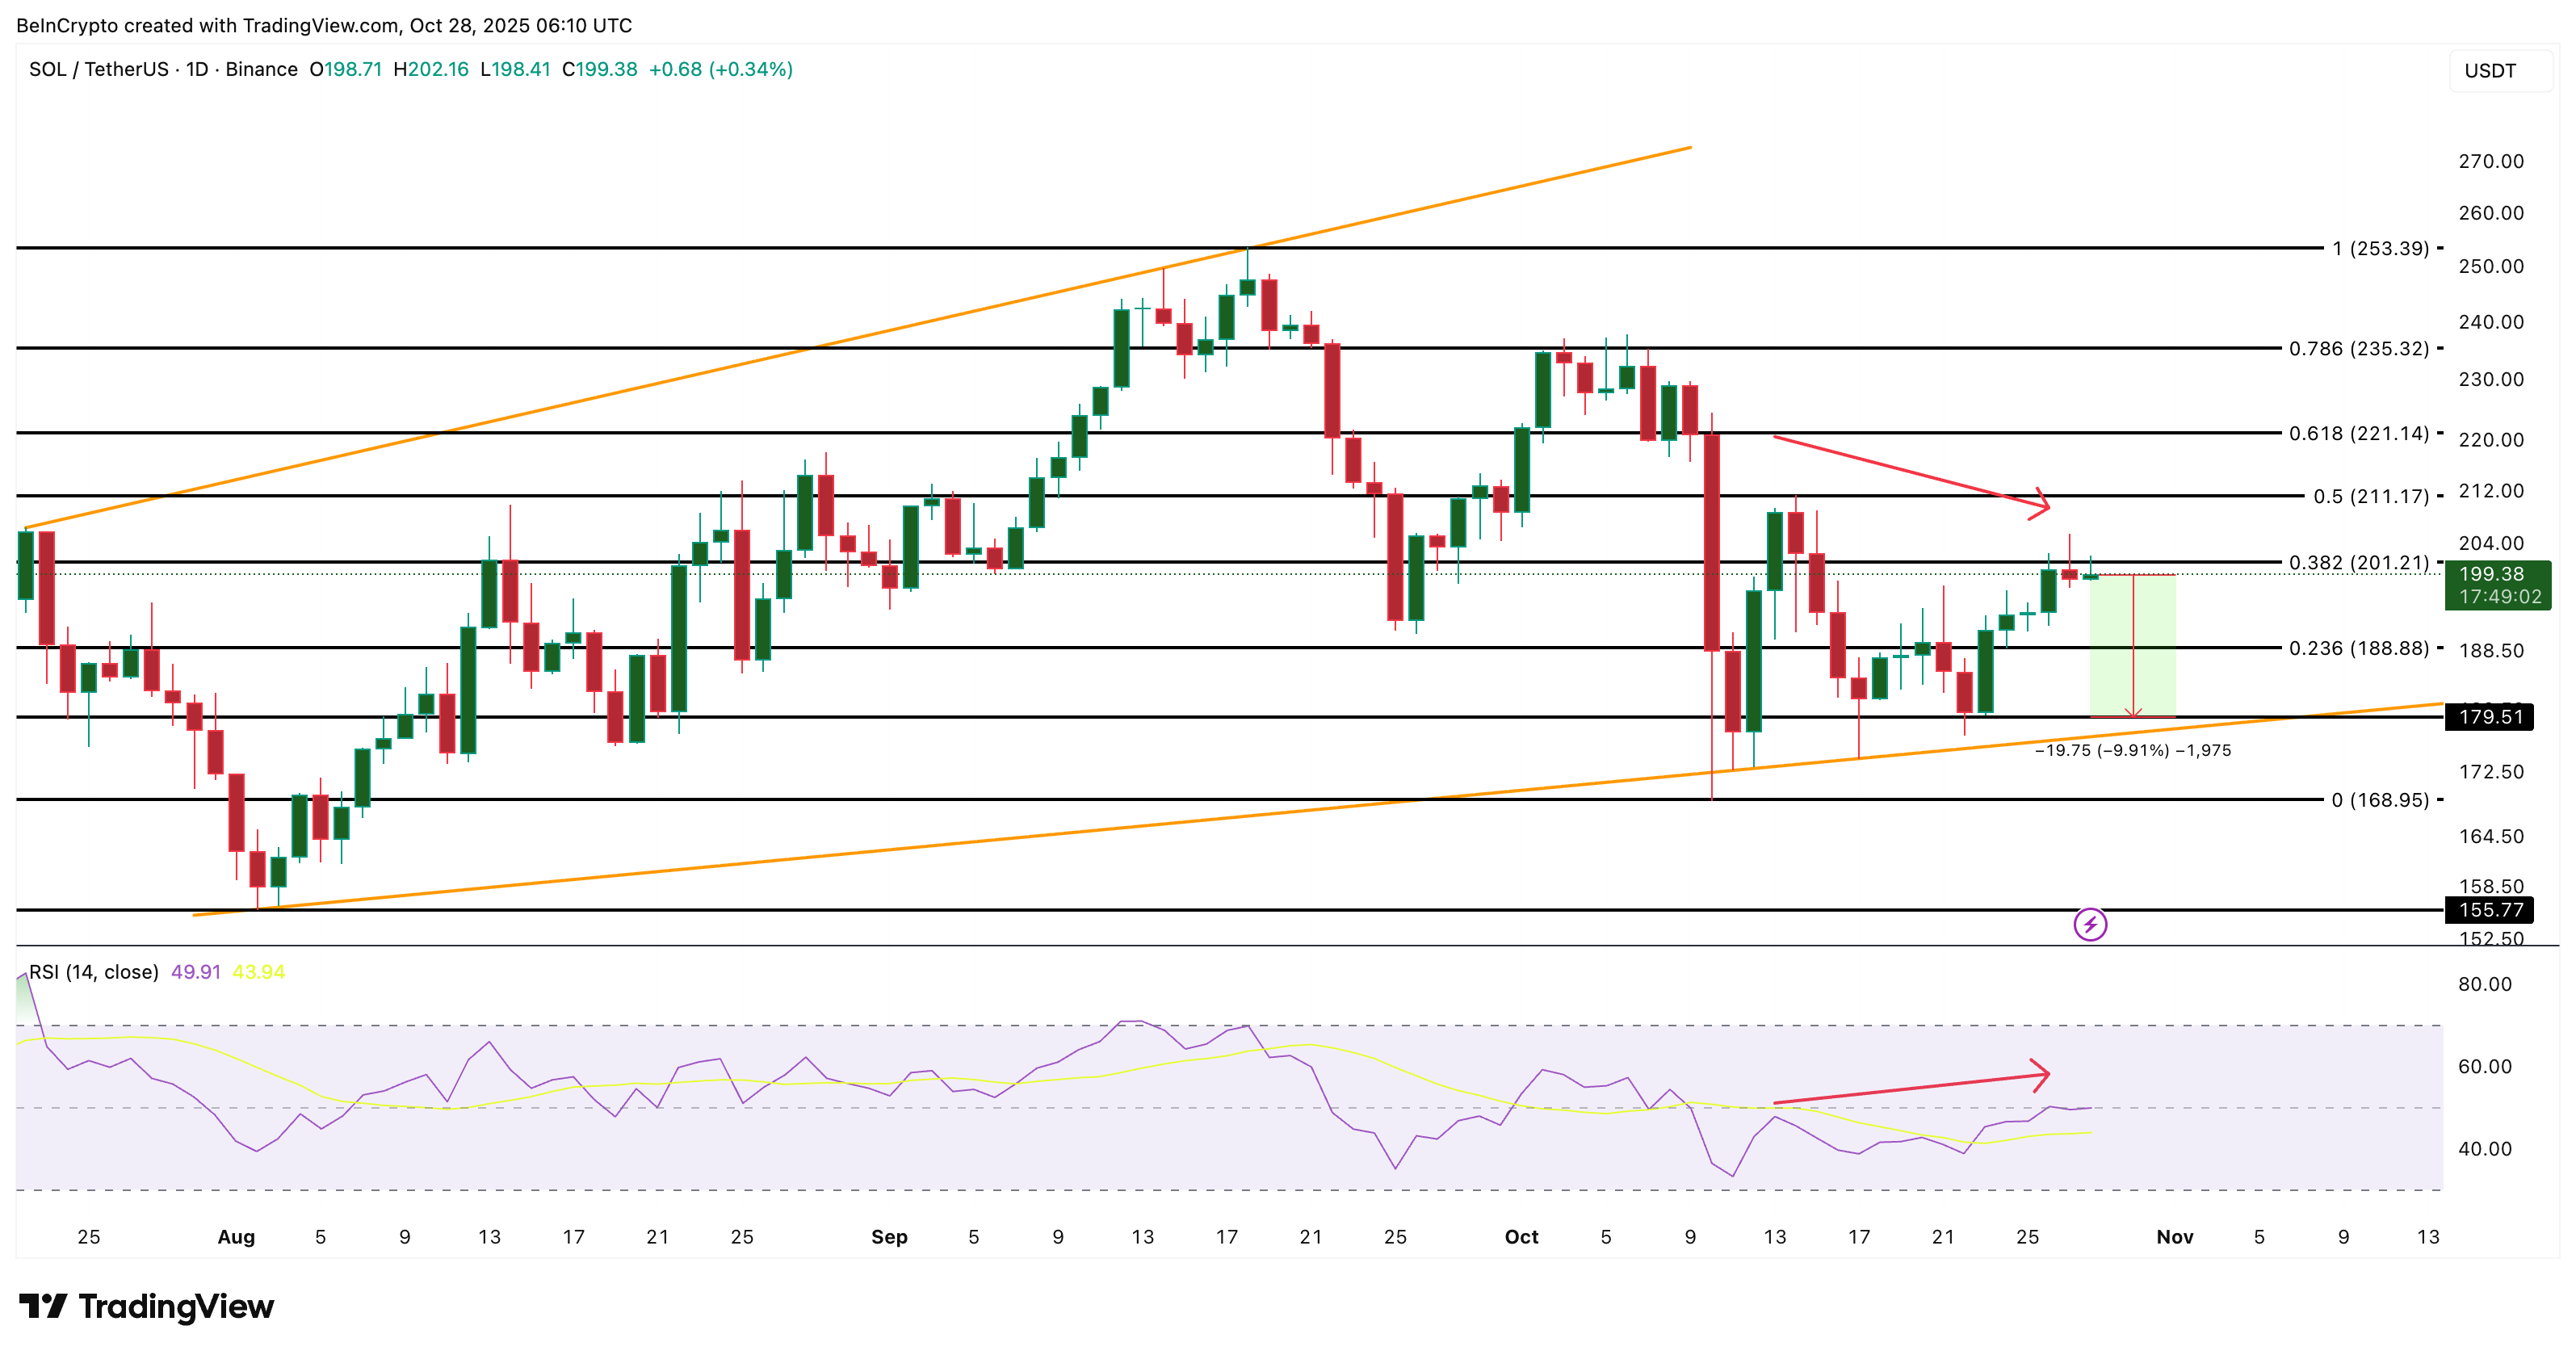
If Solana loses its $179 support (almost 10% from the current level), a daily close below that might send it tumbling towards $168. This would probably trigger panic, which would trigger almost all the longs to get liquidated. Fun times ahead. But the first key level is $188, where even a dip could wipe out nearly $548 million in longs.
If panic really sets in, a deeper decline could test $155. However, if things turn around (and we get a miracle), only a daily close above $235 would invalidate this bearish mess and restore some much-needed bullish confidence. We’ll see.
Read More
- United Airlines can now kick passengers off flights and ban them for not using headphones
- Crimson Desert: Disconnected Truth Puzzle Guide
- All 9 Coalition Heroes In Invincible Season 4 & Their Powers
- Grey’s Anatomy Season 23 Confirmed for 2026-2027 Broadcast Season
- Mewgenics vinyl limited editions now available to pre-order
- Viral Letterboxd keychain lets cinephiles show off their favorite movies on the go
- Does Mark survive Invincible vs Conquest 2? Comics reveal fate after S4E5
- How to Get to the Undercoast in Esoteric Ebb
- Assassin’s Creed Shadows will get upgraded PSSR support on PS5 Pro with Title Update 1.1.9 launching April 7
- All Golden Ball Locations in Yakuza Kiwami 3 & Dark Ties
2025-10-28 16:13