If you’ve ever wondered what happens when a cryptocurrency shaped like a dog decides to do its best impression of a soap opera plot twist, look no further than Shiba Inu (SHIB). This spring, SHIB traced out an inverted head-and-shoulders pattern so textbook-perfect that actual textbooks are now feeling insecure. According to the enigmatic analyst Cantonese Cat (@cantonmeow), Tuesday’s session confirmed the pattern had completed its full breakout-and-retest routine—think of it as the financial equivalent of a dog chasing its tail and finally catching it, only to realize it’s attached.
Shiba Inu’s Pattern: More Drama Than a Telenovela 🐕
The chart’s left shoulder dipped just above $0.00001082 in March, the head plunged to $0.00001030 in April (presumably after reading its own Reddit threads), and the right shoulder found support near $0.00001230 in May. After two months of this canine contortionism, SHIB leapt through the neckline on May 8 with a green candle so long it probably needed a leash.
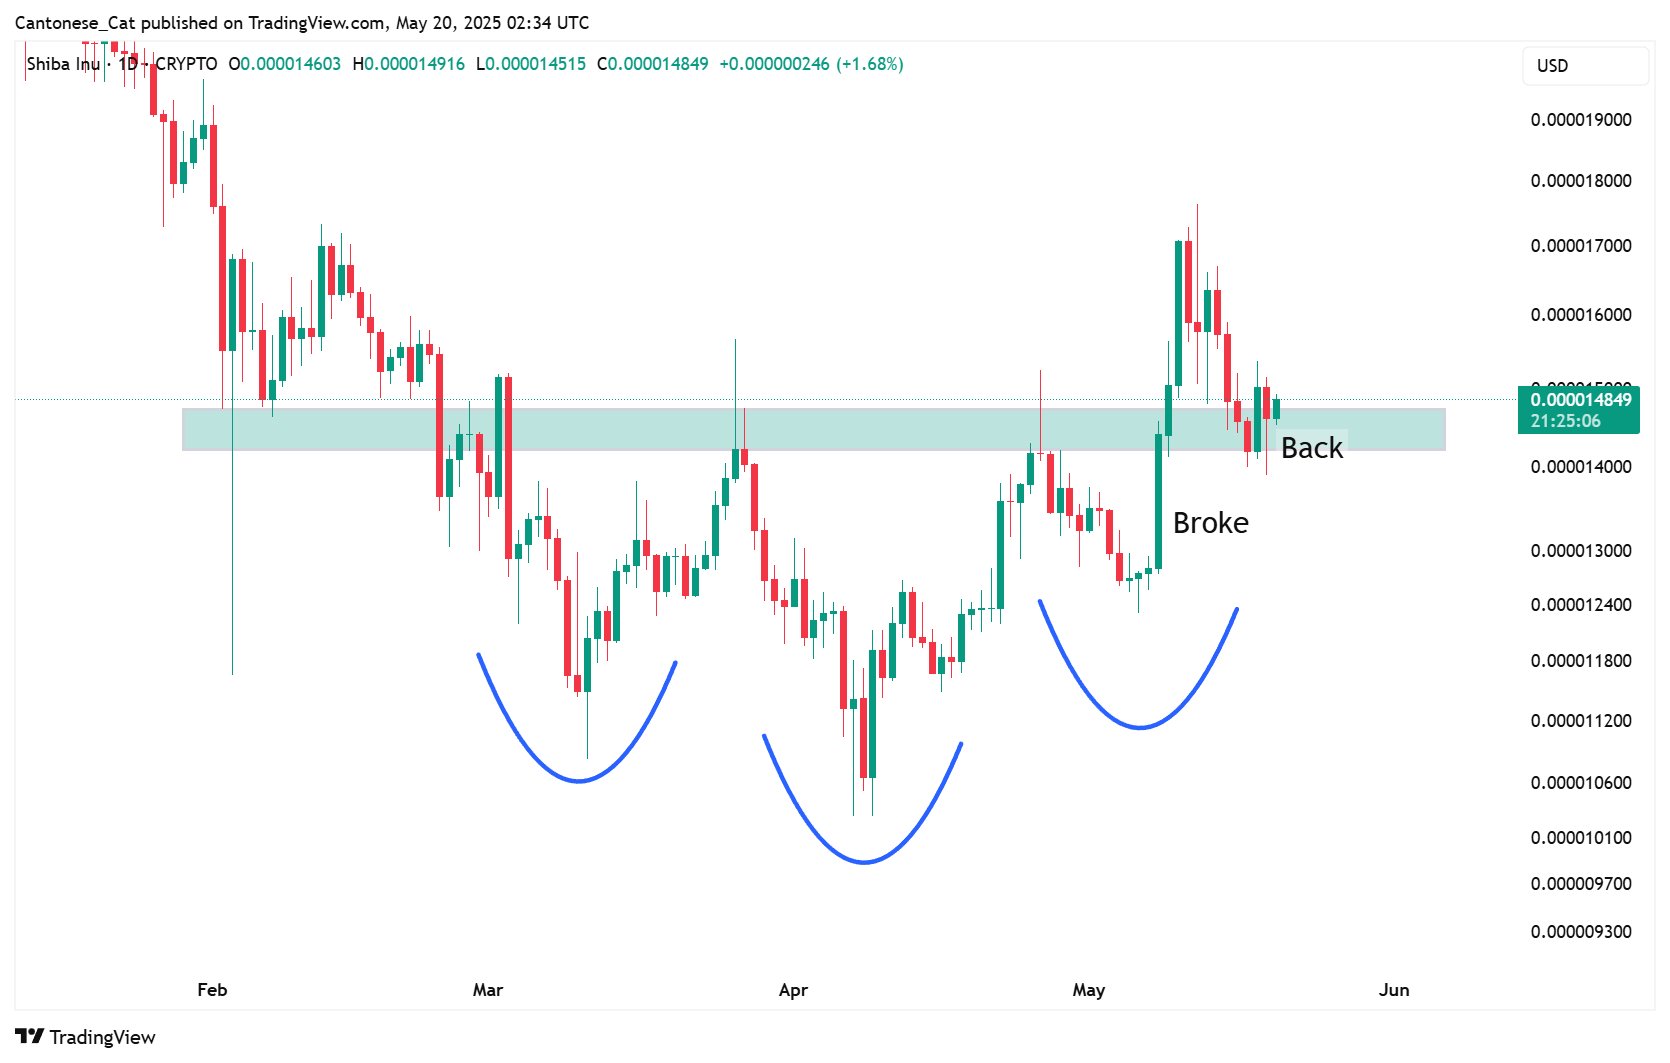
The breakout sent SHIB bounding up to $0.00001765—its highest since February—before profit-takers showed up like someone shaking a treat jar, prompting a classic “throwback.” The price then slumped back to the neckline zone, where buyers have been valiantly defending their territory, much like a small dog barking at the mailman. This successful retest is the final box ticked for technical analysts, who can now sleep soundly knowing the pattern is complete (or at least until the next plot twist).
By measuring from the head’s lowest point to the neckline’s midpoint, we get a vertical depth of about $0.0000037. Add that to the breakout area and voilà: you land right at $0.00001765. Coincidence? Or just Fibonacci having a laugh?
Cantonese Cat summed it up with all the gravitas of a fortune cookie: “SHIB daily – inverted H&S brokeback pattern completed. Favors bullish continuation.” In other words, the bulls are ready for another run—unless, of course, the bears have other plans (they usually do).
SHIB Price Targets: Fibonacci and Other Mystical Arts 🧙♂️
For those who like their price targets sprinkled with a dash of numerology, Fibonacci retracement levels are here to help. Anchoring from last summer’s high at $0.00004569 to March’s low at $0.00001030 gives us a 23.6% retracement at $0.00001865—just after the 200-day EMA at $0.00001603, which is basically the chart’s way of saying “Are we there yet?”
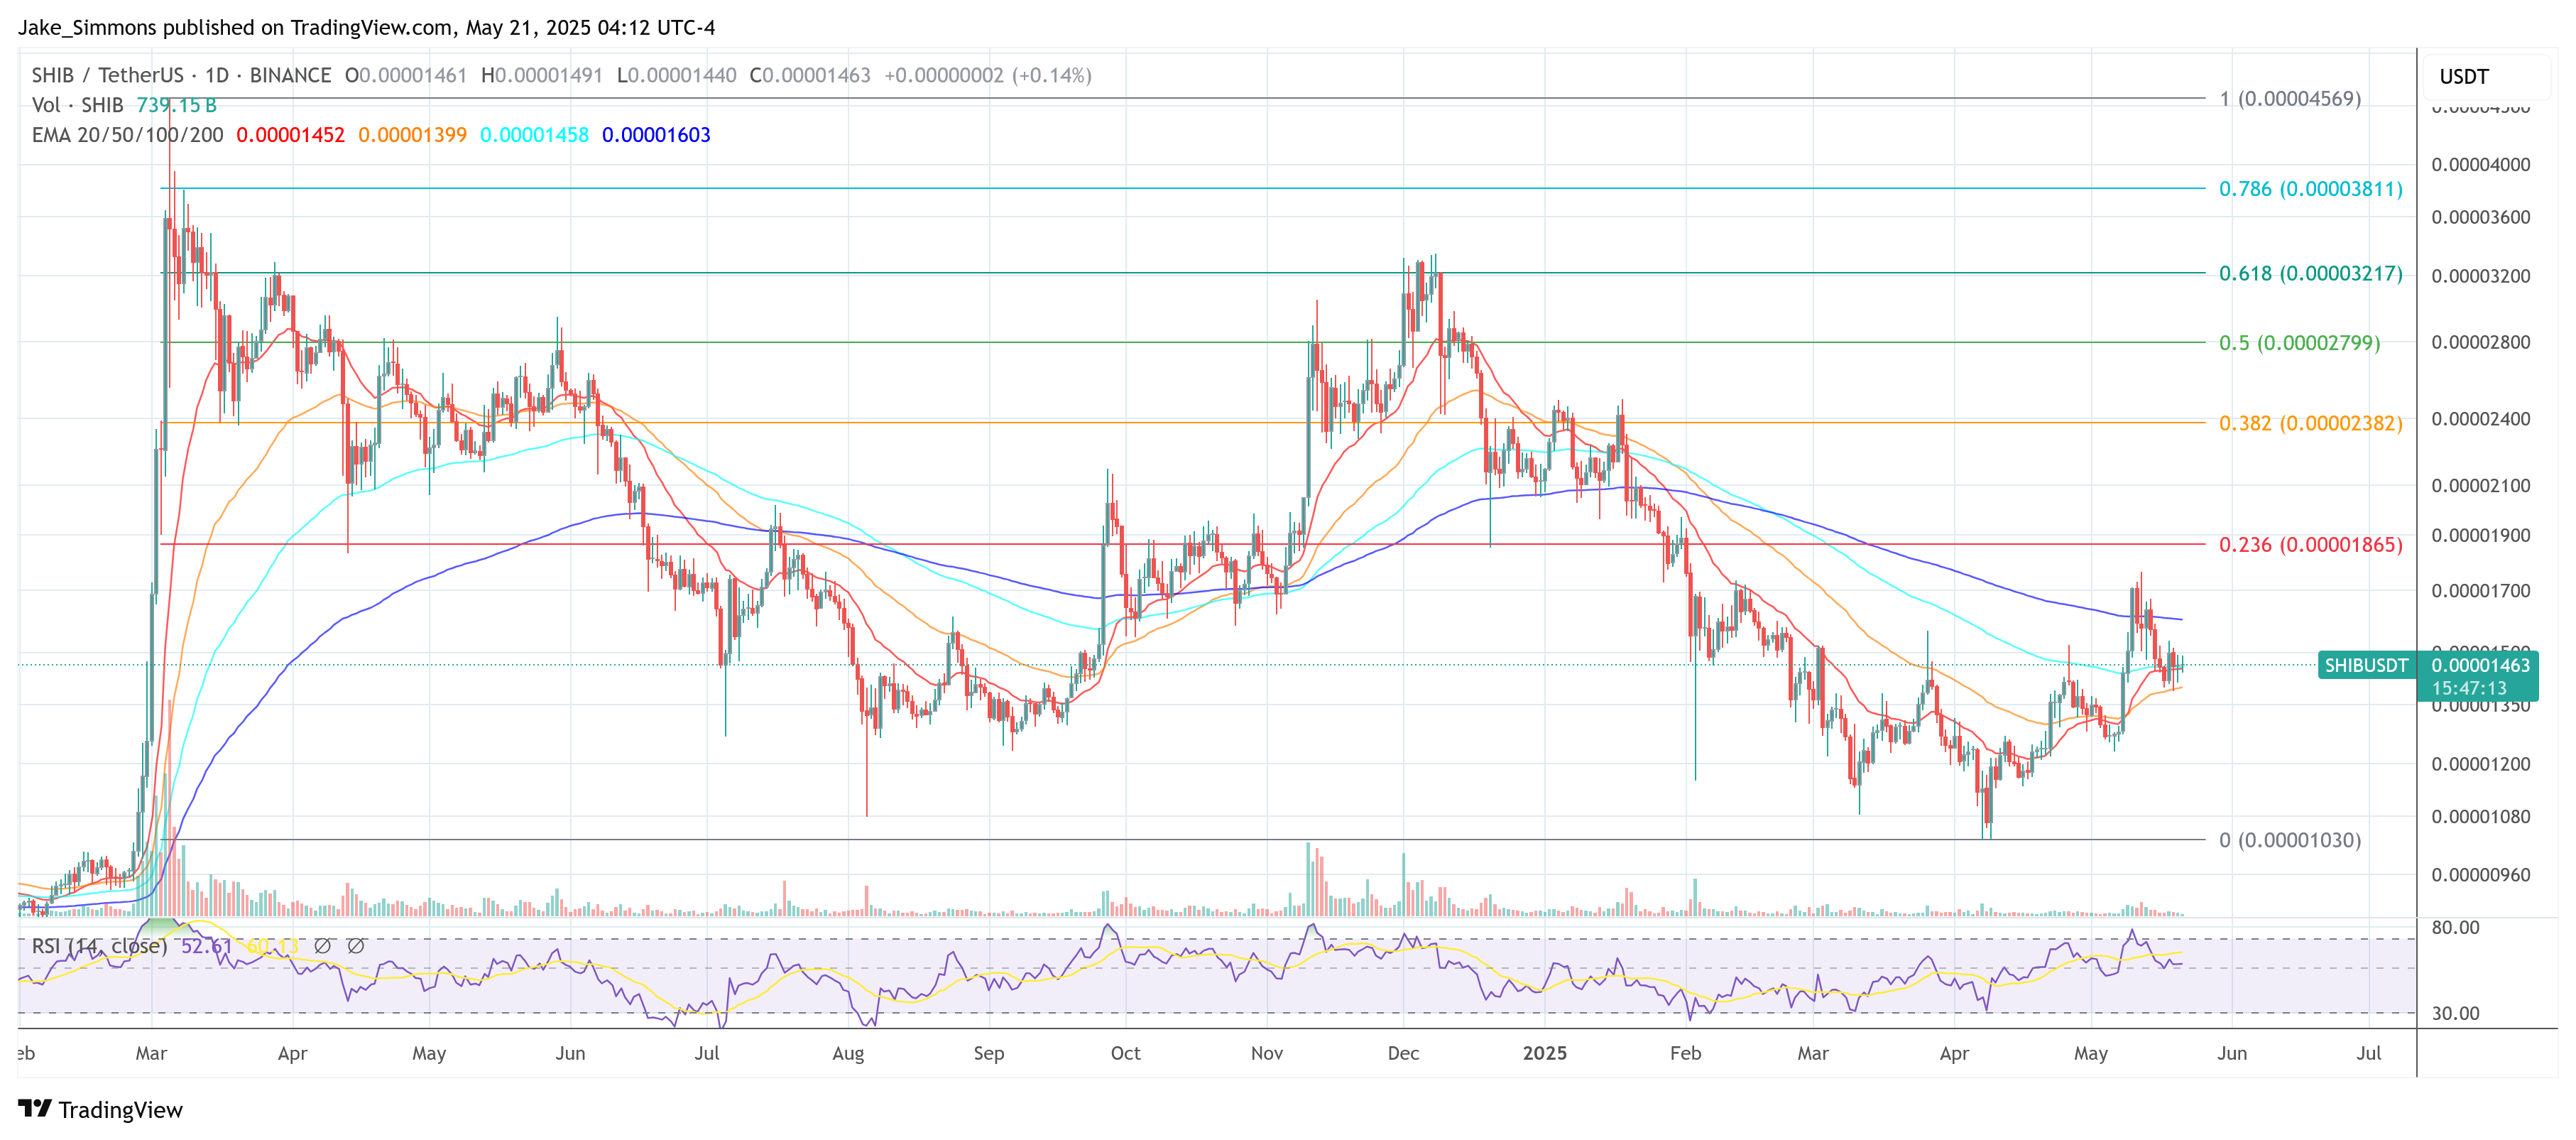
If buyers can leap over both these hurdles without tripping over their own paws, next up are $0.00002382 (38.2%) and $0.00002799—the latter being the midpoint and also where last December’s congestion zone lurks like an old chew toy under the sofa. Beyond that, there’s the golden-ratio mark at $0.00003217 and 78.6% retracement at $0.00003811, which are basically the final bosses before SHIB can even think about challenging its all-time high again.
But beware: if SHIB fails to defend its precious neckline around $0.00001430, the bullish script gets tossed out faster than yesterday’s leftovers, with risk shifting back to the 50-day EMA at $0.00001399 and possibly all the way down to $0.00001030—the cycle floor and spiritual home of disappointed bagholders everywhere. Until then, though, Fibonacci insists momentum is still wagging in favor of buyers aiming for those high-teens and maybe even low-twenties in the coming weeks.
SHIB is either about to embark on an epic moon mission or just circle the yard for a bit before lying down in a sunbeam. As always in crypto, bring snacks and expect surprises. 🦴🚀
Read More
- Who Is Harley Wallace? The Heartbreaking Truth Behind Bring Her Back’s Dedication
- 50 Ankle Break & Score Sound ID Codes for Basketball Zero
- 50 Goal Sound ID Codes for Blue Lock Rivals
- KPop Demon Hunters: Real Ages Revealed?!
- Lottery apologizes after thousands mistakenly told they won millions
- 100 Most-Watched TV Series of 2024-25 Across Streaming, Broadcast and Cable: ‘Squid Game’ Leads This Season’s Rankers
- Umamusume: Pretty Derby Support Card Tier List [Release]
- Ultimate AI Limit Beginner’s Guide [Best Stats, Gear, Weapons & More]
- Mirren Star Legends Tier List [Global Release] (May 2025)
- Former Blizzard president worried about future of Xbox and says changes are needed “fast”
2025-05-21 20:50