
What to know:
- BTC‘s swift recovery from $89K Monday hints at seller exhaustion.
- The pattern is inverse of price action in mid-December.
- Wednesday’s U.S. CPI could bring more volatility.
Among cryptocurrency traders, the main topic of discussion is this: Has the decline in Bitcoin’s (BTC) value reached its limit, or will it continue further?
It seems that what happened on Monday was different than in mid-December. On Monday, we saw a quick rebound from the day’s lowest prices, whereas in mid-December, the rally stopped and even reversed direction after reaching record highs above $108,000.
On Monday, Bitcoin (BTC) initially dropped in value due to investment banks revising down their predictions for Federal Reserve interest rate reductions. Some analysts even suggested the possibility of interest rate increases following Friday’s robust jobs report, leading to a decrease in prices that fell below the lower boundary of its crucial support range between $90,000 and $93,000, as significant U.S. stock indices also experienced a sharp decline at the opening.
Despite the temporary loss of backing, this setback proved fleeting. By the close of the day, Bitcoin rebounded impressively, reaching approximately $94,000. This resurgence left in its wake the characteristic pattern known as a “long-tailed candlestick” or a “long-legged Doji candle.
In simpler terms, when a candle’s wick (the upper and lower sections) is particularly long, it suggests that a downtrend may be nearing its end because buyers have managed to push back against initial selling pressure. This pattern can be interpreted as a possible sign of a price bottom, especially when it appears at significant support points or after a significant price fall, like in the case of Bitcoin.
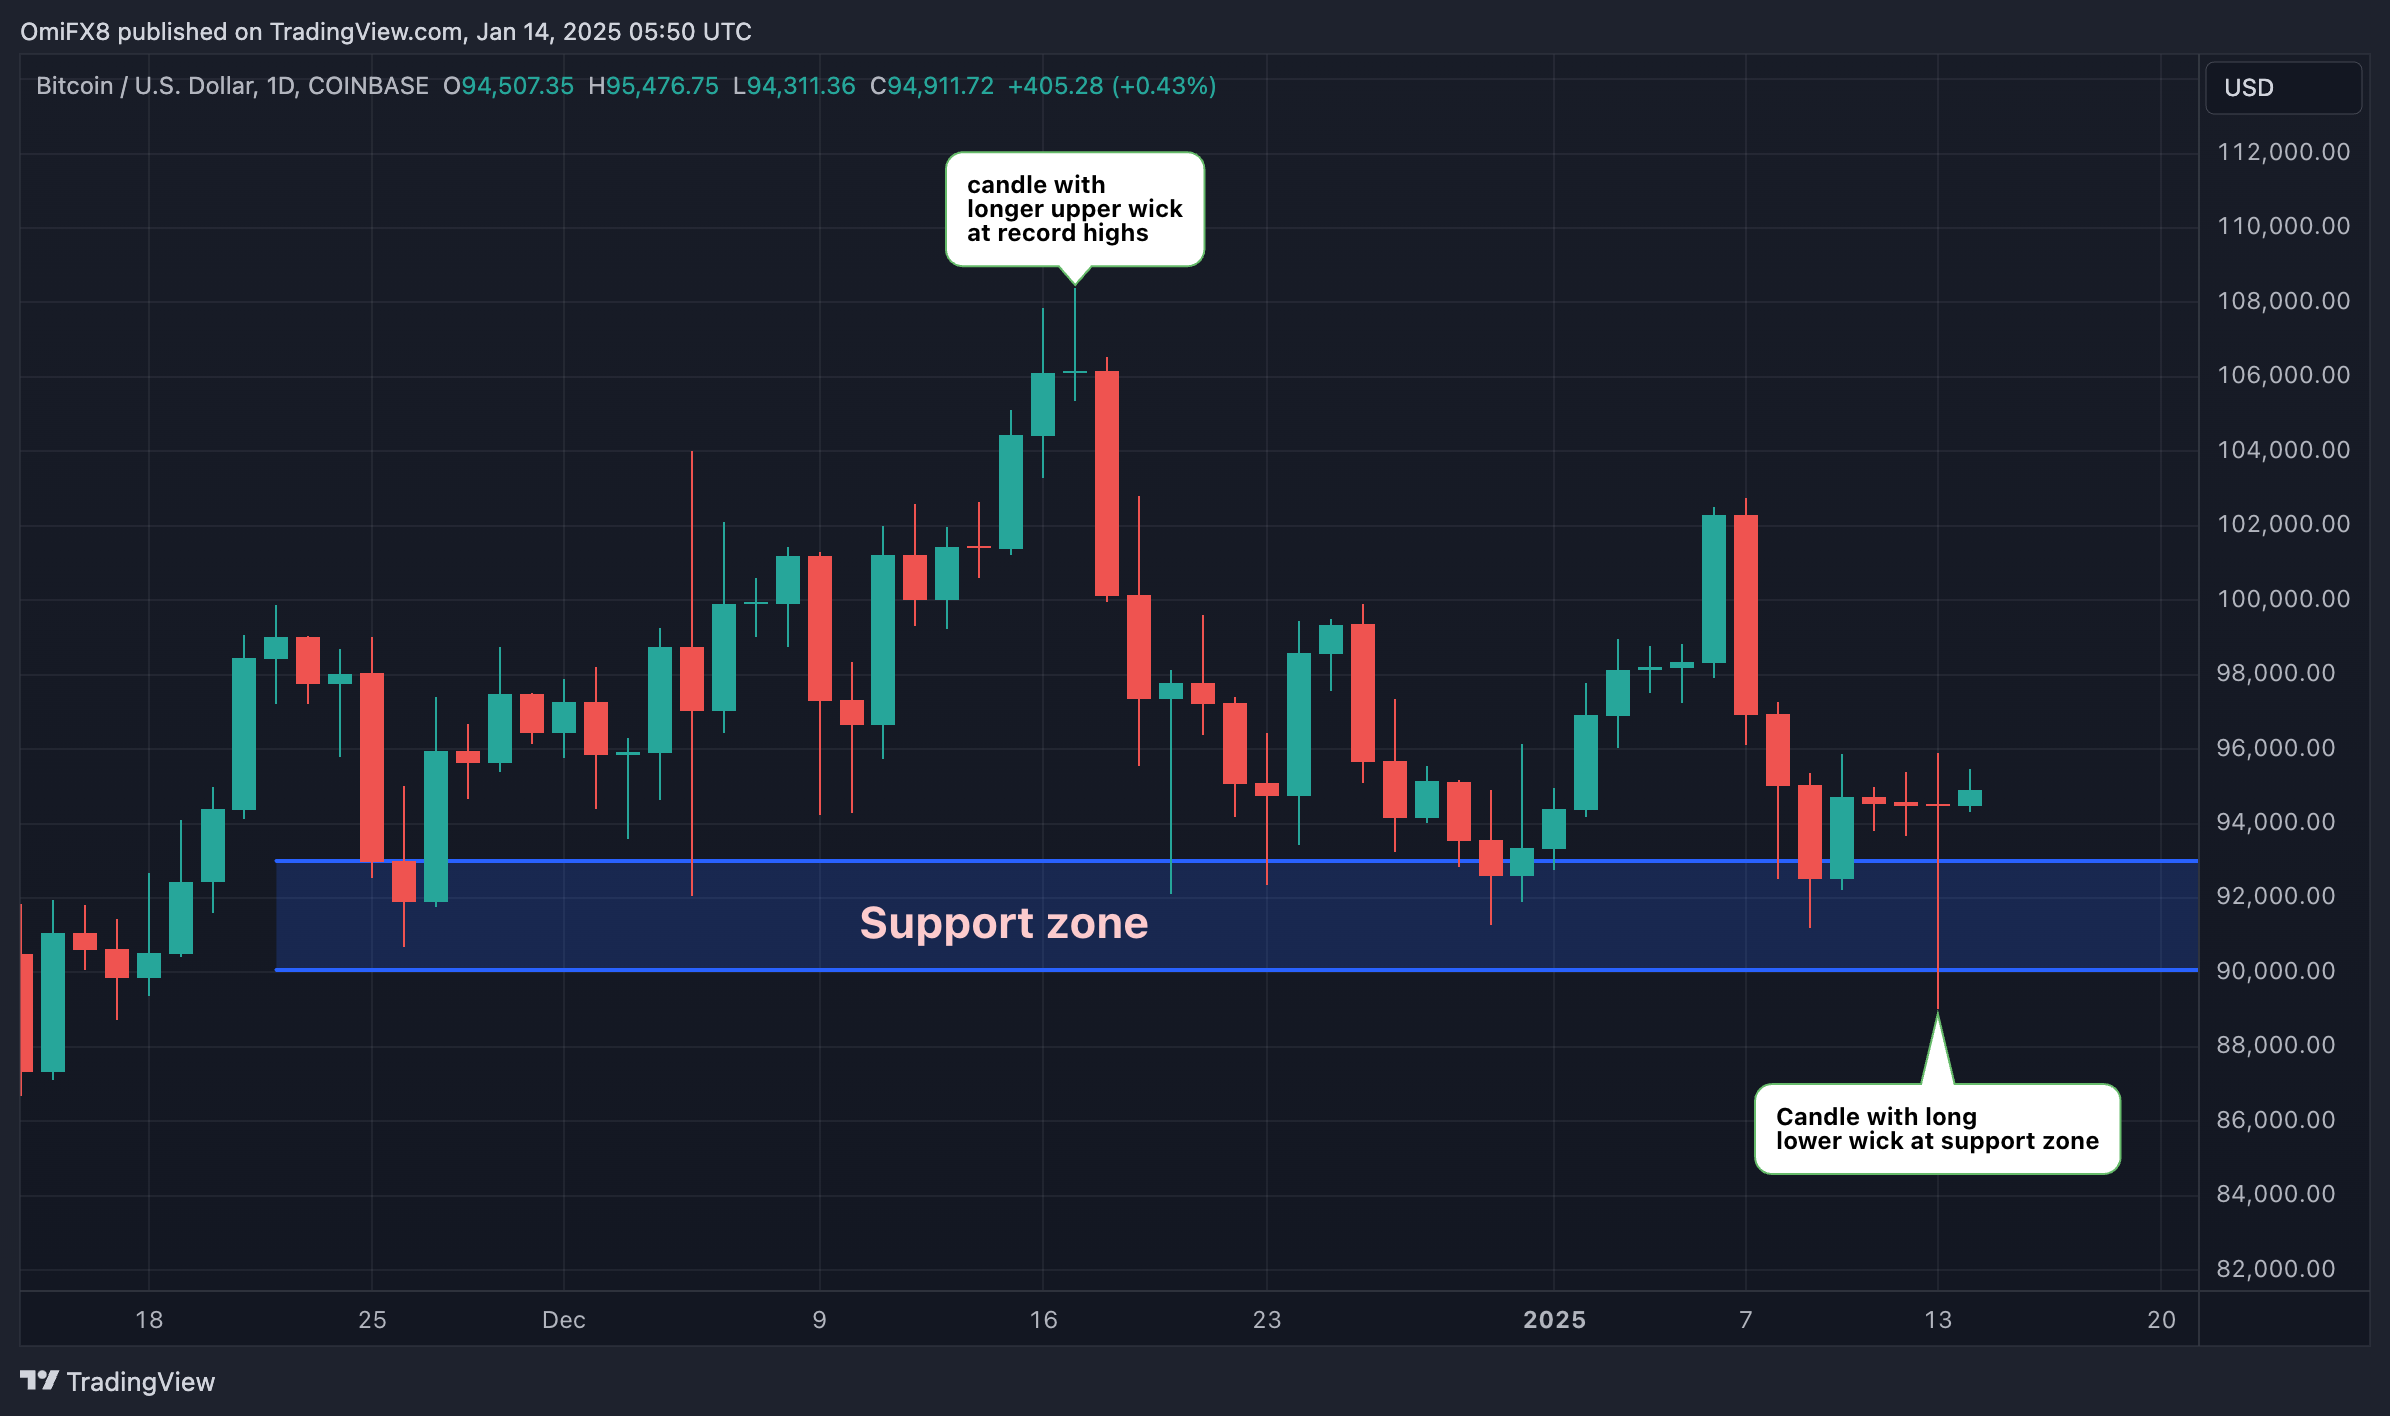
A long-bodied doji is now appearing at a horizontal area, which has been serving as a reliable barrier against price drops since late November.
On December 16th, I observed a reversal of sorts when the bulls couldn’t sustain prices above $108,000 at record highs, resulting in a doji candle with a longer upper shadow. This was indicative of the upward momentum starting to dwindle, potentially signaling that sellers were preparing to regain control.
What next?
On Monday, the price trend seems to indicate a possible floor, but for certainty, we need a clear break above the daily peak of $95,900.
Directional traders who rely on charts tend to delay their new buy orders until they see a suitable opportunity. On the other hand, the bearish sentiment may find it challenging to push prices below the previous low of around $89,000, established on Monday.
It’s worth mentioning that the balance between demand and supply for Bitcoin remains tilted towards a bullish trend. As per Bitwise’s Head of Research – Europe, Andre Dragosch, the demand from corporations for Bitcoin has surpassed the production of new coins this year.
The potential for price fluctuations to increase might stem from the recent U.S. CPI report released on Wednesday, potentially altering assumptions about possible Federal Reserve interest rate reductions.
Following a steep decline on Monday, Bitcoin bounced back from a low of $89,000, as investors prepare for the U.S. Consumer Price Index (CPI) report due on January 15th. Notably, most other major cryptocurrencies also mirrored this trend, with several experiencing further losses over the past 24 hours, according to Neal Wen, head of global business development at Kronos Research speaking to CoinDesk.
According to Wen, market analysts are currently looking for indications of stability, hoping to determine if there will be more drops or gains in the market.
Read More
- INJ PREDICTION. INJ cryptocurrency
- SPELL PREDICTION. SPELL cryptocurrency
- How To Travel Between Maps In Kingdom Come: Deliverance 2
- LDO PREDICTION. LDO cryptocurrency
- The Hilarious Truth Behind FIFA’s ‘Fake’ Pack Luck: Zwe’s Epic Journey
- How to Craft Reforged Radzig Kobyla’s Sword in Kingdom Come: Deliverance 2
- How to find the Medicine Book and cure Thomas in Kingdom Come: Deliverance 2
- Destiny 2: Countdown to Episode Heresy’s End & Community Reactions
- Deep Rock Galactic: Painful Missions That Will Test Your Skills
- When will Sonic the Hedgehog 3 be on Paramount Plus?
2025-01-14 09:28