Inj Token Skyrockets! Is $20 Price the Next Big Joke? Find Out!
Ah, the Injective blockchain’s native token, INJ, has decided to put on a fireworks display. Currently lounging around $13.97, it wobbled with a 5.2% flair in the last 24 hours. Market cap? A humble $1.37 billion. Not bad for a coin that probably dreams of being relevant!
On June 10, this digital darling climbed over 5%, trading at around $13.60. Trading volume shot up by 13%, reaching a modest $115 million. Apparently, everyone is so excited they forgot to ask, “Why?”
But wait! The excitement isn’t just random. Asset manager Canary Capital filed a trust called “Canary Staked INJ ETF” in Delaware. Does this mean an ETF is imminent? Who knows! But it’s a step — like strutting confidently toward the edge of a cliff, thinking it’s a staircase.
BREAKING: CANARY STAKED $INJ ETF REGISTERED IN DELAWARE 🚨
— Injective 🥷 (@injective) June 9, 2025
This is reminiscent of 21Shares’ Injective ETP launched in Europe last year, a product so yield-boosting it might make your grandma’s savings look lazy by comparison. The whole idea? Automatic staking rewards. Because why not turn holding crypto into a full-time job?
Inj Price Outlook: Will It Actually Do Something?
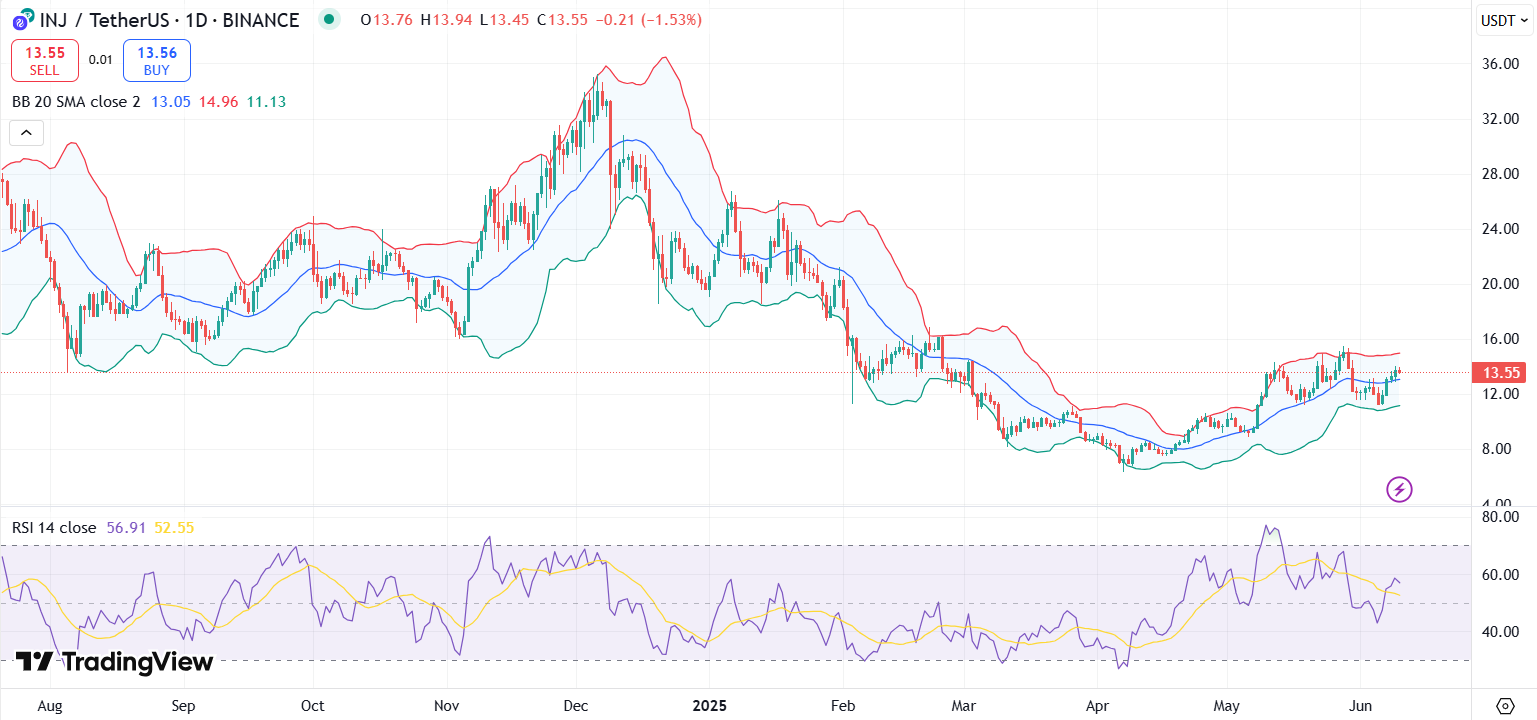
The Delaware filings could push INJ’s demand into the stratosphere—or merely tempt traders into a short-term carnival ride. The Bollinger Bands are squeezed tighter than a miser’s purse, with prices flirting around $13.55, hinting at a possible breakout, or just a moment of nervous tension.
The middle band (20-day SMA) sits comfortably at $13.05, acting like a safety net for the brave—if it holds, that is.
INJ price chart with RSI and Bollinger Bands | Source: Trading view
RSI? A breezy 57—so not too hot, not too cold. Just enough to suggest a modicum of bullish enthusiasm. Resistance levels? About $16 and that devilish $20 mark, which is basically the “we made it, or at least we’re dreaming” zone.
The MACD indicator is dancing happily above zero with a bullish crossover—a turning point, or just the market’s way of yanking your chain. If the volume matches, we might see a breakout or at least some fireworks.
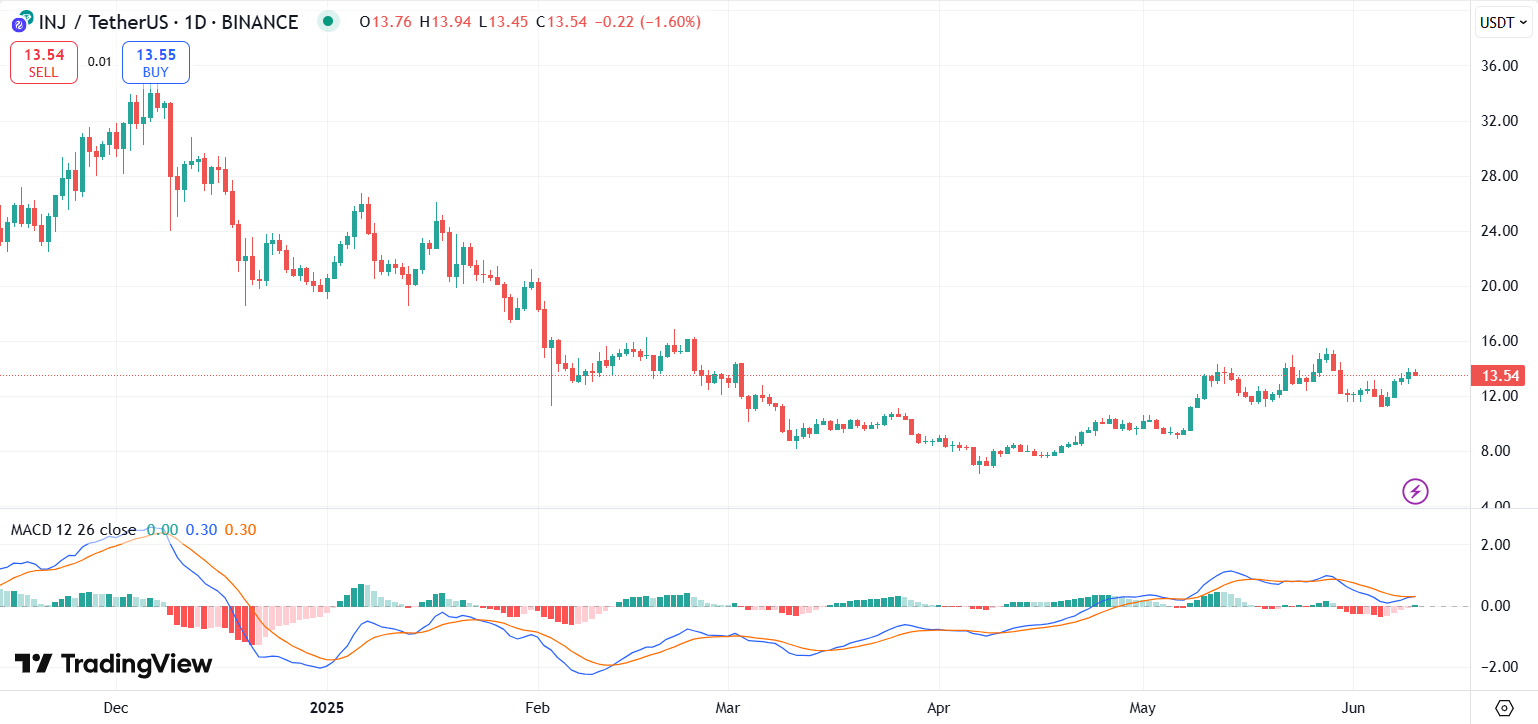
INJ price chart with MACD | Source: Trading view
But beware! A rejection at this stage could result in sideways yawns or even a nosedive. Support levels? $12 and $11.10, which are as stubborn as a mule on a hot summer day.
Crypto analyst Lennaert Snyder shared a 4-hour chart on X, pointing out that INJ has broken through the resistance of $13.02 and cheerfully retested it as support. Classic pattern, or just a lucky guess? That’s crypto for you—full of surprises and occasional déjà vu.
$INJ perfectly following the plan. 🔥
Broke resistance and flipped it into support.
Rangehigh is next and after that, the real party begins.
Bullish.
— Lennaert Snyder (@LennaertSnyder) June 9, 2025
Summary? Snyder believes this pattern could ignite a glorious breakout, with $20 as the shining beacon ahead. But first, the stubborn $15.22 resistance wall must come down—because in crypto, patience is a virtue, and resistance levels are just stubborn old men at a dance.
Read More
- Who Is Harley Wallace? The Heartbreaking Truth Behind Bring Her Back’s Dedication
- 50 Ankle Break & Score Sound ID Codes for Basketball Zero
- 50 Goal Sound ID Codes for Blue Lock Rivals
- KPop Demon Hunters: Real Ages Revealed?!
- 100 Most-Watched TV Series of 2024-25 Across Streaming, Broadcast and Cable: ‘Squid Game’ Leads This Season’s Rankers
- Ultimate AI Limit Beginner’s Guide [Best Stats, Gear, Weapons & More]
- Elden Ring Nightreign Enhanced Boss Arrives in Surprise Update
- Lottery apologizes after thousands mistakenly told they won millions
- Umamusume: Pretty Derby Support Card Tier List [Release]
- Mirren Star Legends Tier List [Global Release] (May 2025)
2025-06-10 20:17