The weekly chart is like a well-practiced dance – with every step higher, we see those lovely higher lows and higher highs. It’s as if buyers just can’t get enough of this altcoin. On the daily chart, the price is shimmying above major moving averages, like a ballerina with only the 200-day EMA left to impress. Analysts are practically holding their breath, watching as the price tiptoes closer to this critical resistance. If it breaks above, brace yourself – we could be in for a wild ride! 🚀
CRG’s observation? Well, the token’s trying to break through the 200 EMA while confidently strutting above the reclaimed quarterly value area. That’s solid support, folks! The market’s not just holding its ground, it’s accumulating. Call it the calm before the storm, if you will. ⛈️
Weekly Trend: Stronger Than Your Morning Coffee
This asset’s weekly chart doesn’t just scream “buy” – it shouts it from the rooftops. Higher lows, higher highs – if this were a popularity contest, this altcoin would be at the top of the leaderboard. The market’s in an upward momentum, so despite some little pauses along the way (because, hey, even markets need a coffee break), buying interest is still solid.
On the daily chart, the coin’s cruising comfortably above most moving averages, like it’s taking a stroll through a pleasant neighborhood. But the 200 EMA? That’s the last big hurdle. Once it clears that, we might see a price explosion. 💥
Quarterly Value Zone: A Test of Patience
CRG’s been watching closely. The token’s reclaimed and tested the quarterly value area, which is like the market’s own version of an emotional support cushion. When price dips down and then bounces up, it signals that demand is still strong around this area. It’s like a secret handshake – the market knows what it’s doing, and it’s showing us that support levels are still holding firm. 💪
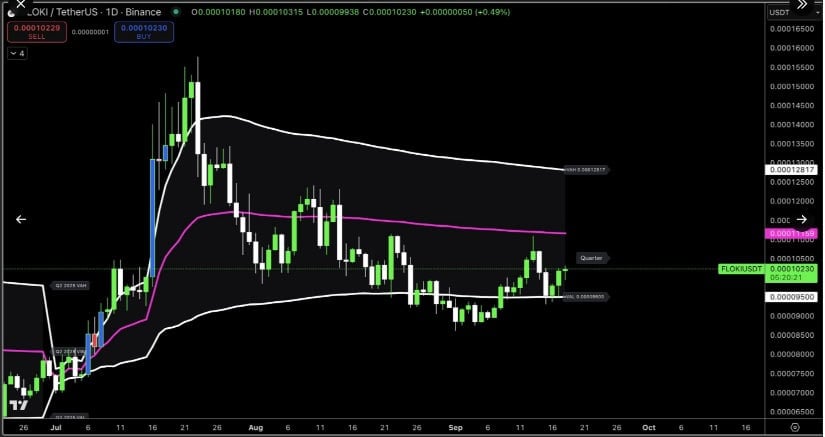
Staying above this zone is a sign of a steady foundation. Traders look at this kind of retest and nod appreciatively – “Yep, that’s a good sign.” After all, if resistance turns into support, it’s like a game changer in Monopoly when you land on Boardwalk with a hotel. 🏨
Accumulation & Breakouts: Hold On to Your Hats!
Inmortal’s 12-hour chart brings a lot of excitement to the table. With consistent bounces off the $0.000090 level, this token’s been like a boxer, taking punches and then bouncing right back. It’s as if buyers are playing a game of “catch me if you can” with sellers. The market is doing its best impression of a snake – coiling up, getting ready to strike. 🐍
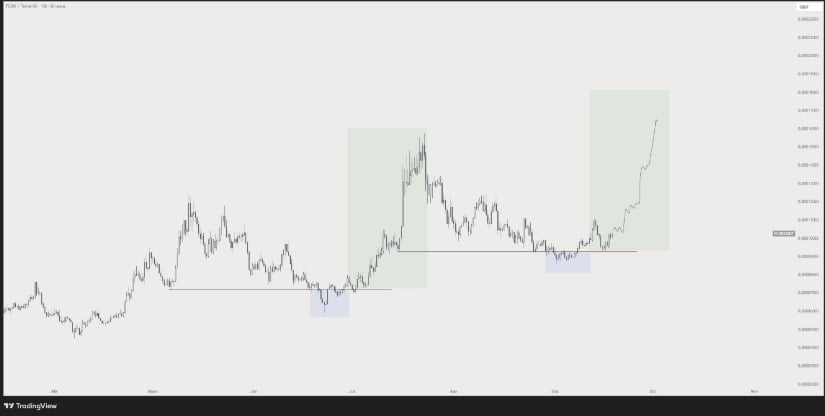
If this altcoin breaks through its current resistance, the $0.00017-$0.00018 range could be within reach. Think of it as climbing a ladder – once you get past that first shaky step, the view from the top is incredible. 🌄
Market Participation: Don’t Call it a Comeback
At the moment, the altcoin is trading around $0.0001027, and it’s giving us a 0.74% boost over the last 24 hours. Trading volume is pushing around $84.4 million, and the market capitalization is almost at a cool $1 billion. You’ve got an active market, plenty of buyers, and sellers – it’s like a crowded dance floor, and everyone’s having a great time. 💃
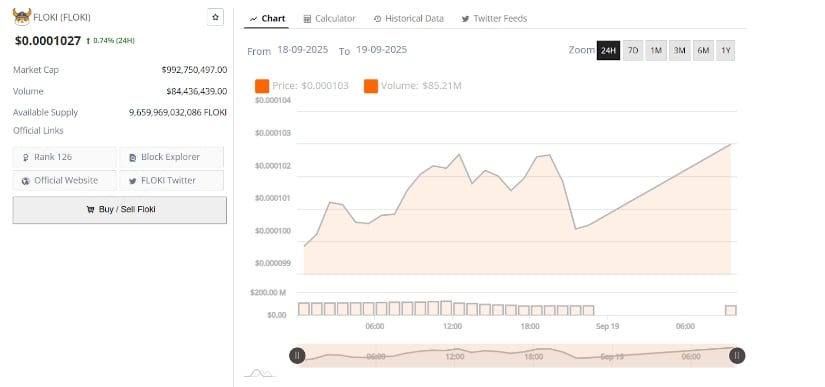
In terms of short-term price action, we’re seeing those quick advances, followed by brief pauses – like someone taking a breather after running a marathon. The price just crossed $0.000103 before taking a small step back, but don’t be fooled – demand is still high. If momentum keeps up and that pesky 200 EMA is breached, we could see even higher gains soon.
Read More
- United Airlines can now kick passengers off flights and ban them for not using headphones
- How to Complete Bloom of Tranquility Challenge in Infinity Nikki
- Katanire’s Yae Miko Cosplay: Genshin Impact Masterpiece
- Gold Rate Forecast
- All Itzaland Animal Locations in Infinity Nikki
- A Dark Scream Theory Rewrites the Only Movie to Break the 2-Killer Rule
- How to Get to the Undercoast in Esoteric Ebb
- 8 Actors Who Could Play Blackbeard In One Piece Live-Action Season 3
- Australia’s New Crypto Law: Can They Really Catch the Bad Guys? 😂
- Fire Force Season 3 Part 2 Episode 24 Release Date, Time, Where to Watch
2025-09-20 00:11