Hold onto your wallets, folks! The market’s been doing the cha-cha with volatility, but guess what? Structural patterns and volume data are waving their hands, saying, “Hey, we might just be getting ready for a party if those pesky resistance levels decide to take a hike!” 💃🕺
With indicators showing signs of compression and consolidation, traders are glued to their screens, waiting for a breakout that could send FLOKI soaring to its next big target of $0.00008900. Grab your popcorn! 🍿
Double Bottom Formation Shows Key Reversal Signal
Our buddy, Analyst Crypto Joe, just dropped an hourly chart on X that reveals a double bottom formation near $0.00007400. This pattern is like the superhero of bullish reversals, confirmed by two consecutive troughs we affectionately call “Bottom 1” and “Bottom 2.” Sounds like a buddy cop movie, right? 🎬
The neckline of this structure was hanging out near $0.00008200, and although FLOKI tried to break above this level, it tripped and fell back to $0.00007770. Current consolidation around this area suggests a retest phase, which is just standard double bottom behavior—like a sitcom that keeps getting renewed! 📺
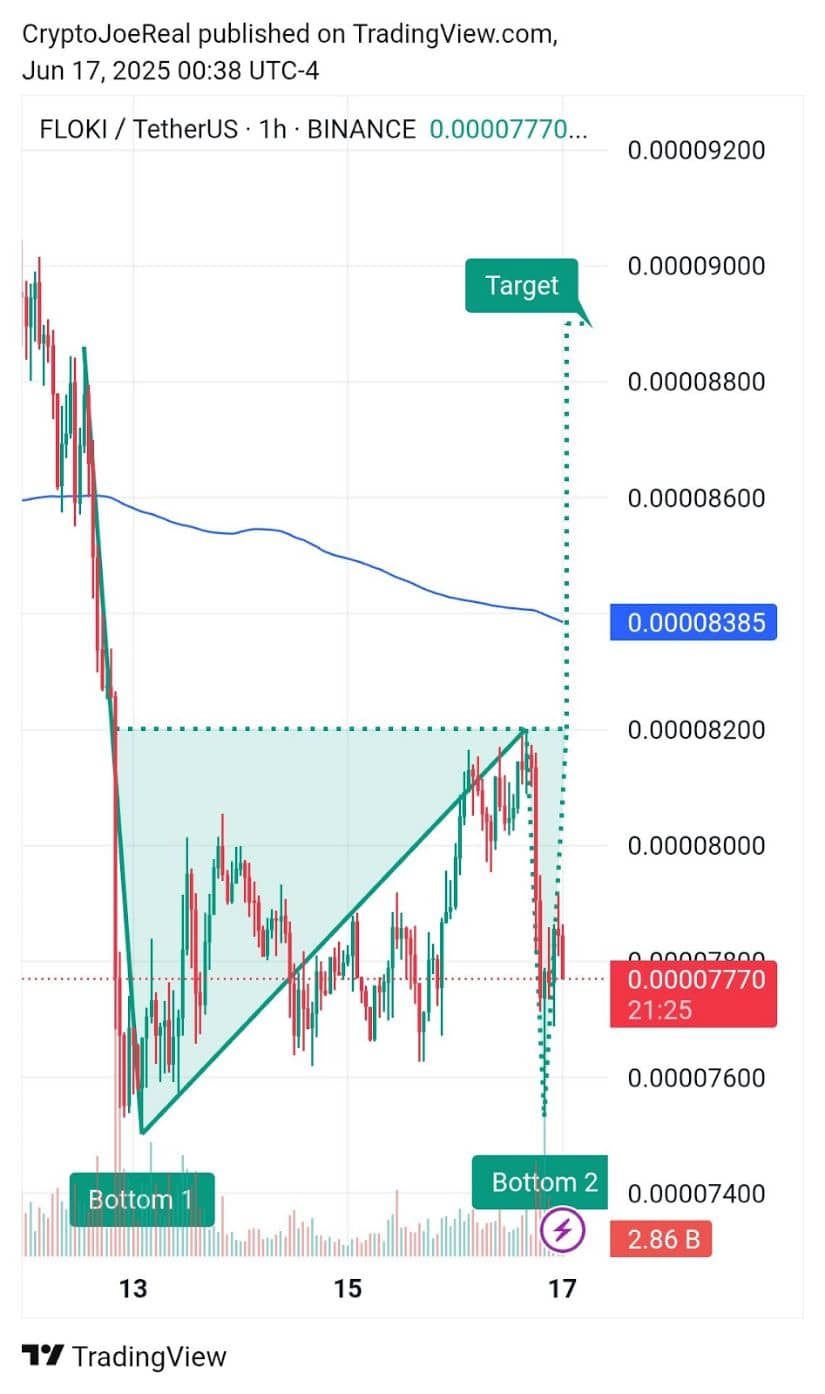
Despite the retracement, the double bottom structure is still standing strong, as long as the price doesn’t decide to take a nosedive below the previous lows. The breakout attempt was backed by a noticeable increase in trading volume—because who doesn’t love a good party? 🎉
Crypto Joe is projecting a bullish target of $0.00008900 based on the measured move from the base to the neckline of the formation. Traders are keeping an eye on the 200 EMA, which is chilling at around $0.00008385, for signs of renewed strength. If the price decides to reclaim this level, it could be the confirmation we’ve all been waiting for! 🚀
Floki Price Prediction: Price Action and Ecosystem Strength Support Recovery Possibility
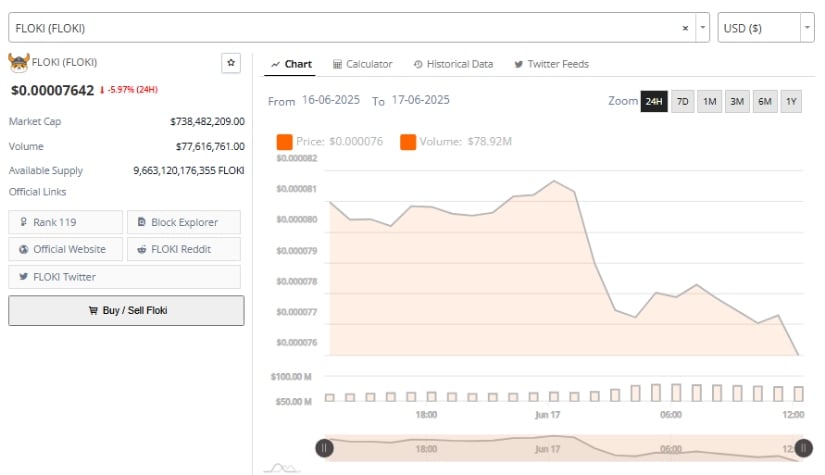
Floki’s recent 24-hour chart shows a modest decline of 5.97%, with the price stabilizing around $0.00007642. The decline has been accompanied by fading volume, suggesting that selling pressure might be losing its grip. It’s like watching a balloon slowly deflate—sad but fascinating! 🎈
Brave New Coin data puts FLOKI’s current market cap at a whopping $738.48 million, with a 24-hour trading volume of $77.62 million. These figures show that interest is still alive and kicking, despite the short-term rollercoaster! 🎢
Beyond price action, FLOKI’s ecosystem is like the secret sauce keeping investor confidence alive. Key components like the Valhalla metaverse game, Floki University, and DeFi integrations are adding to its charm. These fundamentals provide an extra layer of support, especially when the market is in a contemplative mood. 🧙♂️
Technically, the asset is showing signs of a potential base-building phase. The decline in volume, paired with horizontal price action, hints at an equilibrium zone where buyers might start to regain control. If the price breaches the $0.000080 mark again, it could lead to a renewed push toward those resistance zones that were previously rejected—like a bad date that keeps calling! 📞
Daily Indicators Suggest Imminent Shift in Momentum
The FLOKI/USDT daily chart shows that the price is currently consolidating near the lower band of the Bollinger Bands at around $0.00007209. This position typically indicates an oversold condition, increasing the potential for a near-term rebound. It’s like a rubber band just waiting to snap back! 🏹
The contraction in the Bollinger Bands also signals reduced volatility, a common precursor to a breakout in either direction. This compression phase, combined with price stabilization, is being interpreted as a potential setup for renewed upward activity. Get ready for the fireworks! 🎆
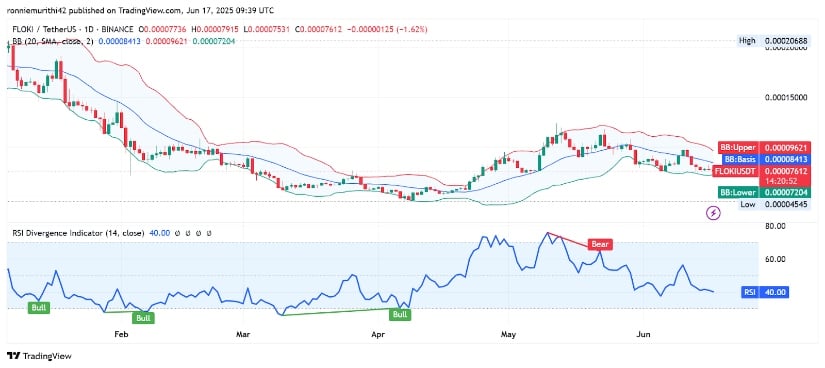
Momentum indicators are adding further insights. The Relative Strength Index (RSI) currently sits at 40.22, approaching the lower boundary of the neutral zone. Though not yet in oversold territory, it suggests that FLOKI still has room to move lower but is nearing a level where reversals have historically occurred. It’s like waiting for the perfect moment to jump into a pool! 🏊♂️
Previous bullish divergences on the RSI have been followed by sharp upward movements. Right now, the RSI is steady despite the recent price drop, indicating that downward momentum may be slowing. If the RSI starts to rise and FLOKI pushes above the middle Bollinger Band around $0.00008414, this could serve as a confirmation of renewed strength. From there, the upper Bollinger Band at $0.00009619 becomes the next potential area of interest. Combined with the existing chart structure and ecosystem support, these signals suggest that while caution remains necessary, FLOKI could be gearing up for a recovery attempt toward the $0.00008900 level. Buckle up! 🎢
Read More
- Who Is Harley Wallace? The Heartbreaking Truth Behind Bring Her Back’s Dedication
- 50 Ankle Break & Score Sound ID Codes for Basketball Zero
- Lost Sword Tier List & Reroll Guide [RELEASE]
- 50 Goal Sound ID Codes for Blue Lock Rivals
- KPop Demon Hunters: Real Ages Revealed?!
- Basketball Zero Boombox & Music ID Codes – Roblox
- Umamusume: Pretty Derby Support Card Tier List [Release]
- 100 Most-Watched TV Series of 2024-25 Across Streaming, Broadcast and Cable: ‘Squid Game’ Leads This Season’s Rankers
- The best Easter eggs in Jurassic World Rebirth, including callbacks to Jurassic Park
- League of Legends MSI 2025: Full schedule, qualified teams & more
2025-06-17 22:04