After falling below its 100-day moving average, Ethereum‘s price trends suggest a downturn, highlighting an increase in the number of sellers.
Nevertheless, the 200-day Moving Average continues to stand firm as a barrier for sellers, suggesting a possibility of future recovery.
Technical Analysis
By Shayan
The Daily Chart
Recently, ETH dipped below its crucial 100-day Moving Average at around $3.1K, indicating that sellers have been gaining more control. This dip suggests that the $3K support area, which also coincides with the 200-day Moving Average, might be tested next. This is a significant crossroad that could provide important insights.
As I observe the current market landscape, it appears Ethereum is momentarily finding some resistance at this point, yet there’s a subtle indication of bullish sentiment emerging, suggesting that buyers are eager to step in. The 200-day Moving Average stands as a crucial barrier for the bulls, and whether they can maintain their ground here will significantly influence our short-term outlook. A potential breach below this level could spark a more extended bearish trend, with the $2.5K area serving as a key support zone to watch.
The 4-Hour Chart
On the 4-hour chart, Ethereum (ETH) temporarily halted its progress and gathered strength around the 0.5 Fibonacci resistance point ($3.2K). However, selling pressure soon overpowered the market, causing ETH to plummet below this significant support level. This downward momentum led to a series of long position closures, pushing the price towards the 0.618 Fibonacci retracement level at $3K.
This region is pivotal, as it represents the last major support zone for buyers. A sustained breach below this level could lead to a cascade of liquidations, driving the price toward the $2.5K target. However, Ethereum appears to be consolidating around this juncture, with a potential battle between buyers and sellers unfolding.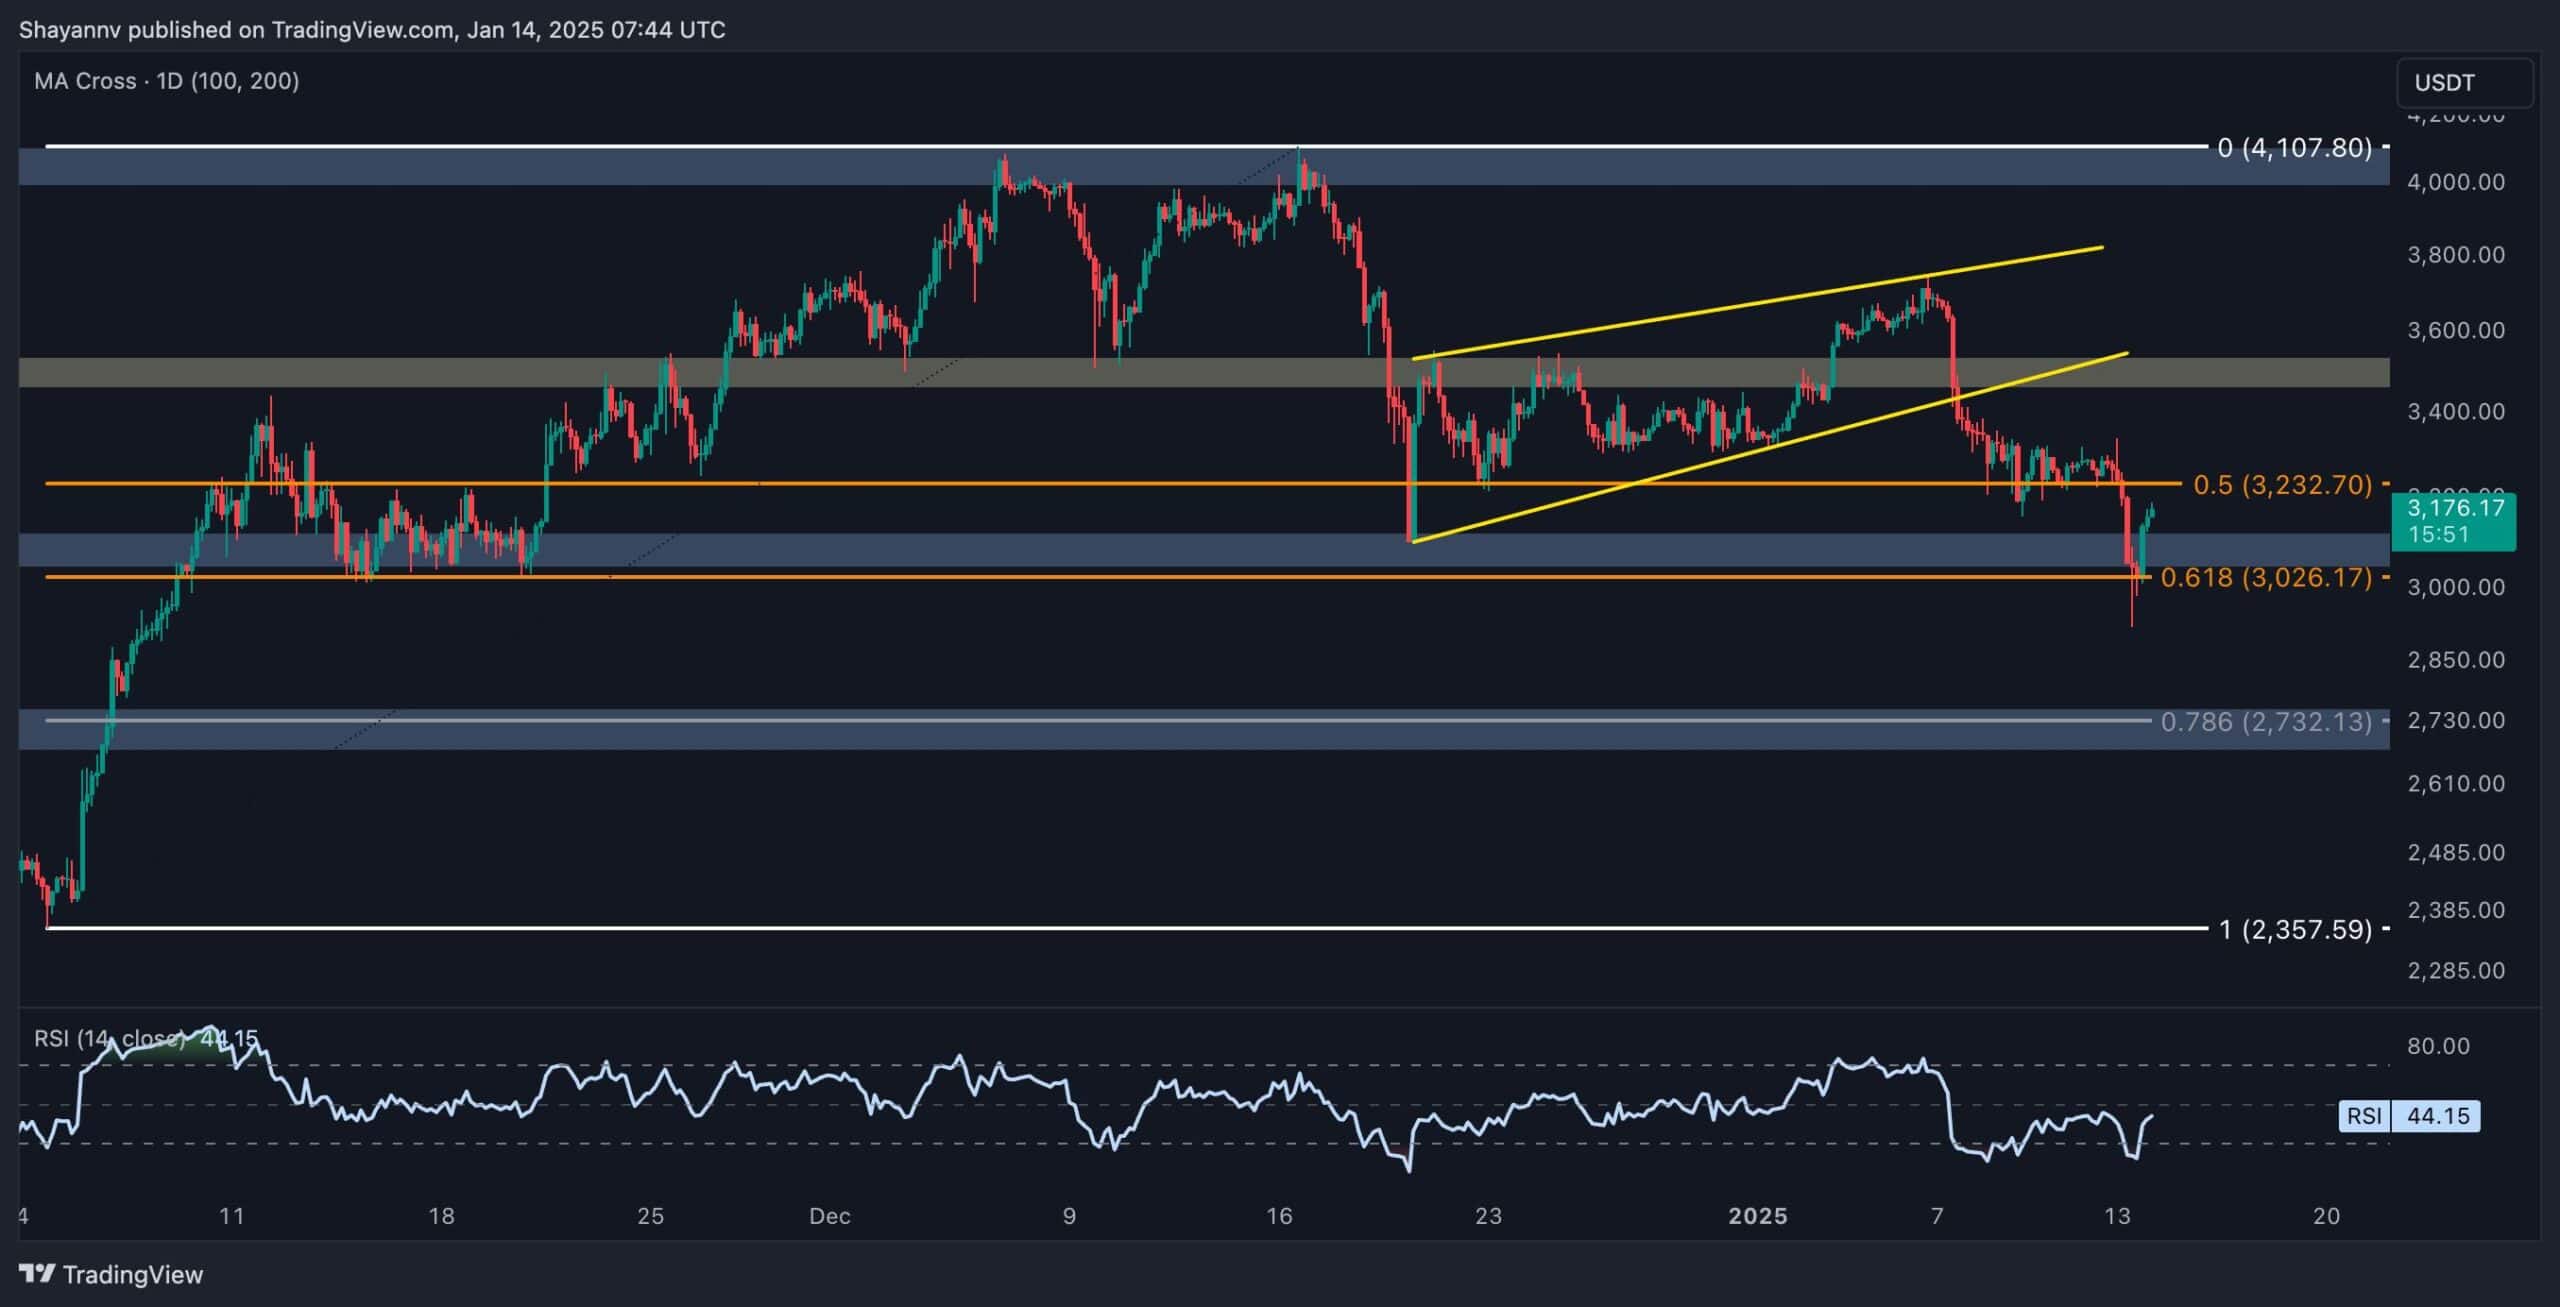
Onchain Analysis
By Shayan
On Ethereum, the crucial $3,000 support level is being put to the test as traders attempting to sell are applying force in an effort to regain dominance. By examining the Taker Buy Sell Ratio, we can gather some clues about market feelings and possible future trends.
As the price hit the $3K support level, the Buyer-Seller Ratio initially spiked up, showing stronger buying forces and defensive actions from buyers. But this rise didn’t last long as it was followed by a quick sell-off, which also marked a bearish turn in the metric. Since then, there’s been a continuous drop in the ratio, indicating that sellers are gaining more control over the market.
If this trend persists, the likelihood of a breakdown below the $3K threshold increases. Such a scenario would likely lead to heightened selling activity, pushing ETH toward the $2.5K support level. Conversely, a reversal in the ratio could indicate renewed buyer interest, stabilizing the price at this critical juncture.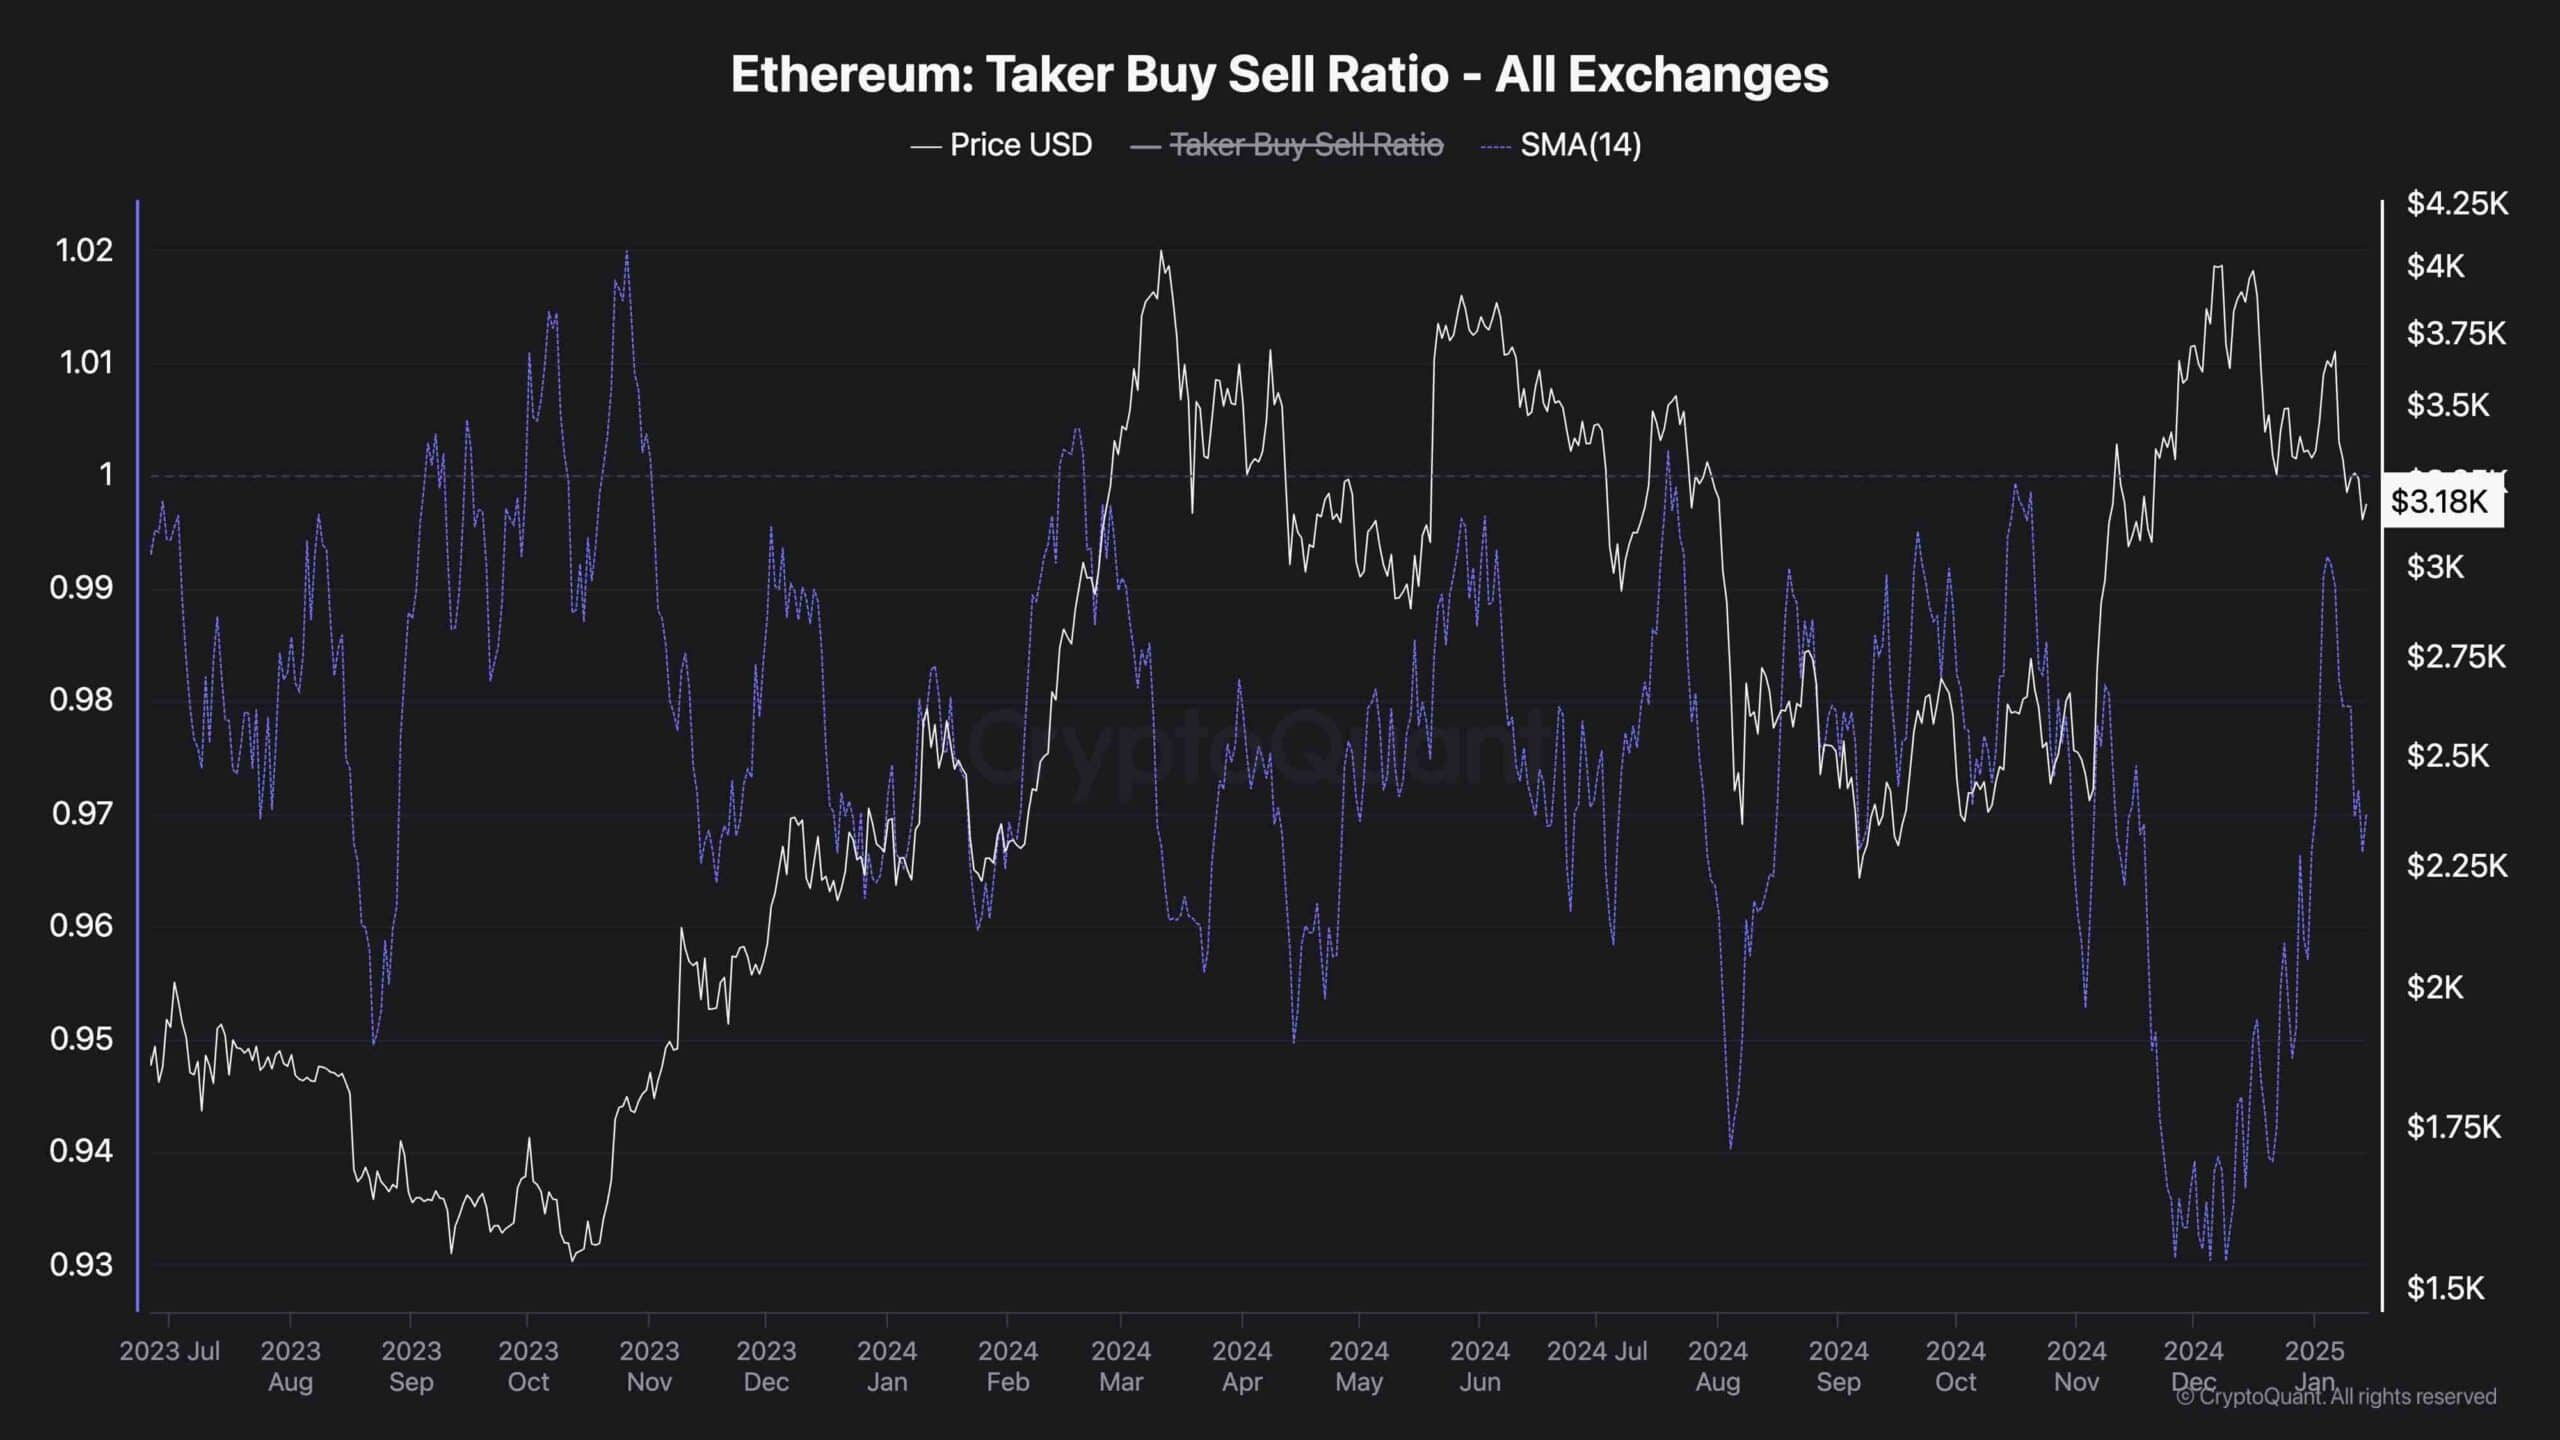
Read More
- INJ PREDICTION. INJ cryptocurrency
- SPELL PREDICTION. SPELL cryptocurrency
- How To Travel Between Maps In Kingdom Come: Deliverance 2
- LDO PREDICTION. LDO cryptocurrency
- The Hilarious Truth Behind FIFA’s ‘Fake’ Pack Luck: Zwe’s Epic Journey
- How to Craft Reforged Radzig Kobyla’s Sword in Kingdom Come: Deliverance 2
- How to find the Medicine Book and cure Thomas in Kingdom Come: Deliverance 2
- Destiny 2: Countdown to Episode Heresy’s End & Community Reactions
- Deep Rock Galactic: Painful Missions That Will Test Your Skills
- When will Sonic the Hedgehog 3 be on Paramount Plus?
2025-01-14 16:46