Right then, let’s have a gander at Bitcoin. 🧐Over the last hour, it’s been gallivanting about in a rather restricted area, somewhere between $83,524 and $84,156. A bit like a poodle on a short leash, if you ask me. With a market cap of $1.66 trillion (a sum that would make even Croesus blush) and a 24-hour trading volume of $25.66 billion, the dear chap has been bouncing between $83,219 and $86,186. Quite the lively fellow, isn’t it?
Bitcoin
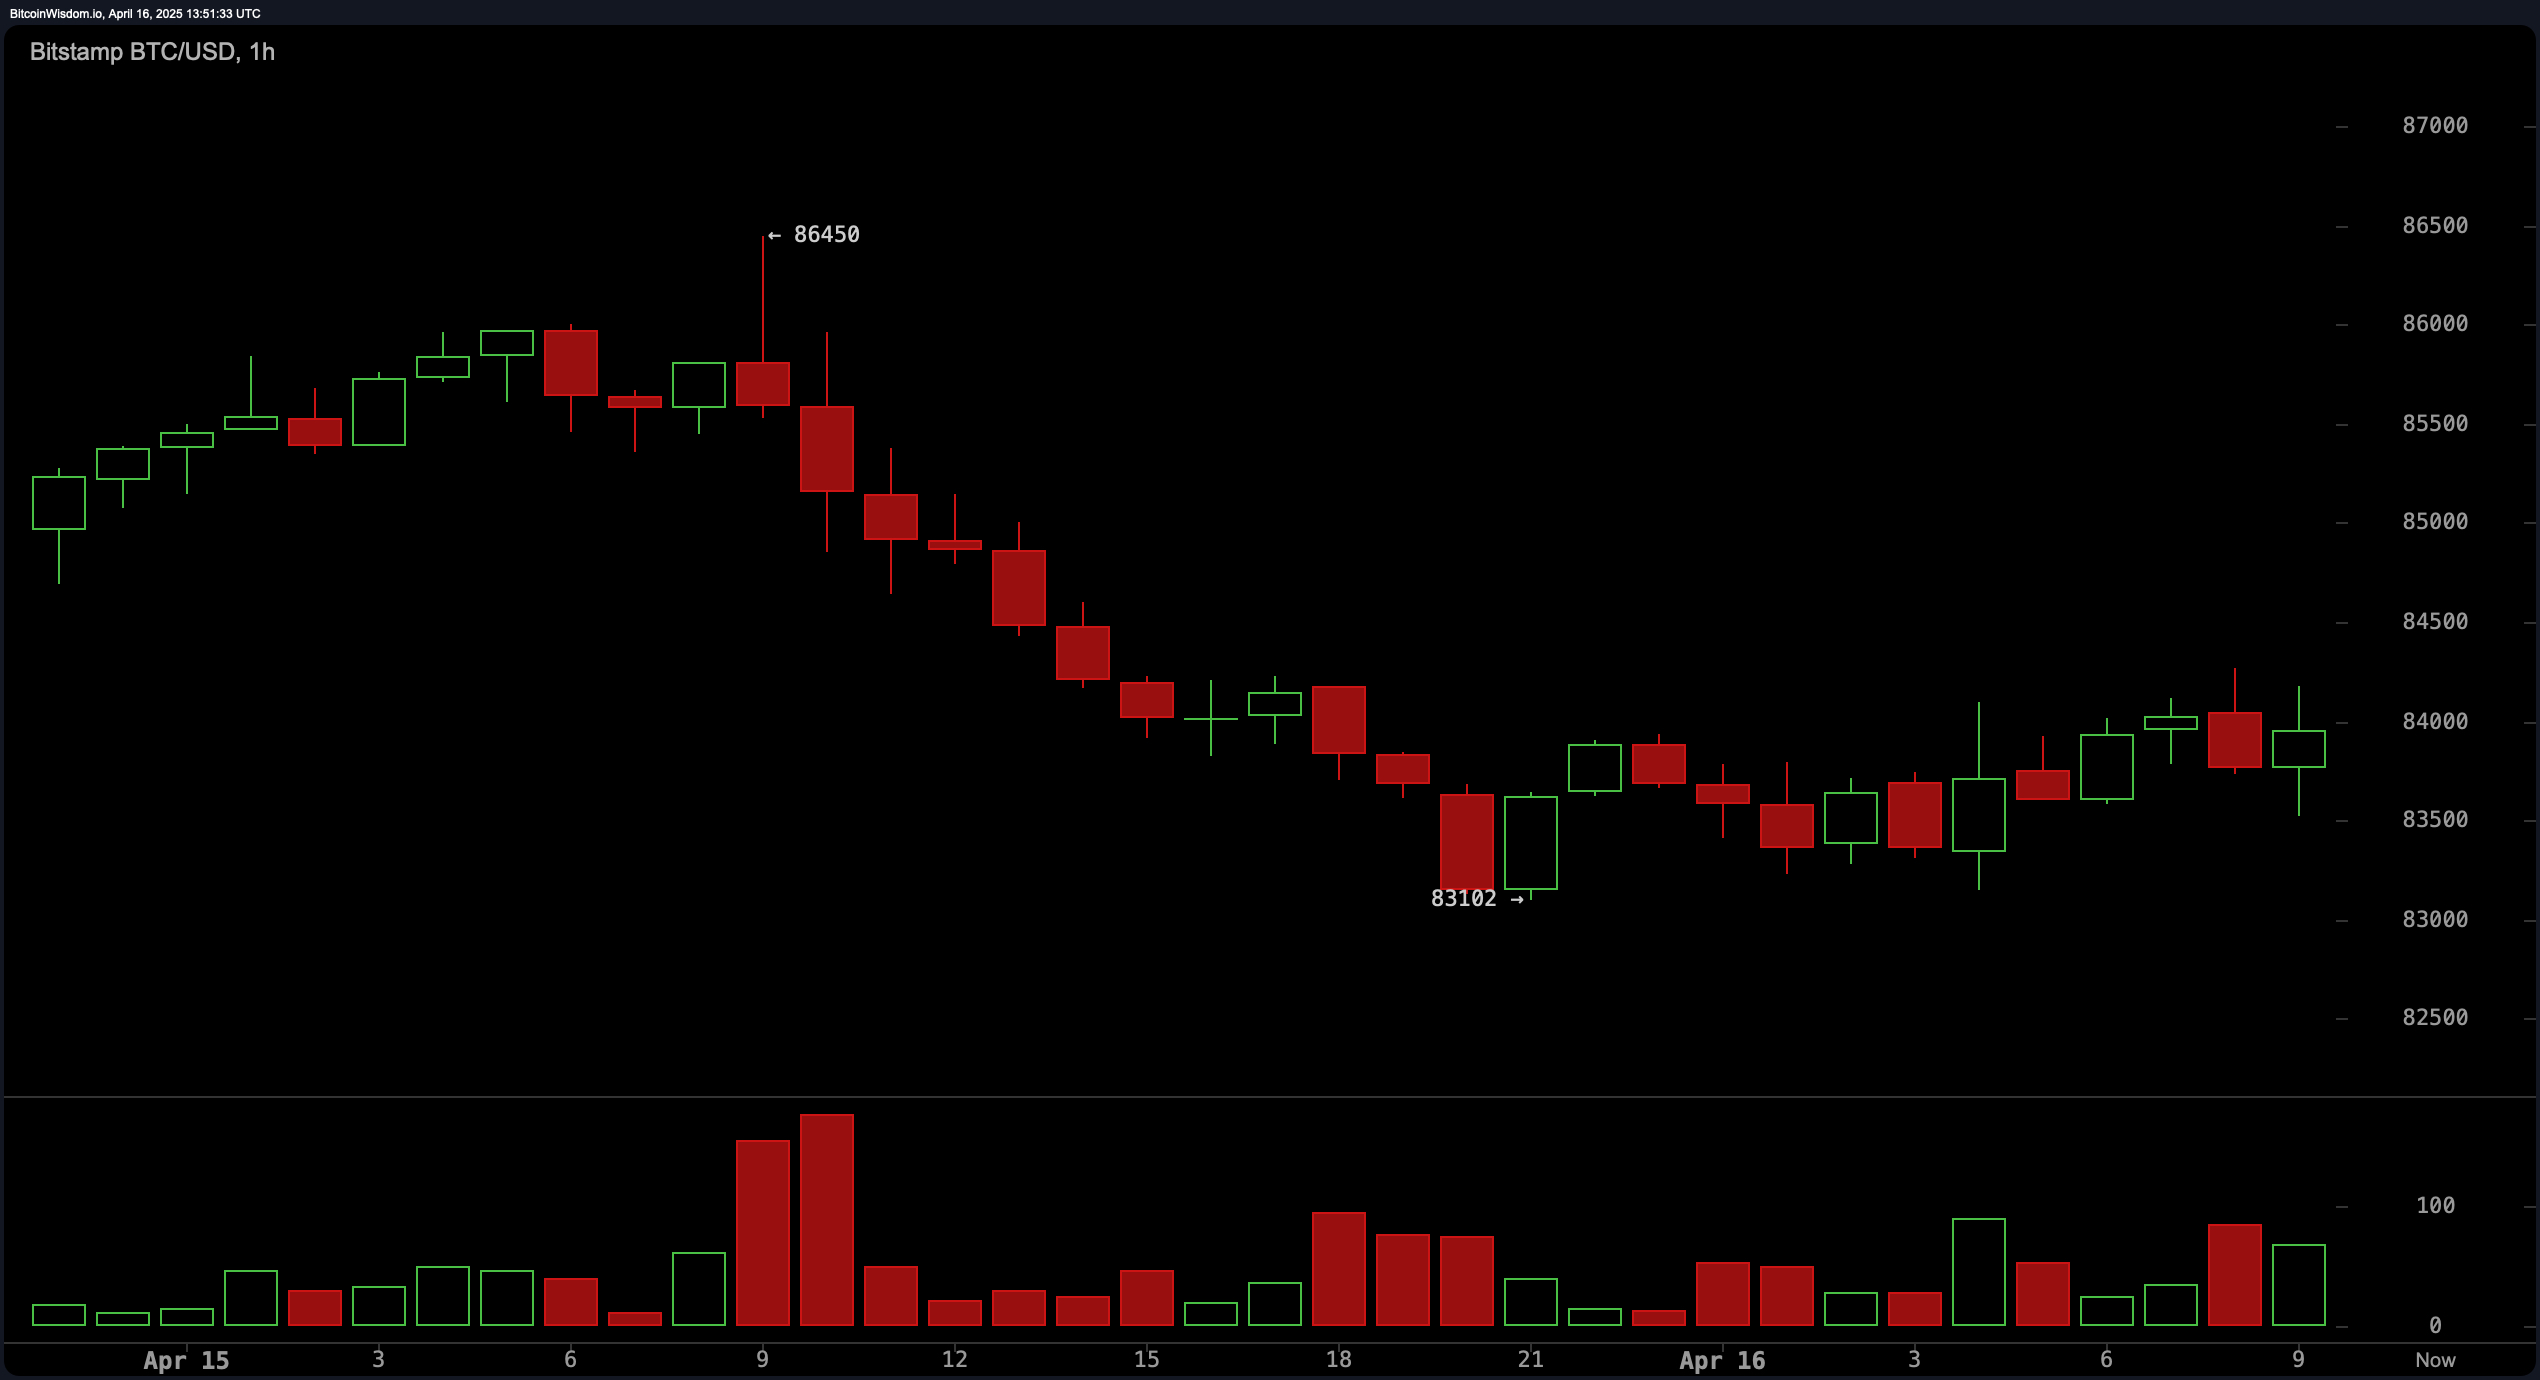
The one-hour chart suggests a bit of a pickle. Bitcoin, you see, has been stuck in a rut between $83,000 and $84,000, showing a feeble attempt to recover after a tumble to a rather undignified $83,102. Though this “double bottom pattern” sounds promising, the current state of affairs still resembles a series of lower lows – a clear indication of a short-term downtrend. For those who dabble in intraday trading, a breakout above $84,000, accompanied by a hearty volume, would signal a bullish reversal, with targets around $85,500. However, a drop below $83,000 could send it spiraling down towards $81,500, indicating renewed bearish strength. Oh, the drama! 🎭
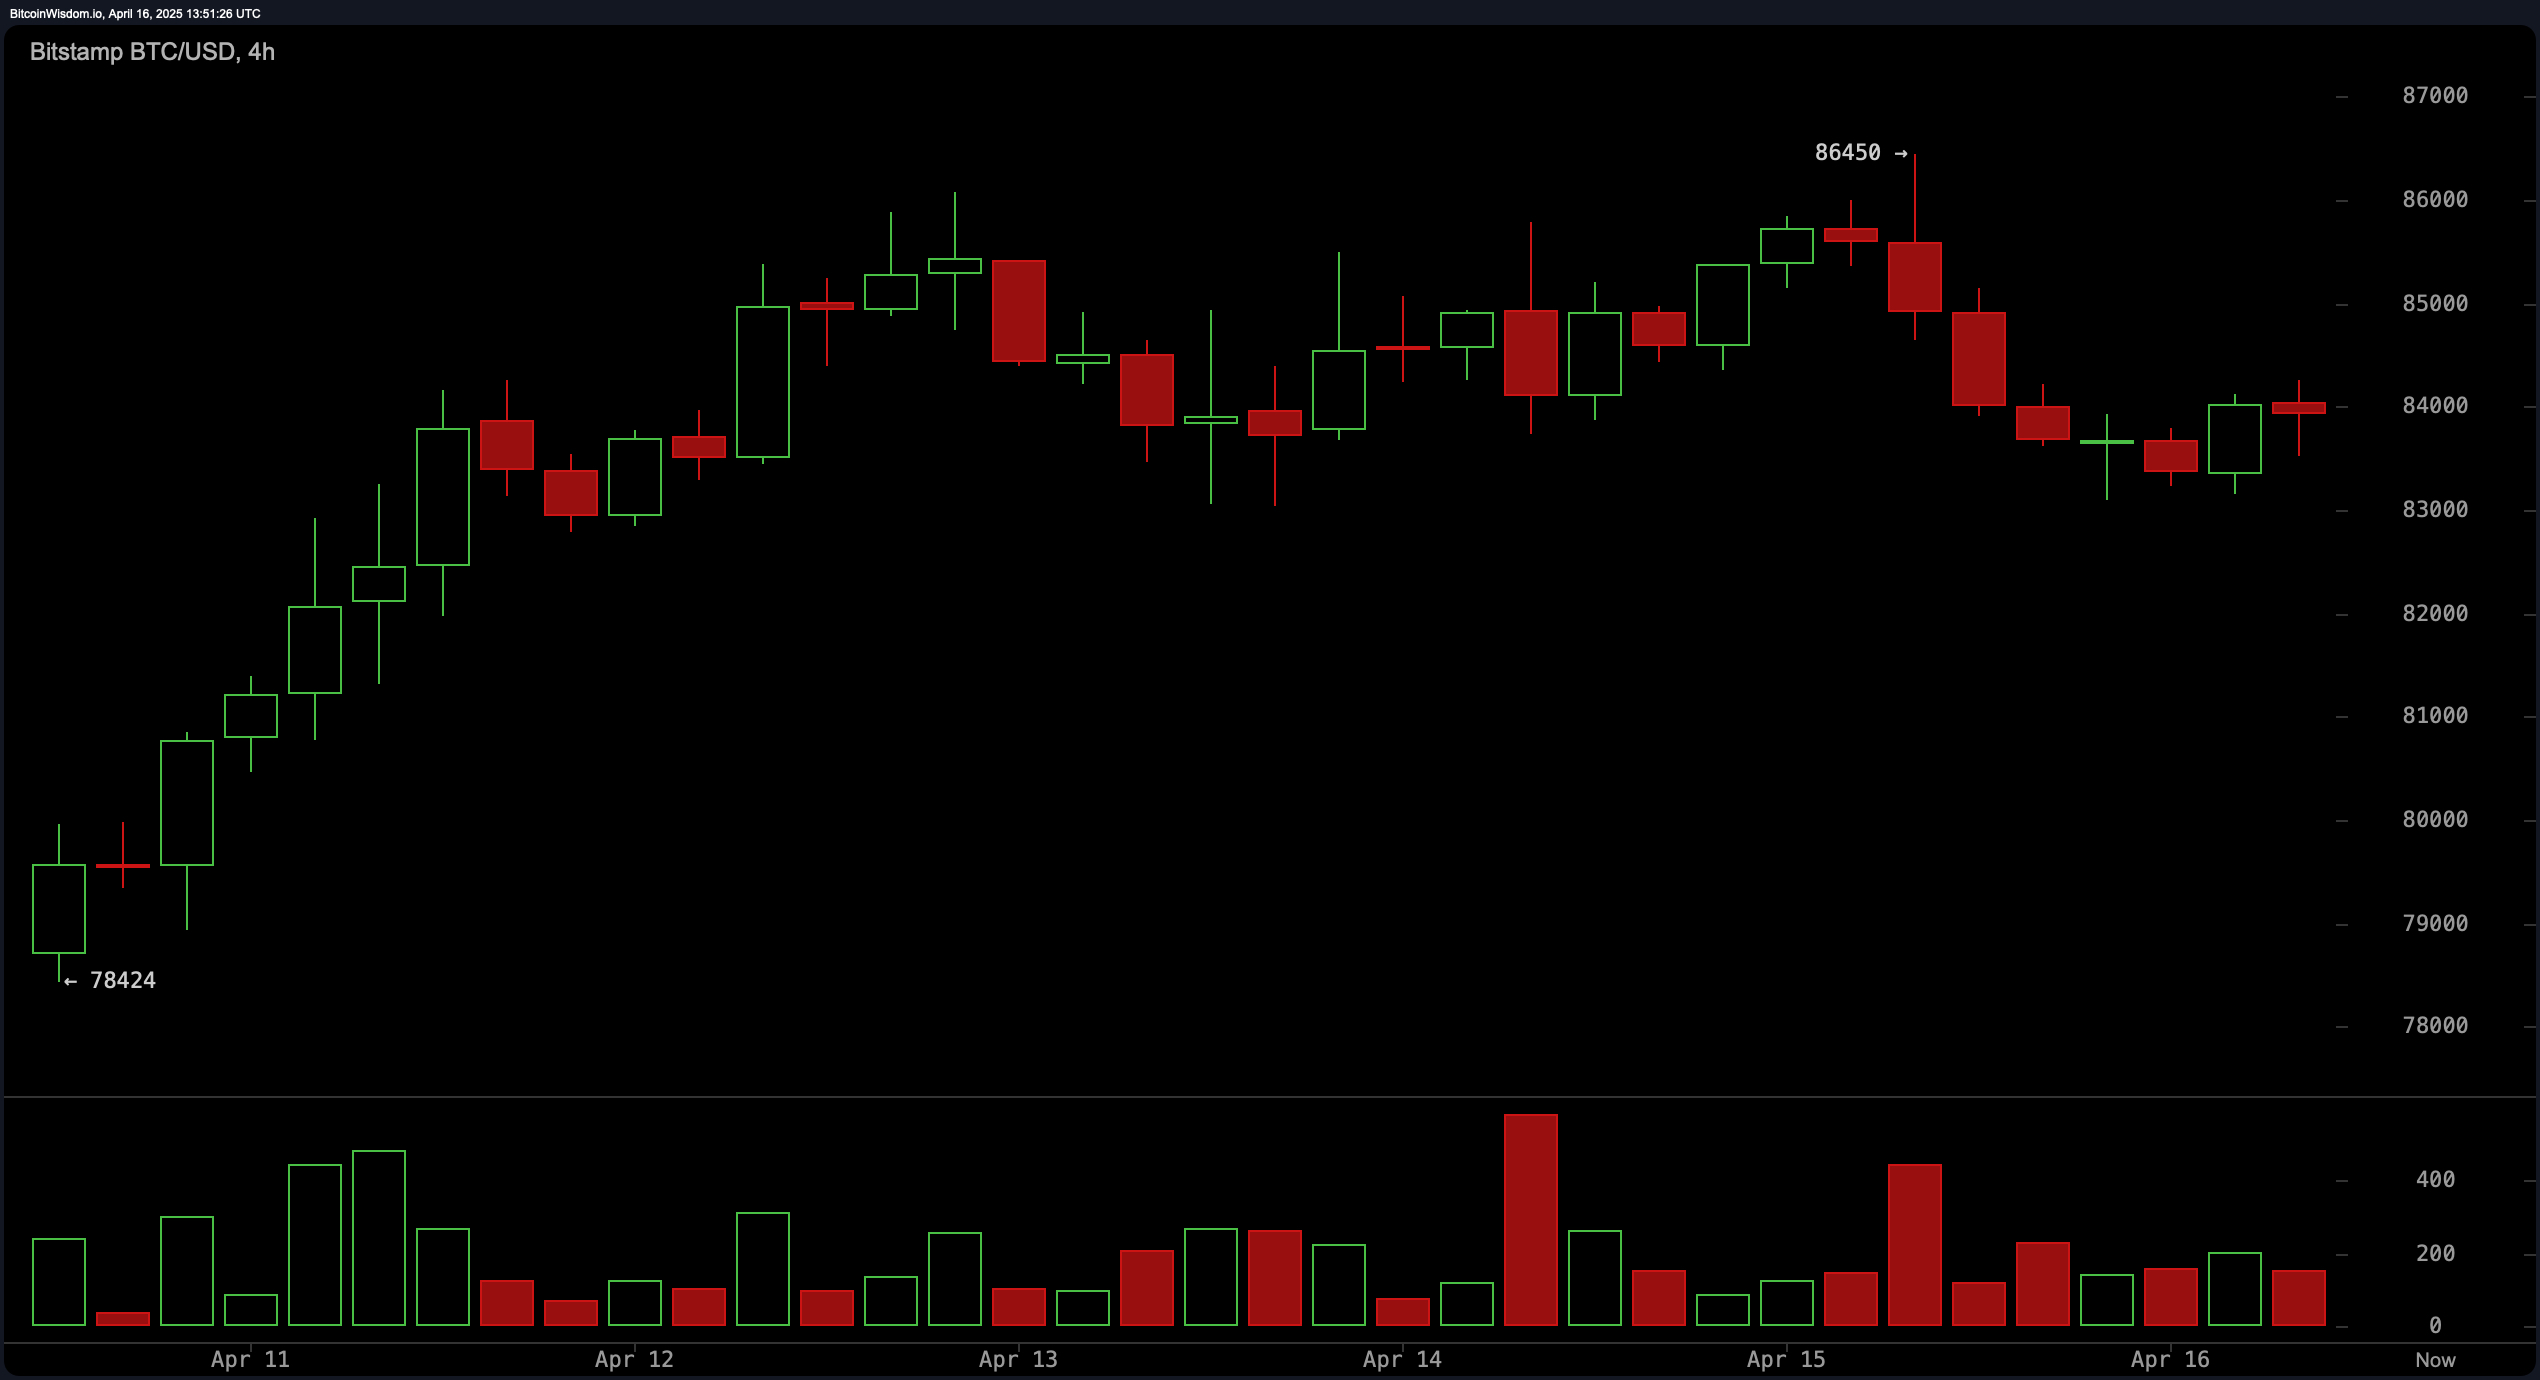
In the medium term, the four-hour chart paints a rather gloomy picture of a bearish structure, marked by a series of lower highs, following a rejection at $86,450. Volume spiked at this level but quickly diminished, showing a lack of enthusiasm. Nevertheless, Bitcoin is finding some support between $83,000 and $83,500, with price action tightening into a consolidation zone. This often precedes a bit of a kerfuffle. A clean break above $84,500, confirmed by trading volume, could initiate a retest of resistance around $86,500. Traders, however, should be wary of potential trickery in this narrowing range. Caveat emptor, what! 🧐
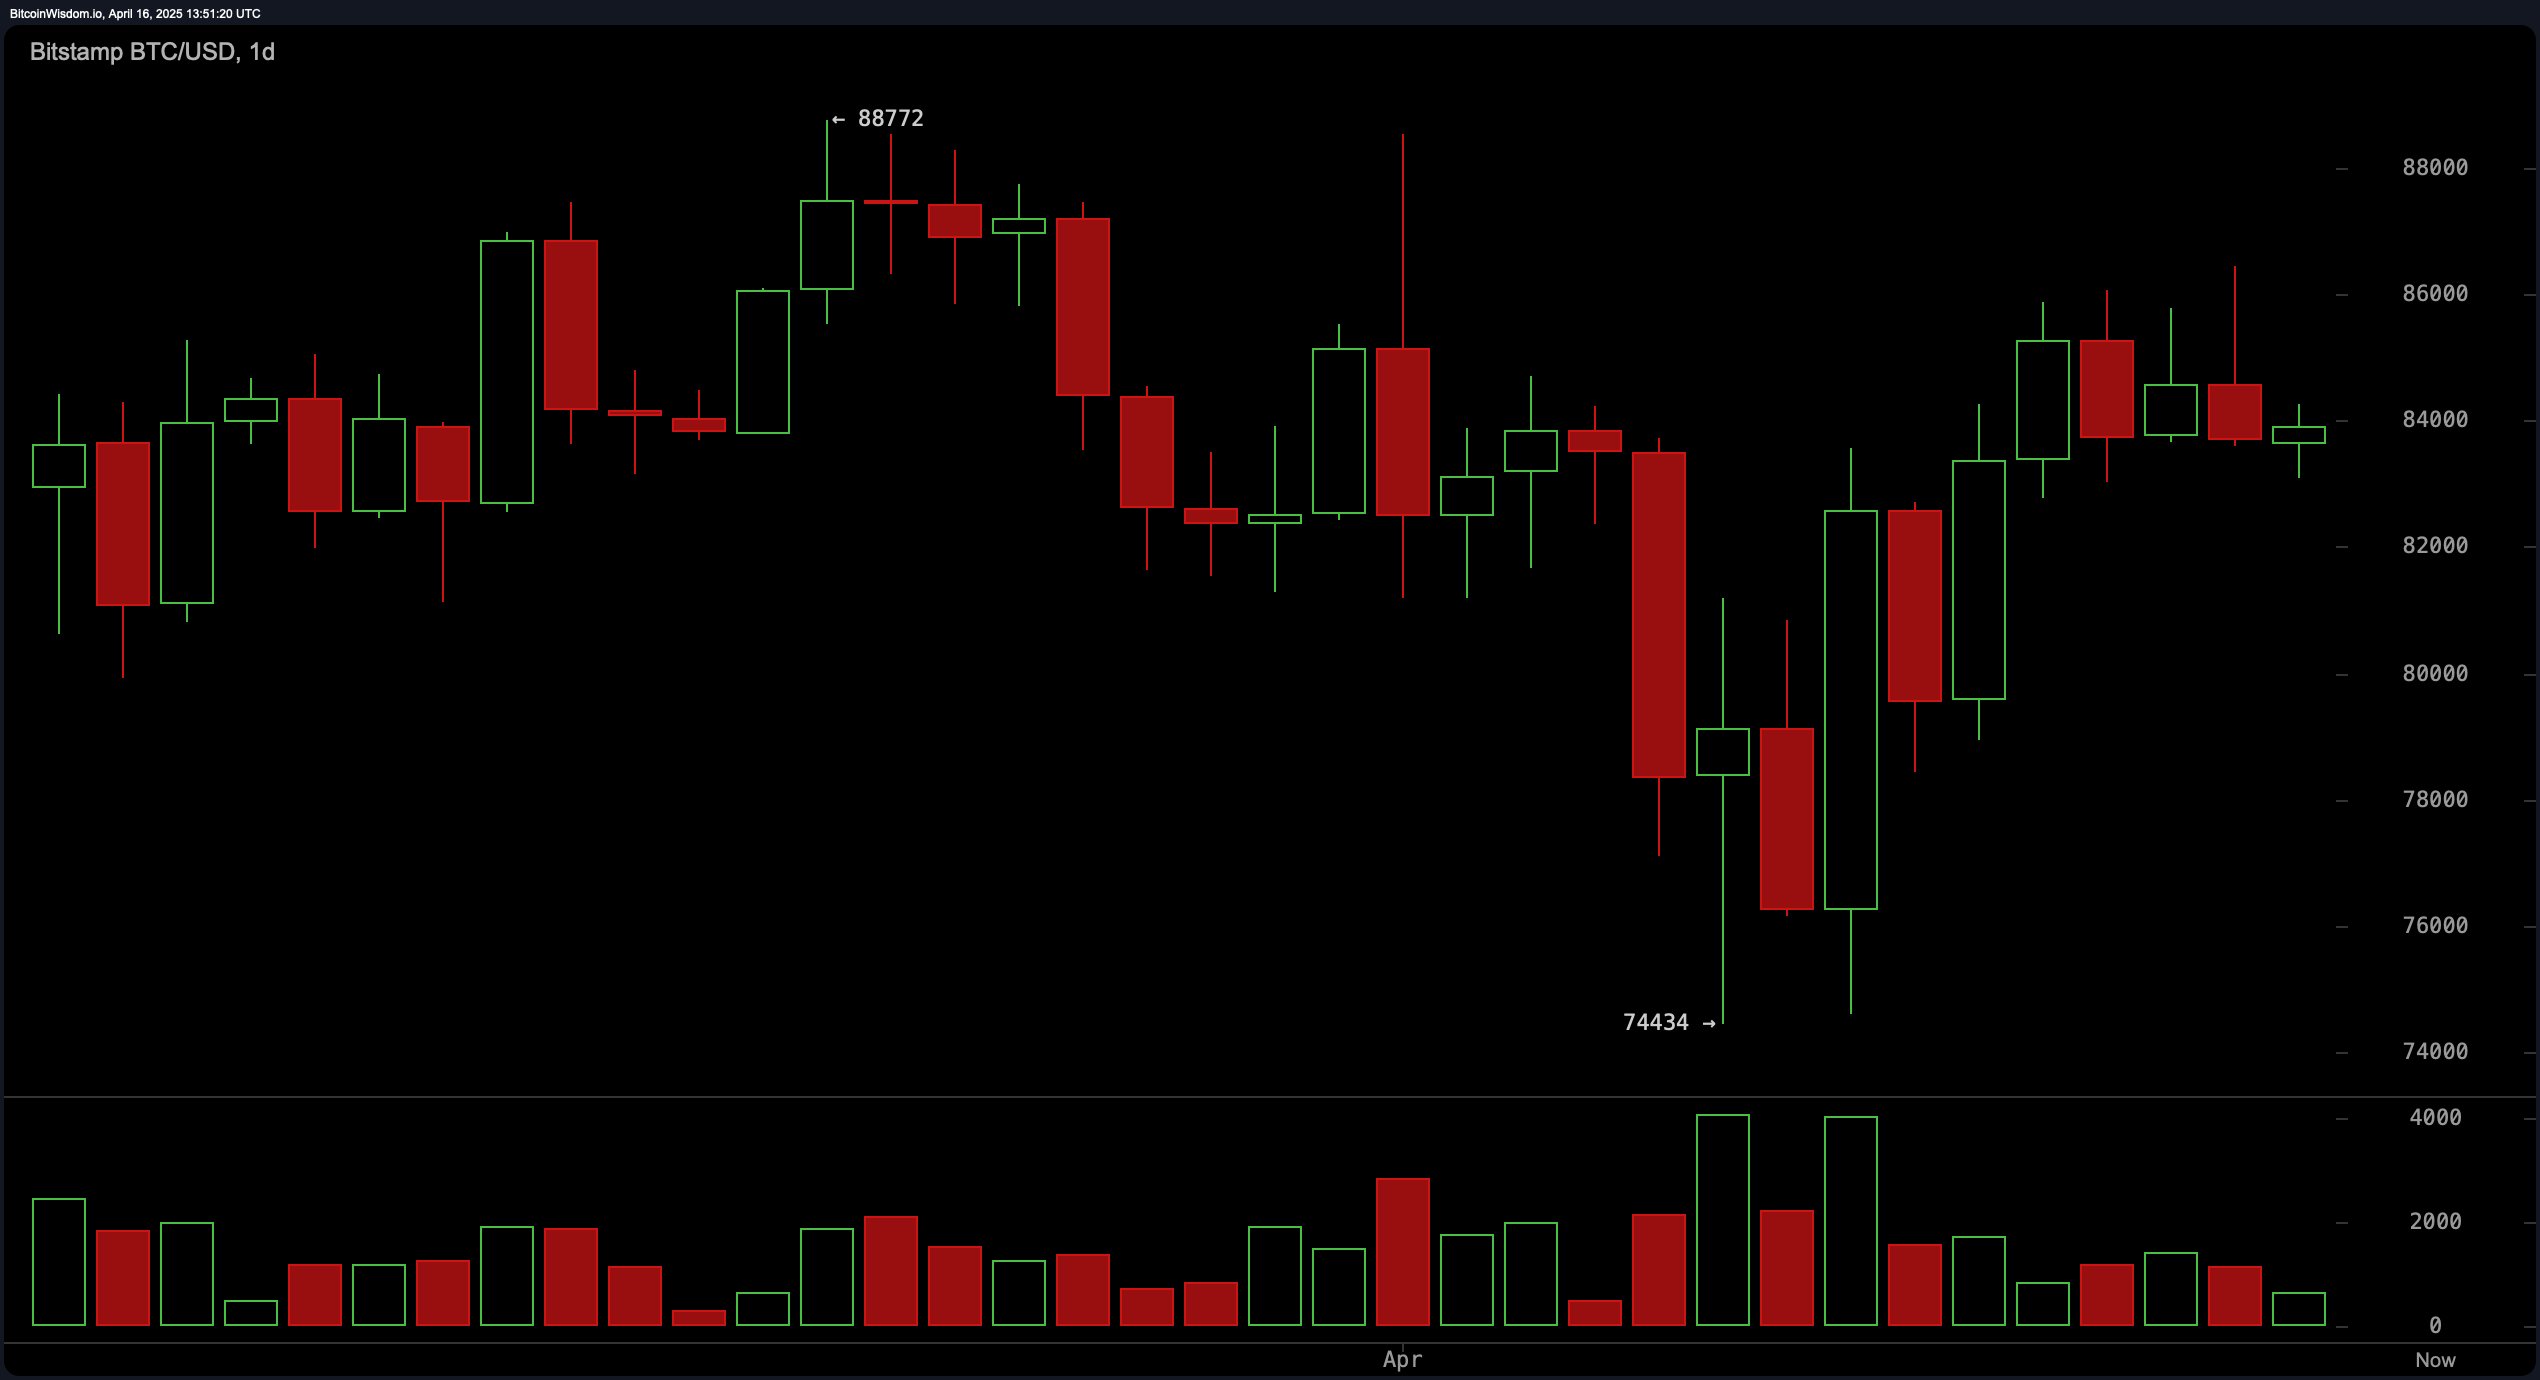
The daily chart offers a broader view, highlighting Bitcoin’s attempt to recover from a low at $74,434. This was marked by capitulation volume, suggesting a strong base. Prices have since rebounded, challenging the resistance band between $83,000 and $85,000. The current consolidation near $84,000 suggests the market is pondering its next move – either to test the $87,000 zone or retreat to retest $78,000 support. A higher low seems to be forming, potentially marking the beginning of a longer-term bullish reversal if the resistance band is overcome with volume support. Fingers crossed! 🤞
Momentum indicators and oscillators from the daily chart highlight the neutral stance of the market. The relative strength index (RSI), Stochastic oscillator, commodity channel index (CCI), average directional index (ADX), and awesome oscillator all signal neutrality. Meanwhile, momentum and the moving average convergence divergence (MACD) both suggest a buy, hinting at a slight bullish undertone. This mixed bag suggests the market is coiled, with momentum building beneath the surface but yet to resolve itself in either direction. A bit like a tightly wound spring, ready to pop! 💥
Moving averages (MAs) reveal a nuanced view across different timeframes. Short-term signals from the 10-day and 20-day exponential moving averages (EMA) and simple moving averages (SMA) point to a bullish bias, all indicating positive signals. However, longer-term indicators, including the 50-day, 100-day, and 200-day EMA and SMA, all signal bearishness, reflecting overhead resistance and possible downward pressure from earlier trends. The divergence between short-term bullishness and long-term caution frames a classic battleground scenario – reinforcing the importance of volume-confirmed breakouts for directional bias. A proper tug-of-war, if you ask me! 🤼
Bull Verdict:
If Bitcoin manages to break above $84,500 with rising volume and stays above $85,000, bullish momentum is likely to accelerate. The combination of short-term buy signals from key exponential and simple moving averages supports a potential move toward $87,000 and beyond, especially if a higher low confirms on the daily chart. Tally-ho! 🐎
Bear Verdict:
If Bitcoin fails to reclaim $84,500 and instead breaks below the $83,000 support zone, selling pressure could intensify. With medium- and long-term moving averages still favoring downside and the four-hour structure displaying consistent lower highs, a return to the $81,500 or even $78,000 levels remains a realistic bearish scenario. Oh dear, oh dear, oh dear! 😟
Read More
- 50 Goal Sound ID Codes for Blue Lock Rivals
- Quarantine Zone: The Last Check Beginner’s Guide
- 50 Ankle Break & Score Sound ID Codes for Basketball Zero
- Ultimate Myth Idle RPG Tier List & Reroll Guide
- Lucky Offense Tier List & Reroll Guide
- Mirren Star Legends Tier List [Global Release] (May 2025)
- Every House Available In Tainted Grail: The Fall Of Avalon
- Should You Save Vidar Or Give Him To The Children Of Morrigan In Tainted Grail: The Fall Of Avalon?
- Basketball Zero Boombox & Music ID Codes – Roblox
- How to use a Modifier in Wuthering Waves
2025-04-16 17:59