On April 3rd, 2025, bitcoin stabilized around $83,155, as traders handled a day marked by heavy trading volume and extreme price fluctuations. The digital currency showed conflicting signs across various timeframes, suggesting uncertainty but with key price points emerging for both bullish and bearish investors.
Bitcoin
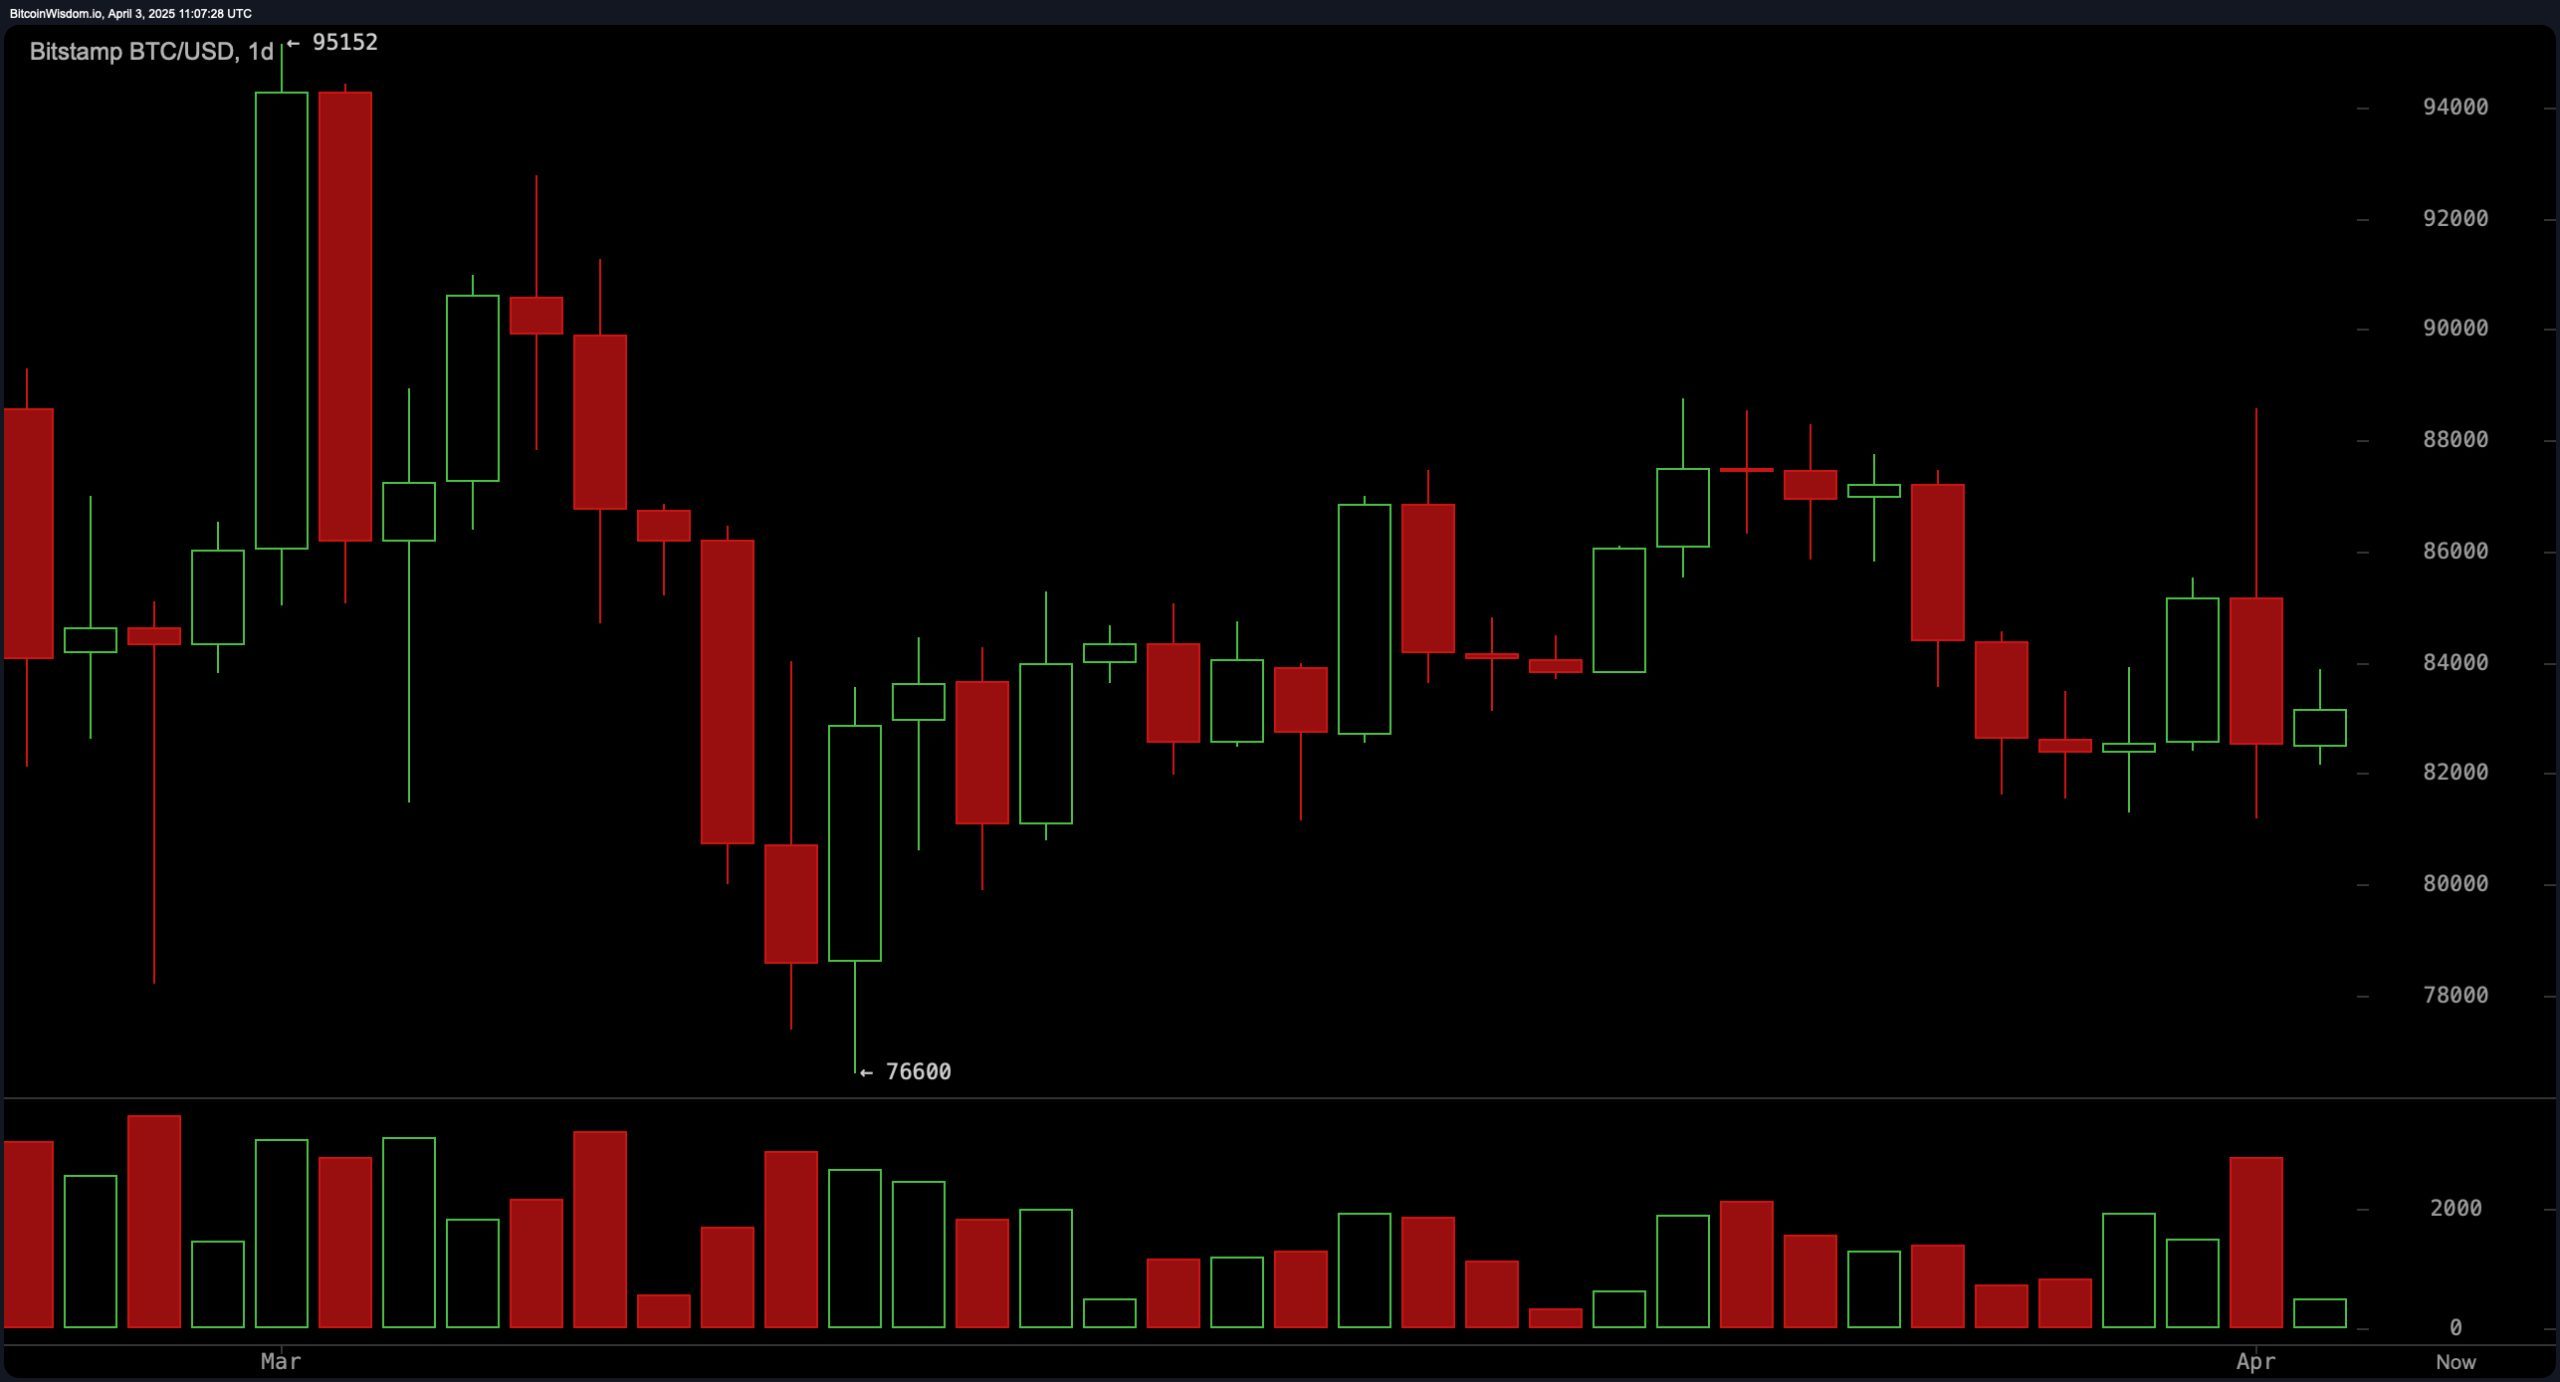
Over the course of each day, bitcoin’s path mirrored a recent high around $94,000 before experiencing a significant drop to around $81,000, implying that a corrective phase was underway. The subsequent rise back up to $84,000 showed that buyers were still active at the lower end, particularly within the range of $81,000 to $82,000 as a support zone. Yet, the increase in trading volume during the red candle signaled strong selling pressure, implying that if the current levels are not sustained, a more substantial decline might occur. The resistance remains steady between $88,000 and $90,000, so traders need to stay alert if the price action stalls or reverses close to these levels.

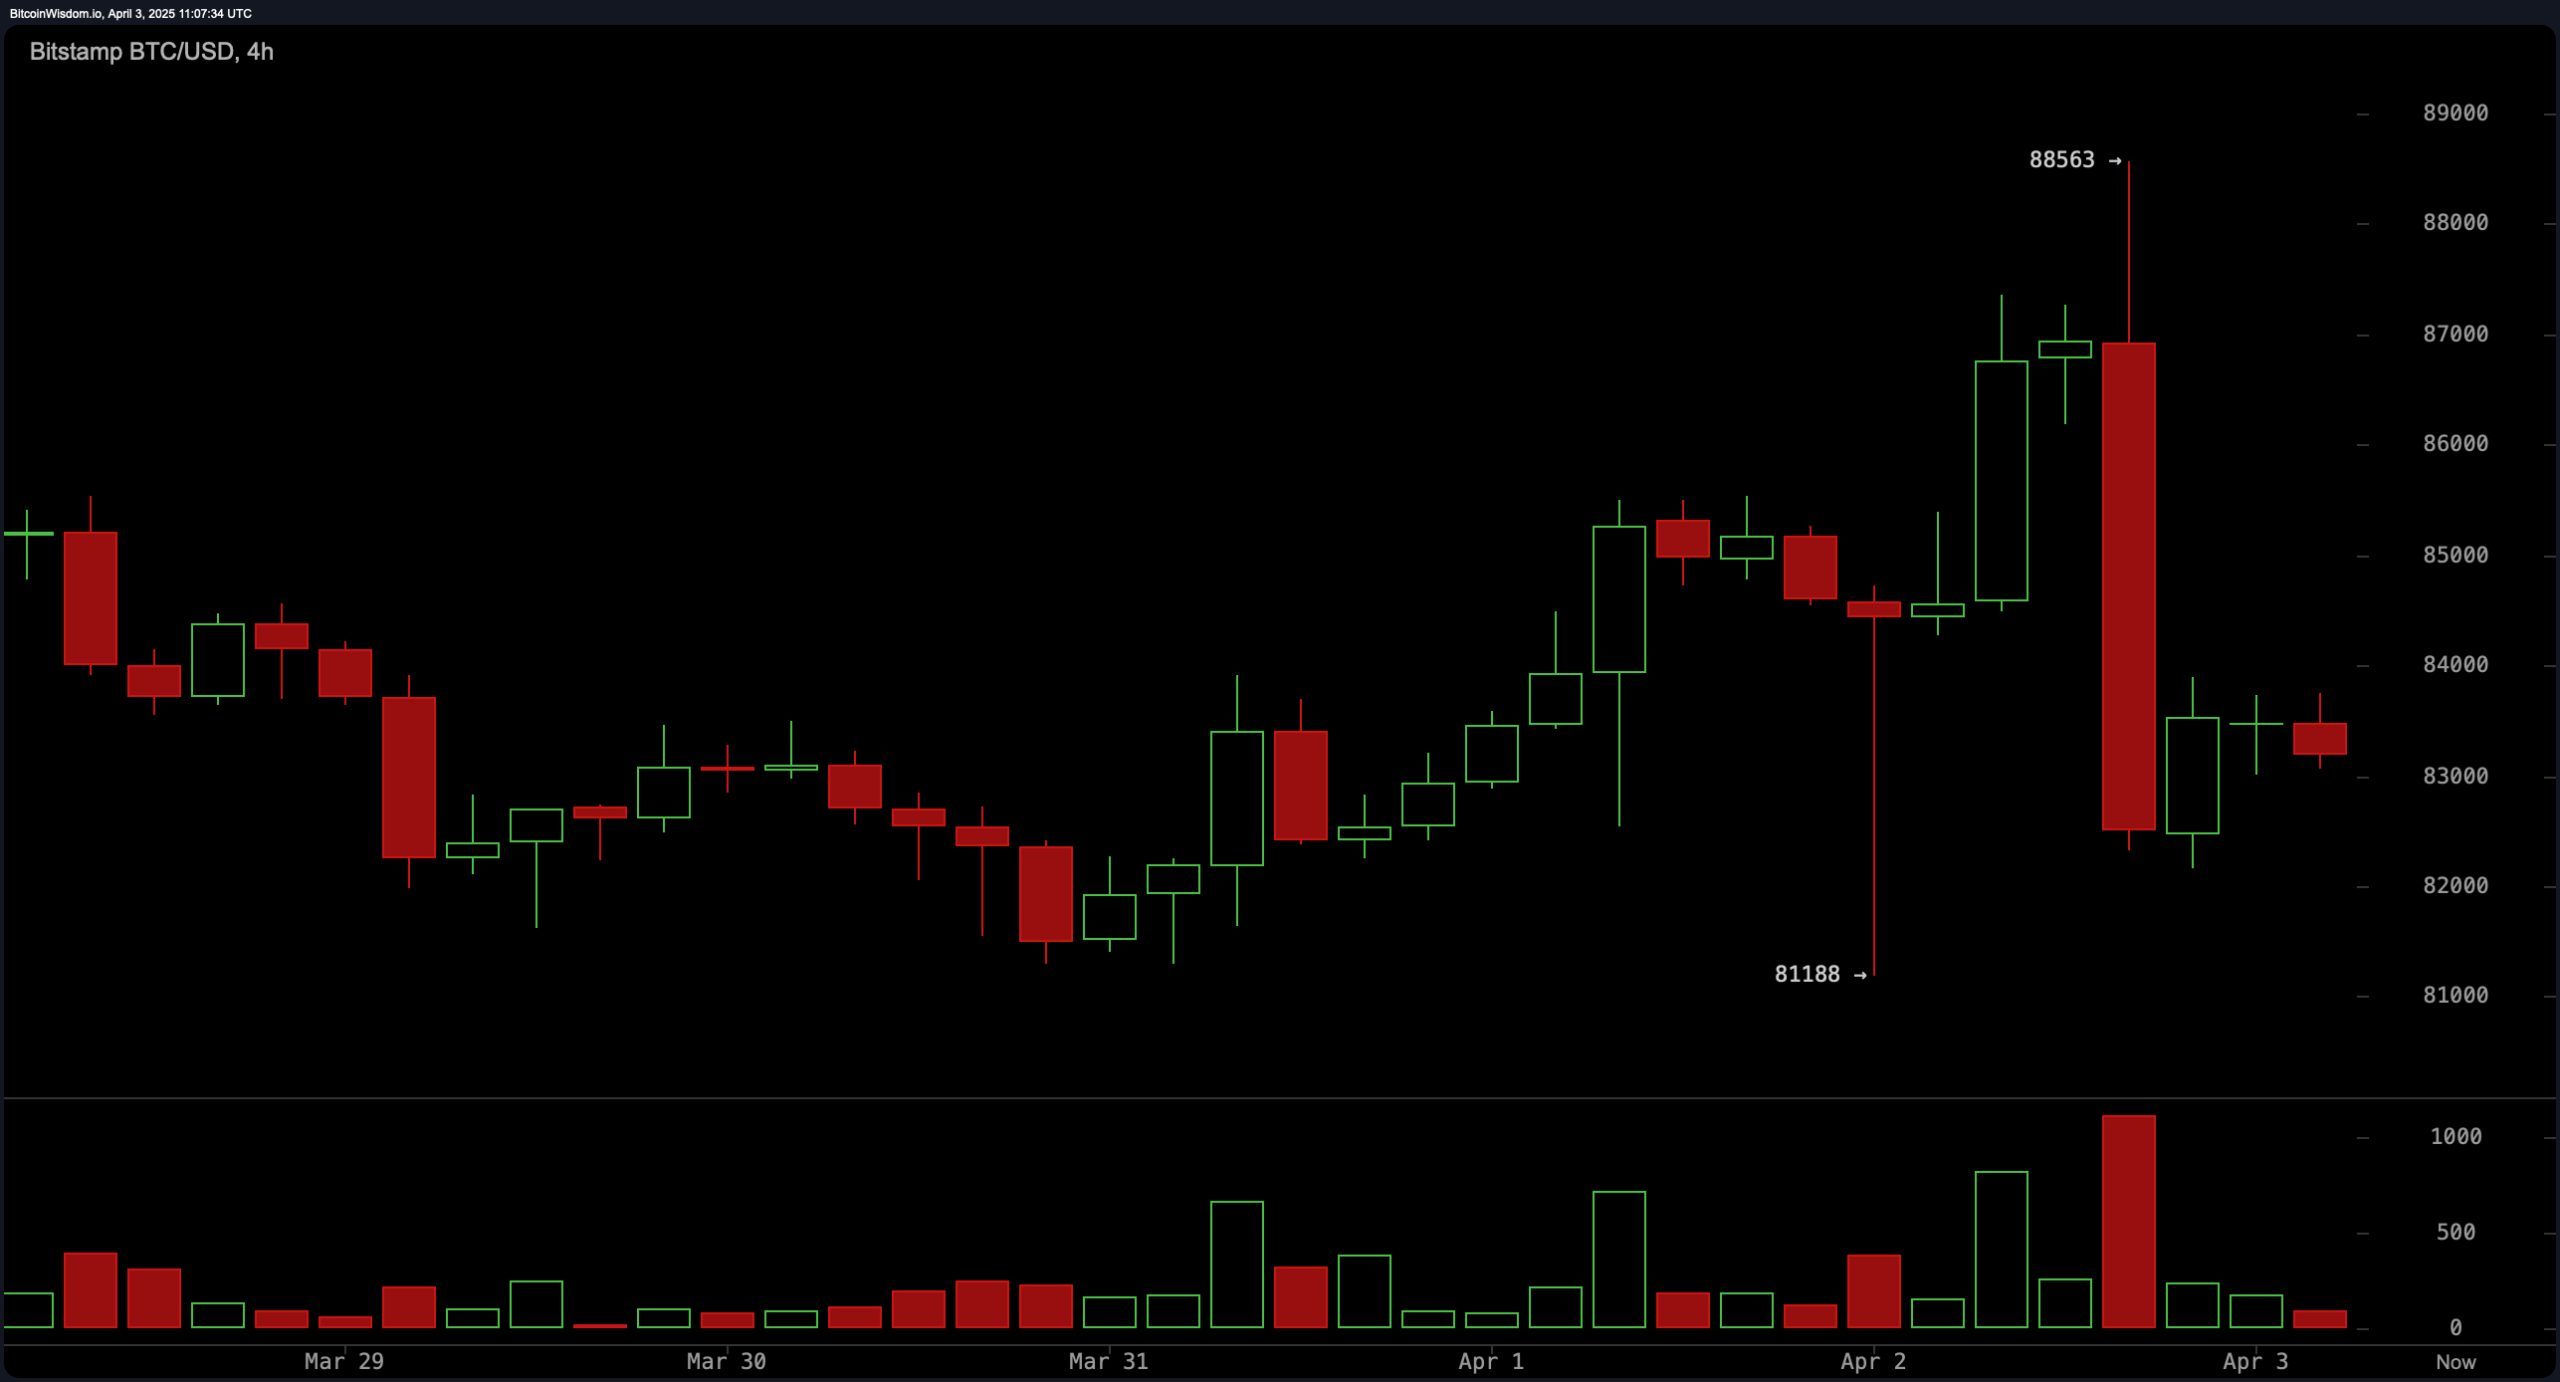
Looking at the 4-hour chart, Bitcoin displayed a clear refusal at around $88,500, as indicated by a significant wick and subsequent drop in price. The current price range is between $83,000 and $85,000, indicating a tight consolidation. Interestingly, a sudden dip to $81,100 suggested strong buying activity, which might be due to liquidity grabs or stop-loss hunting by larger players. Trading opportunities for scalping can be found, especially when setting long positions around $82,000 to $83,000, given confirmation from volume indicators. On the other hand, resistance near $85,000 to $86,000 could provide a suitable short entry point if the upward trend weakens.

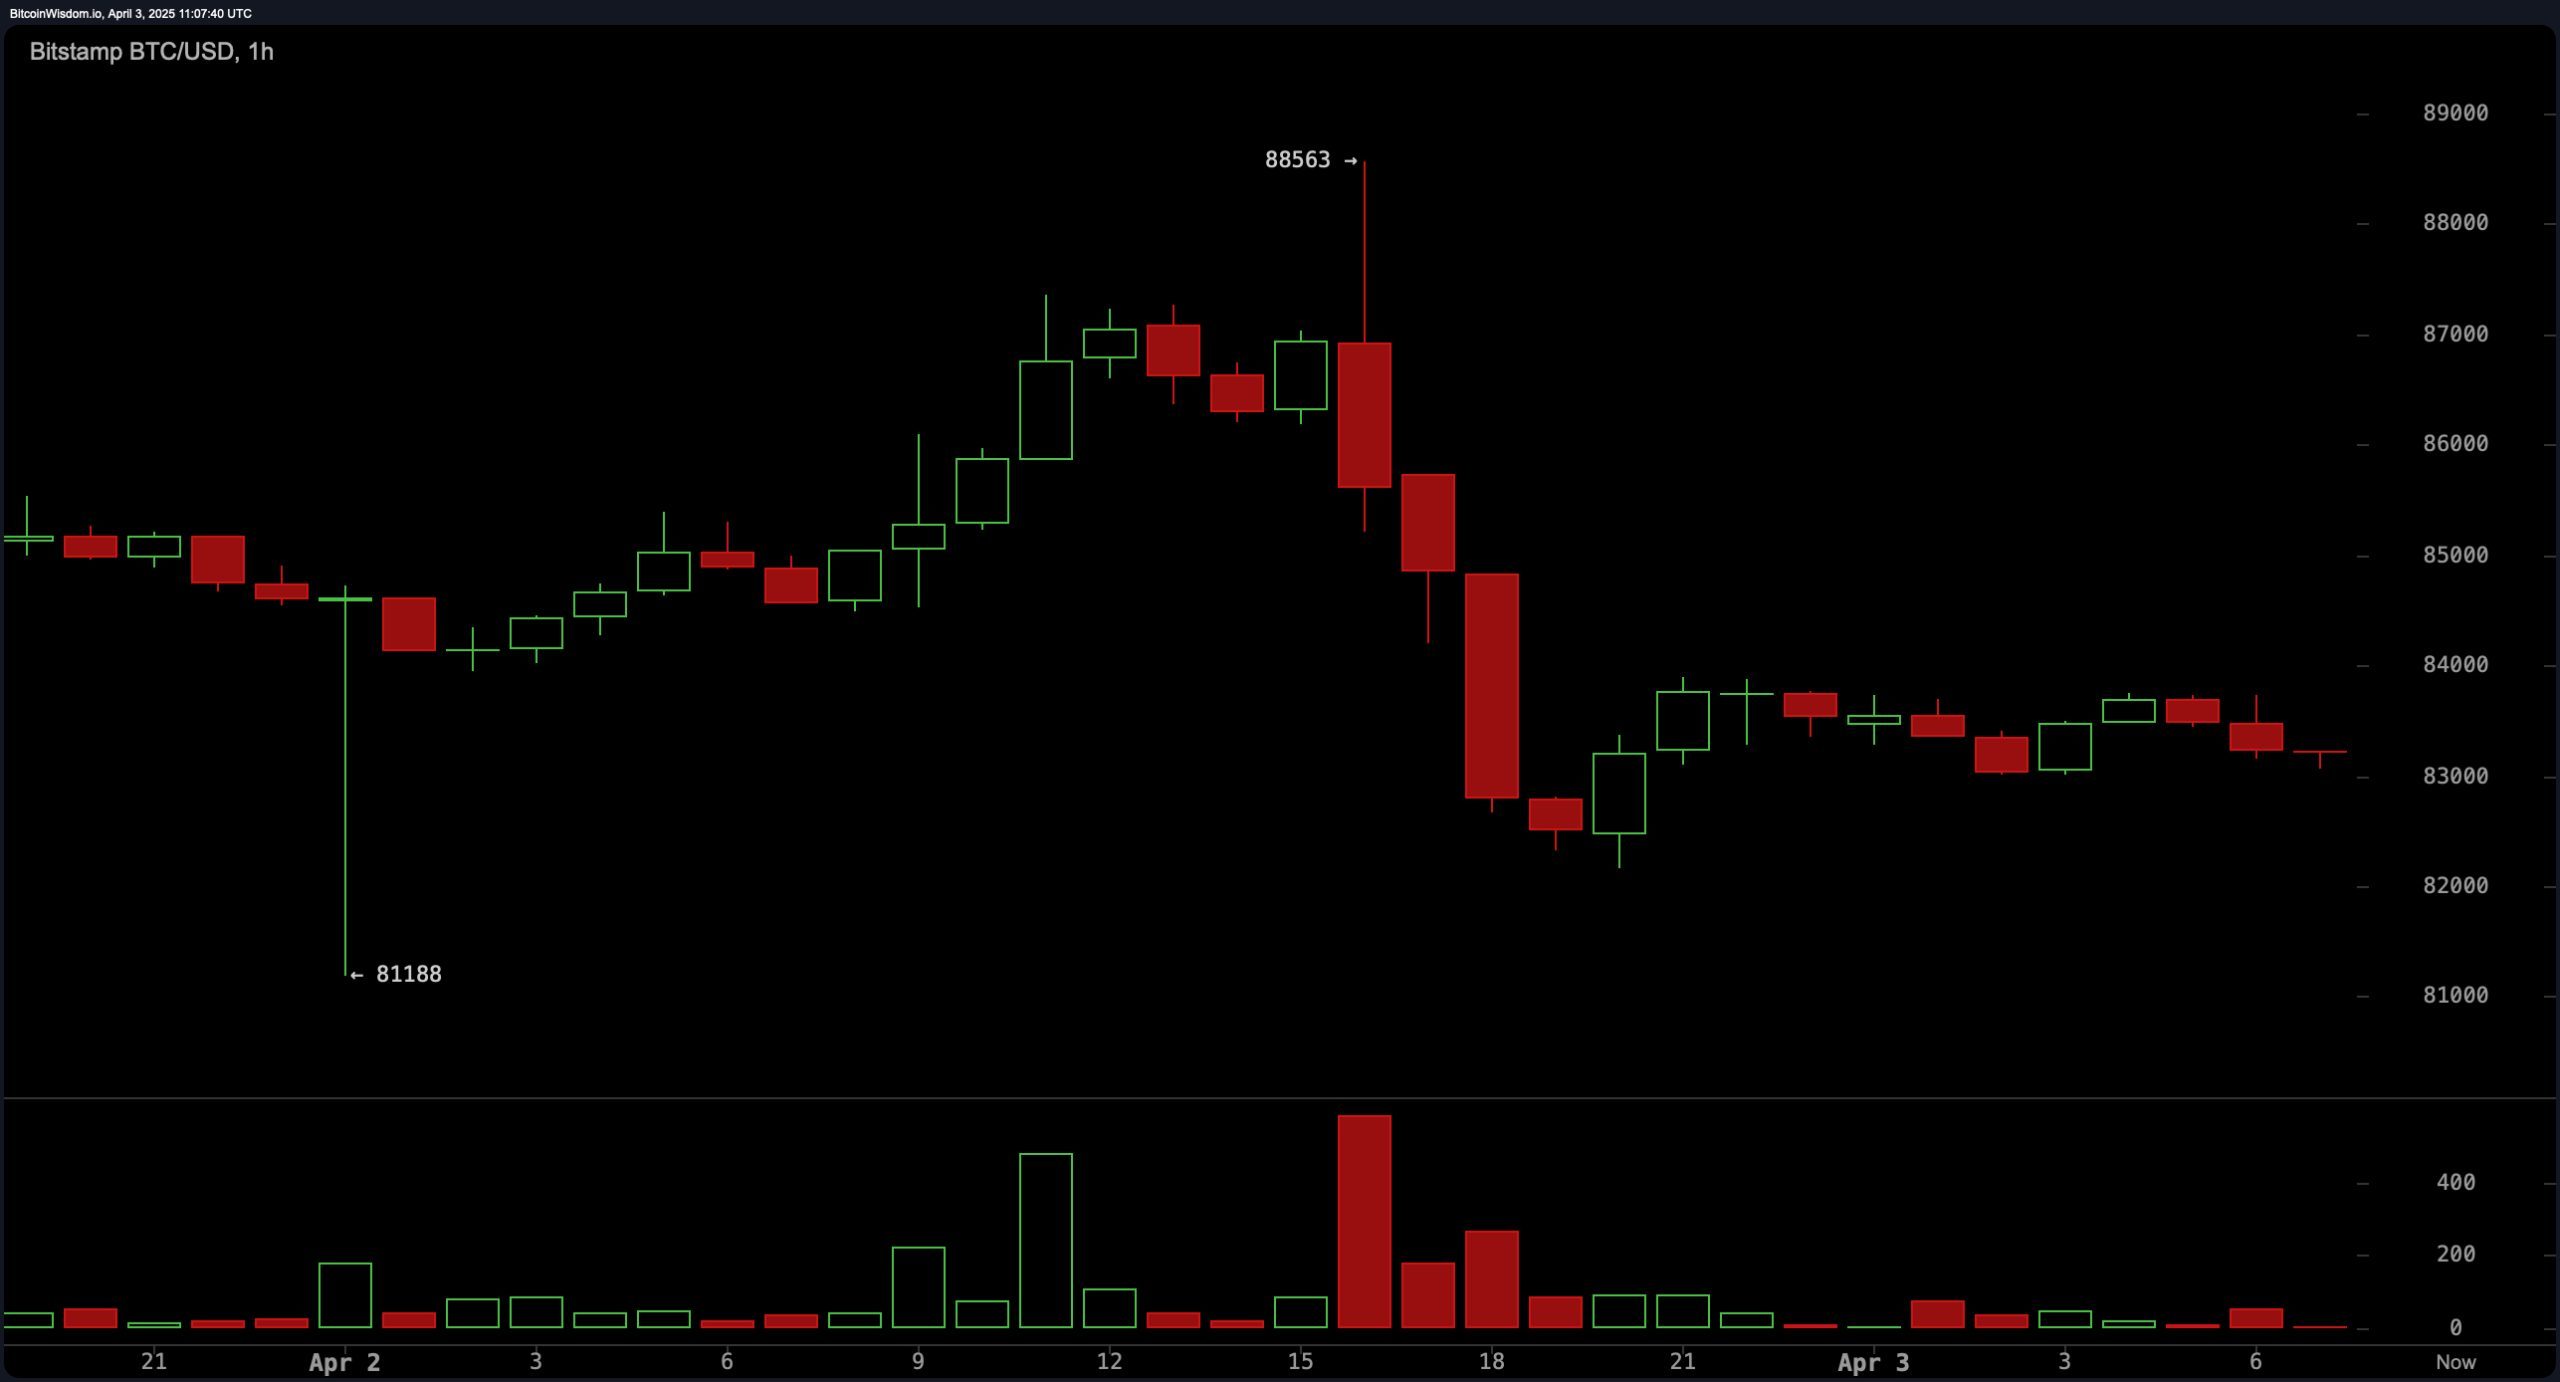
According to the one-hour chart, there’s a clear downward trend that started after the price was rejected at around $88,500. This decline is significant, and it’s backed up by high volumes of red candles, which typically indicate institutional selling, suggesting a bearish market outlook. The price has tried to bounce back slightly but has been struggling near the $84,000 level. Currently, it seems to be consolidating horizontally around $83,000. Short-term traders might want to watch for bullish signs like a double bottom or a bullish engulfing candle within the range of $82,500 to $83,000. Any potential recovery might face resistance near $84,500 to $85,000, which coincides with short-term resistance levels and previous breakdown points.

In terms of technical indicators, oscillators presented a mixed-to-neutral sentiment. The relative strength index (RSI) at 45, Stochastic at 31, commodity channel index (CCI) at −75, average directional index (ADX) at 20, and awesome oscillator all read as neutral. The momentum oscillator registered a negative −4,420, reflecting a sell bias. Interestingly, the moving average convergence divergence (MACD) level was the lone buy indicator, printing −1,071, suggesting some underlying divergence or a pending reversal in momentum.
Moving averages, however, were universally bearish across all major timeframes. Both the exponential moving averages (EMA) and simple moving averages (SMA) for 10, 20, 30, 50, 100, and 200 periods all signaled a sell. With the 10-period EMA at $83,889 and SMA at $84,417—each above the current price—the trend remains under pressure. The long-term averages, such as the 200-period EMA at $85,402 and SMA at $86,410, further reinforce the prevailing downtrend, indicating sustained selling pressure and making any bullish breakout attempts difficult without a shift in volume and structure.
Bull Verdict:
To maintain their position, bulls should focus on fortifying the price range between $81,000 and $83,000, a zone known for drawing buyers at various time scales in the past. If a distinct reversal pattern like a double bottom or a bullish engulfing candle emerges, coupled with a MACD crossover indicating a bullish trend, it could ignite a brief surge towards $85,000 and even challenge the resistance zone of $88,000 to $90,000. A break above this level would suggest a resumption of positive momentum.
Bear Verdict:
As long as Bitcoin stays beneath its group of moving averages, it’s the bears who maintain control due to a persistent sell bias across both short- and long-term trends. A clear break below the $81,000 support could undermine bullish predictions and pave the way for potential lower price regions around $78,000 to $76,000. The heavy red trading volume and repeated refusals near $84,000 to $85,000 hint that sellers are currently in charge of the short-term market momentum.
Read More
- 50 Ankle Break & Score Sound ID Codes for Basketball Zero
- Who Is Harley Wallace? The Heartbreaking Truth Behind Bring Her Back’s Dedication
- 50 Goal Sound ID Codes for Blue Lock Rivals
- Mirren Star Legends Tier List [Global Release] (May 2025)
- Elden Ring Nightreign Enhanced Boss Arrives in Surprise Update
- KPop Demon Hunters: Real Ages Revealed?!
- Here’s Why Your Nintendo Switch 2 Display Looks So Blurry
- Death Stranding 2 Review – Tied Up
- 100 Most-Watched TV Series of 2024-25 Across Streaming, Broadcast and Cable: ‘Squid Game’ Leads This Season’s Rankers
- Jeremy Allen White Could Break 6-Year Oscars Streak With Bruce Springsteen Role
2025-04-03 15:33