Ah, Bitcoin, that ever-elusive creature of the digital age, now grappling with the formidable wall of $97,000—an enemy more stubborn than a cat avoiding a bath. The once unstoppable surge has slowed, and we find ourselves in the midst of a showdown, where the buyers and sellers trade blows with all the subtlety of a drunken brawl. And what do we see on the horizon? A potential corrective phase, of course, because why would anything ever be simple in the world of cryptocurrency? 🥳
Technical Analysis
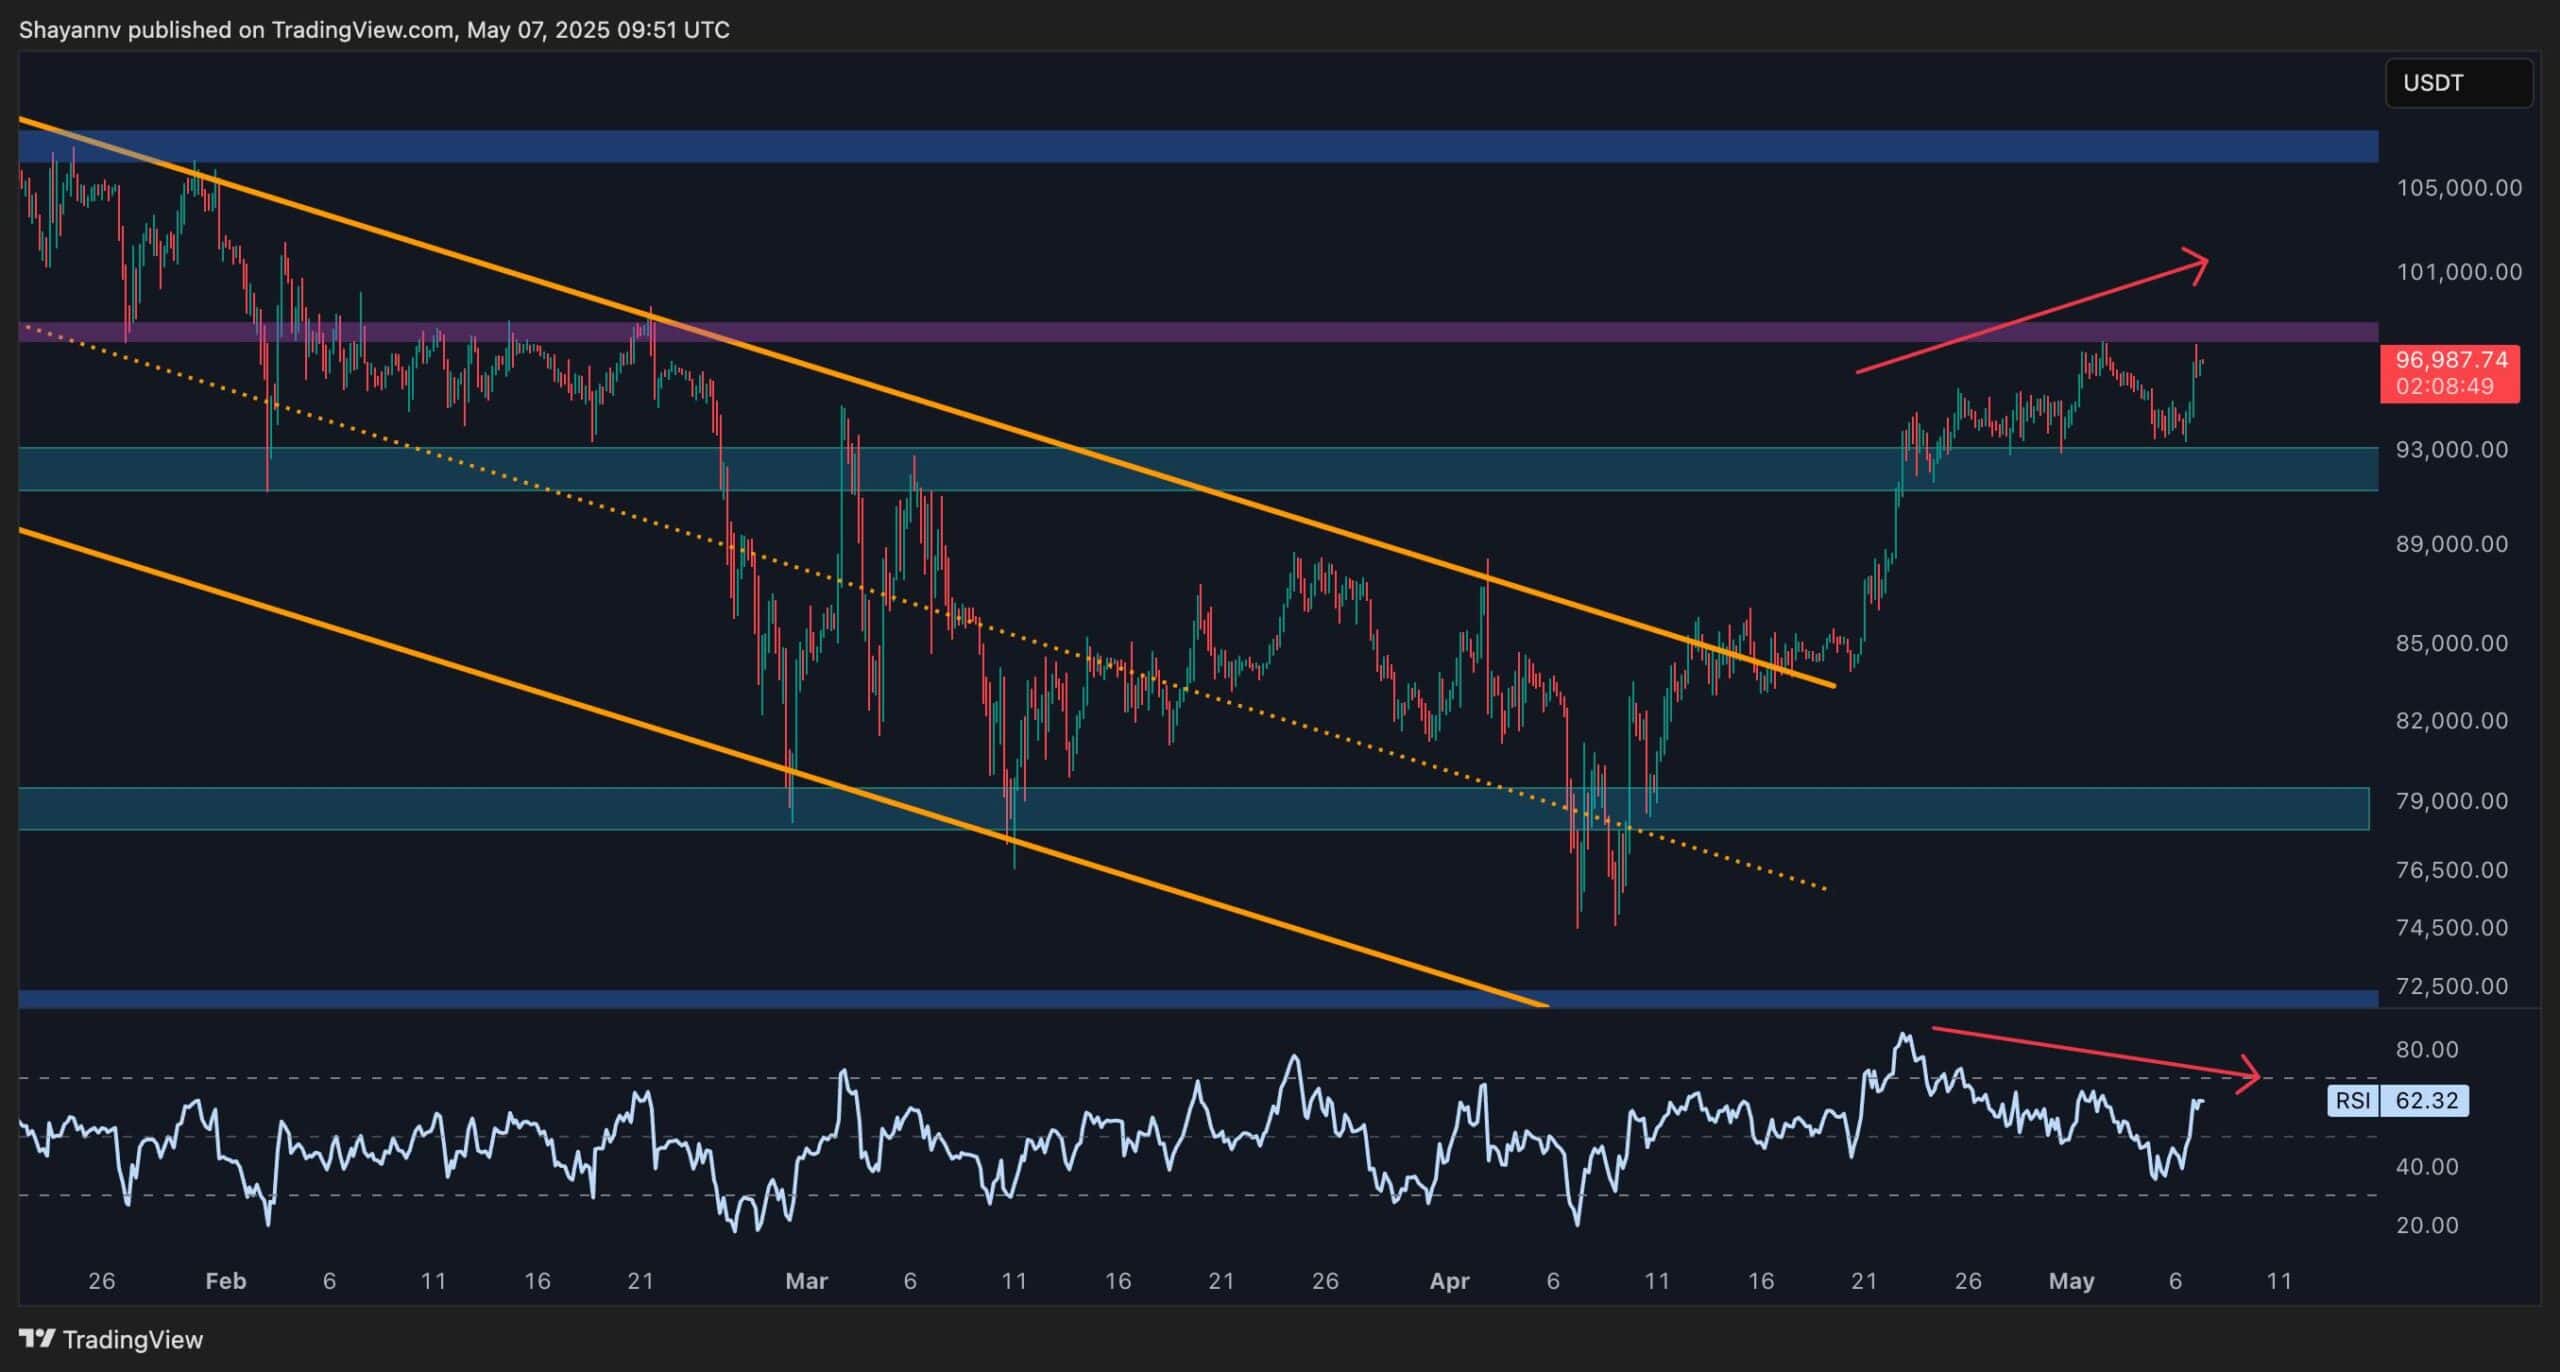
The Daily Chart
Bitcoin, having dashed past the $90K mark like a victorious horse, now faces its first real challenge at $97K. But what happens when it reaches that lofty peak? A halt, like a deer caught in headlights. The price hovers, struggling to break free from the cruel grip of this resistance zone. The $97K level—it’s like a party that Bitcoin was never quite invited to but is determined to crash anyway. The traders are present, the tension palpable. Will it be the start of a new chapter or the end of the wild ride? Only time will tell. ⏳
Moreover, there’s something ominous in the air: the 100-day moving average has crossed under the 200-day moving average, signaling a “death cross.” A rather macabre name for something so utterly technical, but here we are. This event could spell the weakening of momentum, as if the wind has been taken out of Bitcoin’s sails. Buckle up, because a short-term pullback, possibly to the more familiar $90K territory, is looking more likely by the minute. 🚀💀

The 4-Hour Chart
Now, let’s zoom in a little closer, shall we? At the 4-hour interval, Bitcoin’s struggle at $97K looks even more dramatic. It’s like a dramatic opera—Bitcoin reaches its crescendo only to hit a sharp note of disappointment. After attempting to break through, the price has been caught in a tug-of-war between $93K and $97K, with no clear winner in sight.
And just when you think things couldn’t get more entertaining, here comes the RSI indicator, showing a lovely bearish divergence. It’s almost as if the sellers are quietly sharpening their knives behind the curtains. A correction seems inevitable, like that one relative who insists on sitting in the front row of every family photo. Don’t be surprised if Bitcoin takes a quick dip and moves back into consolidation within that $93K–$97K range, keeping us all on the edge of our seats. 🎭
On-chain Analysis
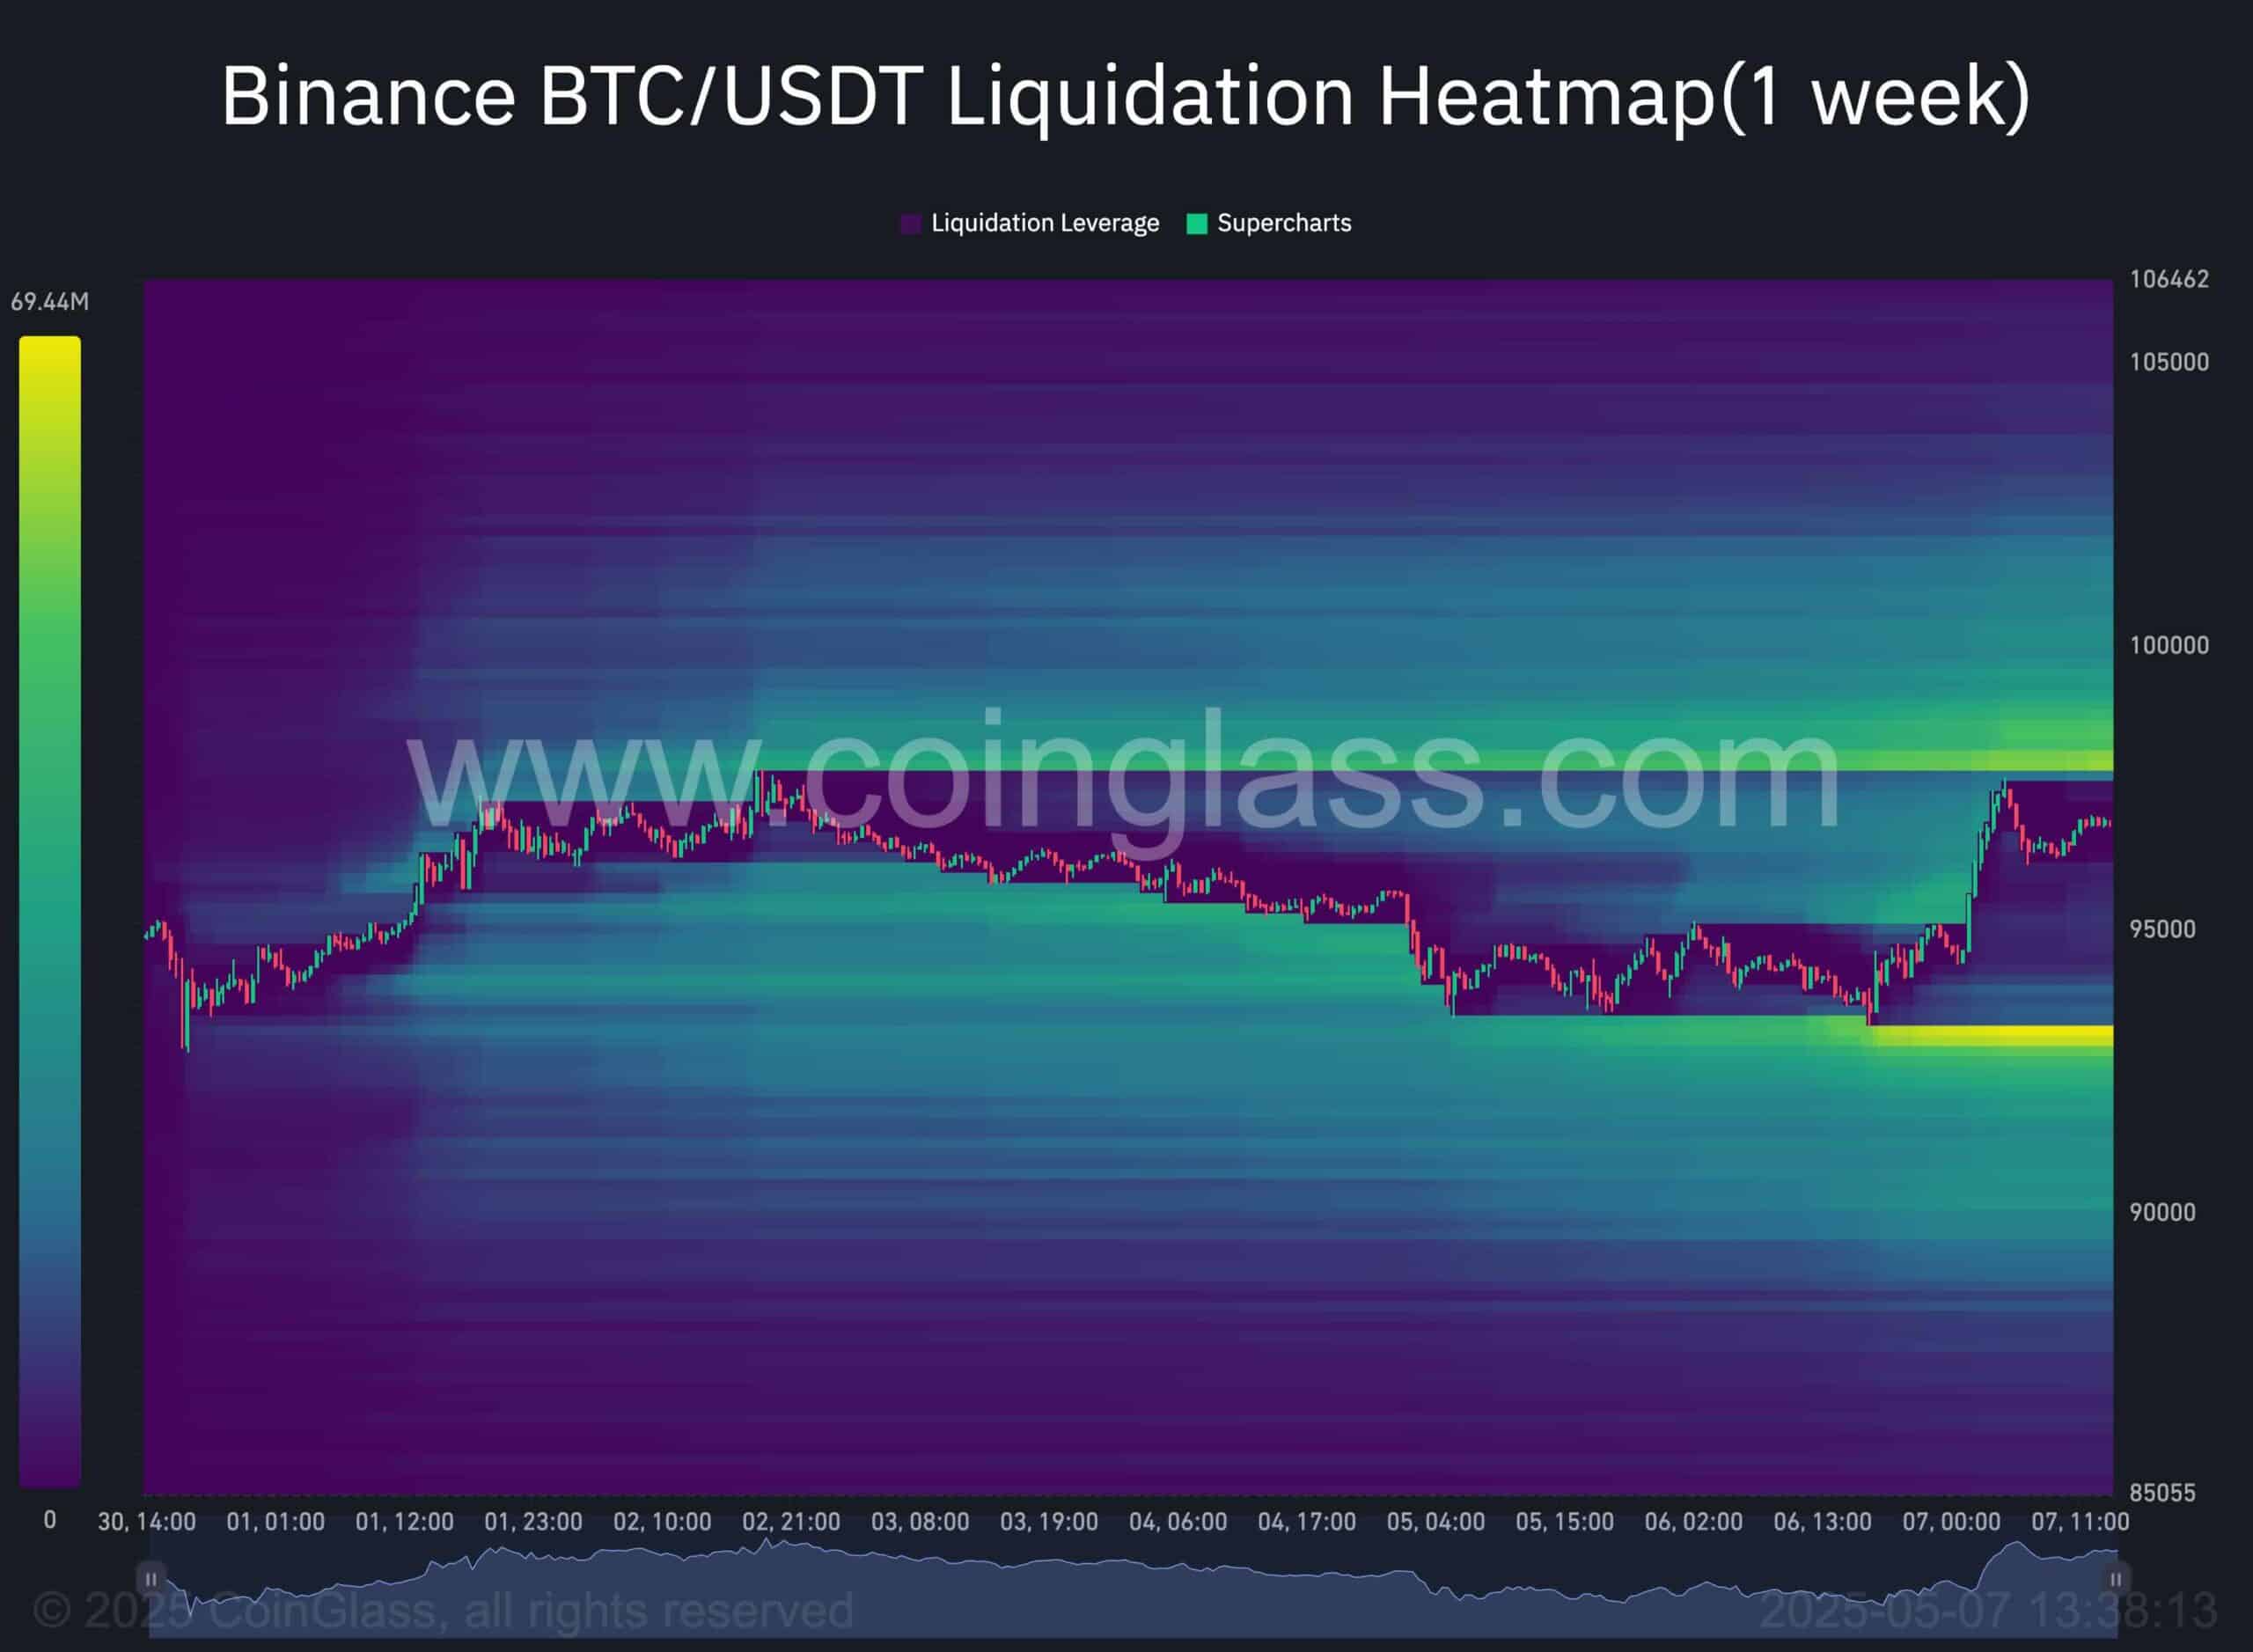
Ah, the world of on-chain metrics—where the real fun begins. While Bitcoin enjoys its little pause, let’s talk about futures market liquidity, shall we? The BTC/USDT Binance liquidation heatmap presents an all-too-familiar tale. There are two juicy liquidity zones, one above $97K and one below $93K. A clever game of cat and mouse, with the “smart money” ready to pull the trigger. Will the price dip below $93K, luring in retail traders for a liquidation fest? Or will it burst through $97K, sending us all into a frenzy of exhilaration?
With the overall market still favoring the bulls, a little dip below $93K before making another attempt to break above the $97K resistance wouldn’t be entirely shocking. It’s the kind of rollercoaster ride where you never quite know when you’re going to get that gut-wrenching drop. 🎢
Read More
- Who Is Harley Wallace? The Heartbreaking Truth Behind Bring Her Back’s Dedication
- Basketball Zero Boombox & Music ID Codes – Roblox
- 50 Ankle Break & Score Sound ID Codes for Basketball Zero
- TikToker goes viral with world’s “most expensive” 24k gold Labubu
- 100 Most-Watched TV Series of 2024-25 Across Streaming, Broadcast and Cable: ‘Squid Game’ Leads This Season’s Rankers
- Revisiting Peter Jackson’s Epic Monster Masterpiece: King Kong’s Lasting Impact on Cinema
- 50 Goal Sound ID Codes for Blue Lock Rivals
- League of Legends MSI 2025: Full schedule, qualified teams & more
- KFC launches “Kentucky Fried Comeback” with free chicken and new menu item
- All Songs in Superman’s Soundtrack Listed
2025-05-07 16:42