The market, dear reader, is currently flatter than a pancake run over by a steamroller 🥞🚜. Netflows? More like net-no-flows! Big, boring coins are sliding down slower than a sloth on sleeping pills, while poor little Dogecoin is plummeting faster than a lead balloon in a hurricane.
Dogecoin’s Death Cross: More Like a Death Sentence ☠️
Behold! The dreaded Death Cross has arrived for Dogecoin, like an uninvited guest at a party who eats all the snacks and then complains about the music. When the 50-day average crosses below the 200-day average, even your grandma’s cat knows it’s time to panic-sell 🐱💸.
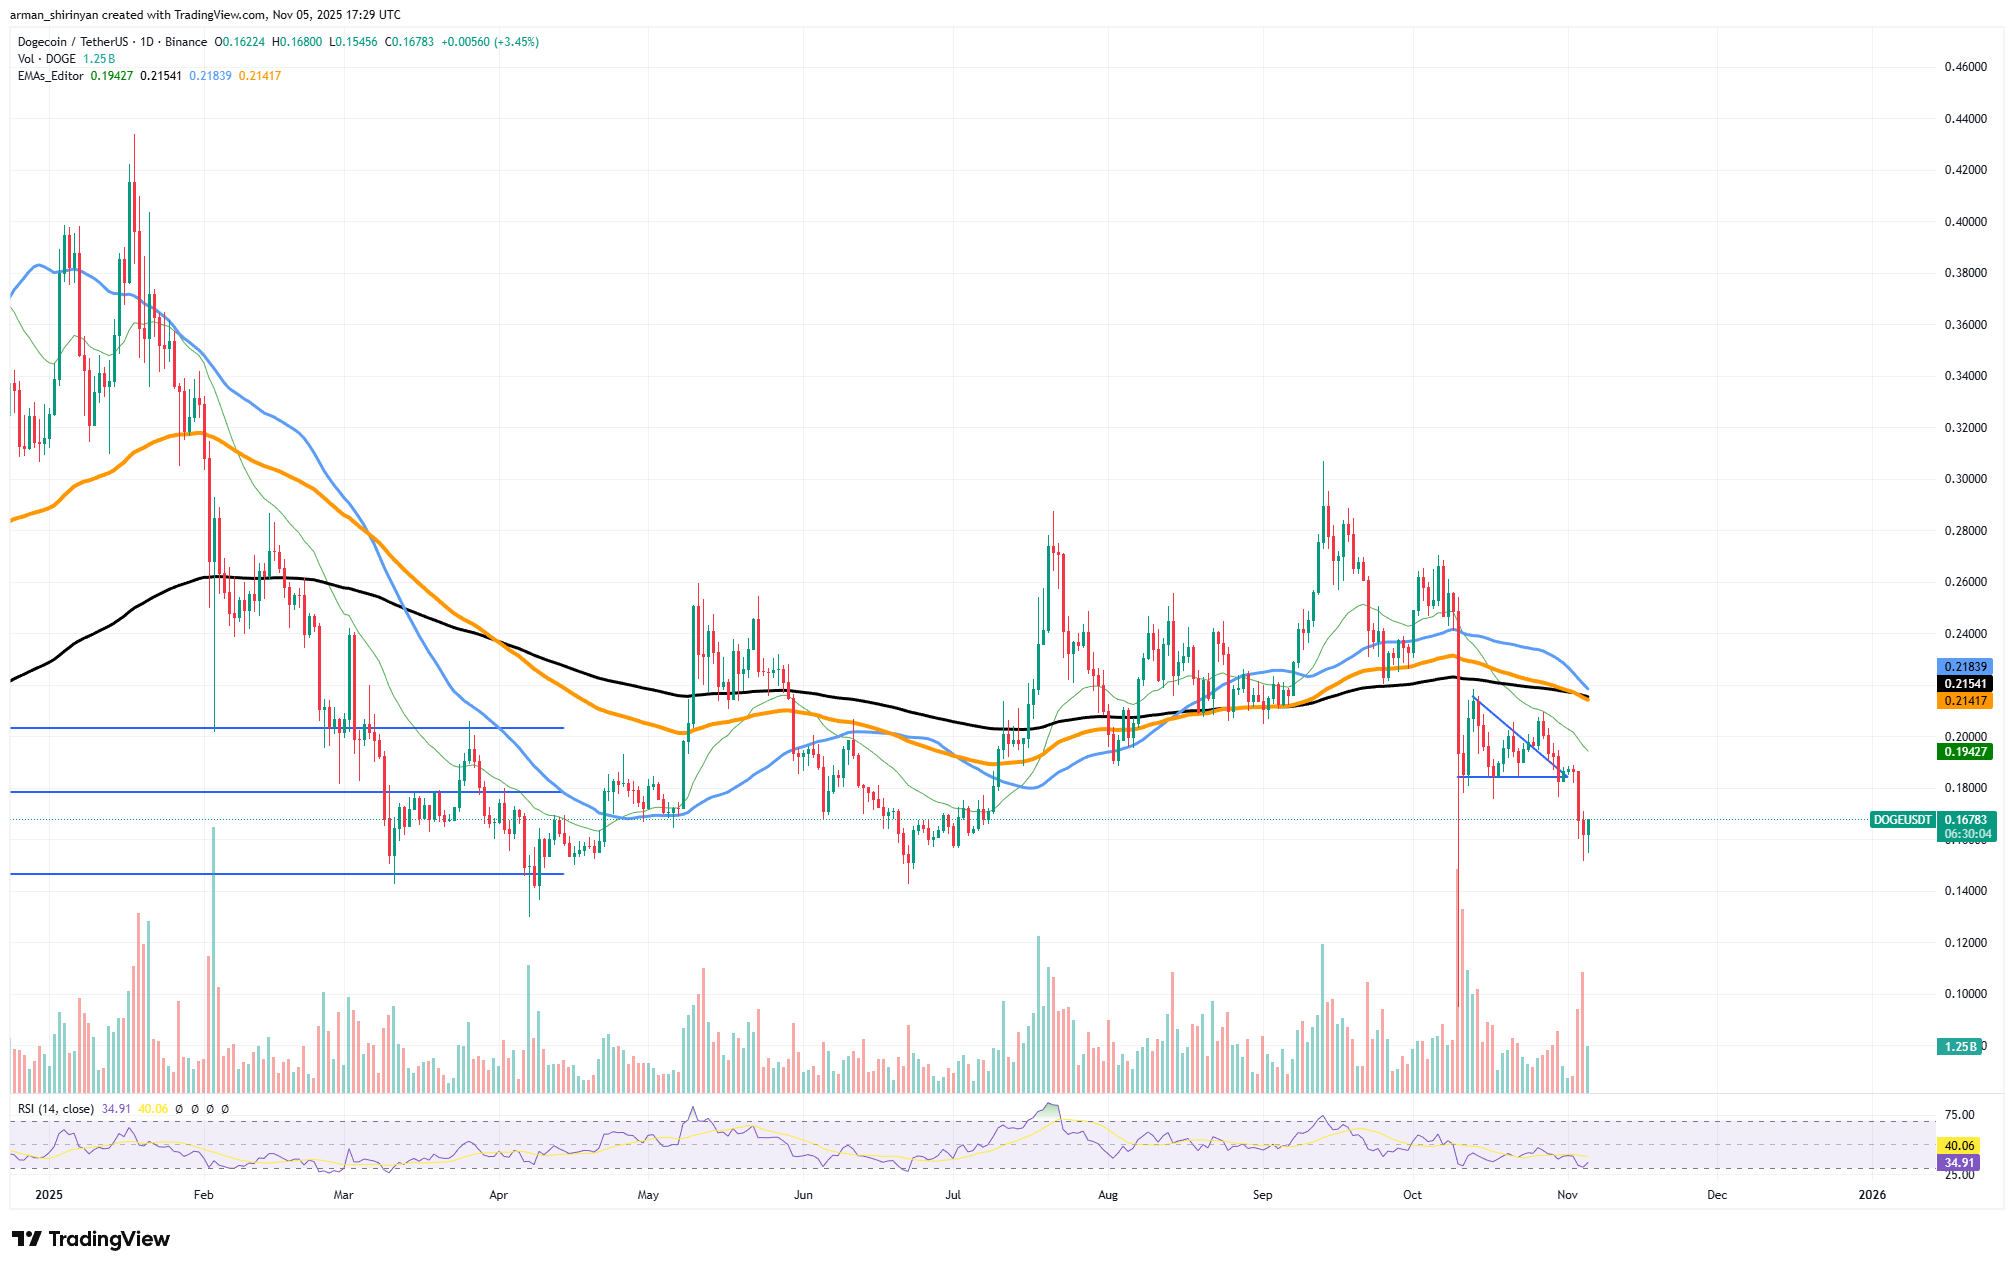
Since September, DOGE has been sliding downhill faster than a penguin on an ice slide. Currently trading at $0.165 (which is roughly the price of a slightly used gumball), it’s a far cry from its glory days above $0.30. The next “support” might as well be called the “please-don’t-drop-further” zone between $0.14-$0.15.
The RSI is at 39, which in crypto terms means “not quite dead yet, but definitely not feeling great.” The Death Cross is basically the market’s way of saying, “Abandon ship! 🚢🔥” Swing traders are already jumping out windows, and liquidity is drier than a desert in a drought.
Unless DOGE magically recovers $0.20 faster than Elon Musk can tweet something ridiculous, we’re looking at a bear market that could last until 2025-or until the heat death of the universe, whichever comes first. Buckle up, folks. It’s gonna be a bumpy ride 🎢.
Bitcoin vs. The $500 Million Sell Wall: A Battle of Epic Proportions ⚔️
Bitcoin is currently fighting a $500 million sell wall like a tiny knight trying to storm a castle guarded by dragons 🏰🐉. The psychological $100,000 support level? More like a soggy cardboard box in a rainstorm.
This monstrous sell wall is sitting on exchanges like a sumo wrestler at a buffet, gobbling up every attempt at recovery. Big holders who bought in at $90,000-$100,000 are cashing out faster than a blackjack player on a hot streak. Until this avalanche of sell orders disappears, Bitcoin might as well be trying to climb Mount Everest in flip-flops 🏔️👡.
The charts? Oh, they’re delightfully grim. Bitcoin has slipped below its 200-day moving average for the first time since early 2024-a bit like realizing your parachute isn’t opening mid-fall. The RSI is at 32.7, which means we’re not quite at “blood in the streets” levels, but we’re definitely seeing some light bruising.
Unless Bitcoin can claw its way back to $108,000 (good luck with that), the path of least resistance is straight down. Next stops? $98,000, then $92,000-or as we like to call them, “the places where dreams go to die” 💀.
Ethereum: The $3,000 Tightrope Walk 🤹
Ethereum has finally stopped freefalling like a drunk trapeze artist and is now wobbling precariously around $3,000. Will this level hold like a champ or collapse like a house of cards in a tornado? Place your bets!
ETH is still below its 50-day and 200-day moving averages-because why not add insult to injury? But hey, the RSI is at 30.6, which means ETH is officially in “oversold” territory (or as traders call it, “bargain bin” mode).
If ETH can hold $3,000 and bounce back to $3,800-$4,000, we might see a relief rally. But if it fails? Well, let’s just say $2,800 is looking like a cozy place to land-face-first 🛌💥.
Read More
- Off Campus Season 1 Soundtrack Guide
- 46 Years Later, The Mandalorian & Grogu Answers A Major Empire Strikes Back Question
- X-Men ’97 Finally Gave Gambit the Hero Moment He Deserved
- 10 Worst End-Game Couples In Sitcom History
- Chainsaw Man Volume 24’s Cover Art Reveals a Brand-New Denji
- HoI4 fans harsh reactions to the announcement of another DLC pack
- Hatsune Miku cosplayer goes viral selling $15 cups of “foot juice” to thirsty anime fans
- All Golden Ball Locations in Yakuza Kiwami 3 & Dark Ties
- Emily Henry Says to ‘Trust the Vision’ For Beach Read Adaptation
- DoorDash responds after customer uses AI to make food look bad and get a refund
2025-11-06 03:34