Oh, the drama unfolding in the world of cryptocurrency! Ethereum, that darling of the digital realm, is gearing up for a performance that would make even the most seasoned of actors blush. According to the enigmatic crypto technical analyst MasterAnanda, our beloved Ethereum is on the brink of a surge so epic, it would make the great bulls of Wall Street weep with envy.
For the past two months, Ethereum has been quietly consolidating its power above the $2,425 support zone, like a coiled serpent waiting to strike. But fear not, dear reader, for MasterAnanda’s analysis suggests that our digital hero is about to embark on its strongest bullish wave in years. The target? A minimum of $5,791, based on the 1.618 Fibonacci extension. Yes, you read that right – a minimum of $5,791!
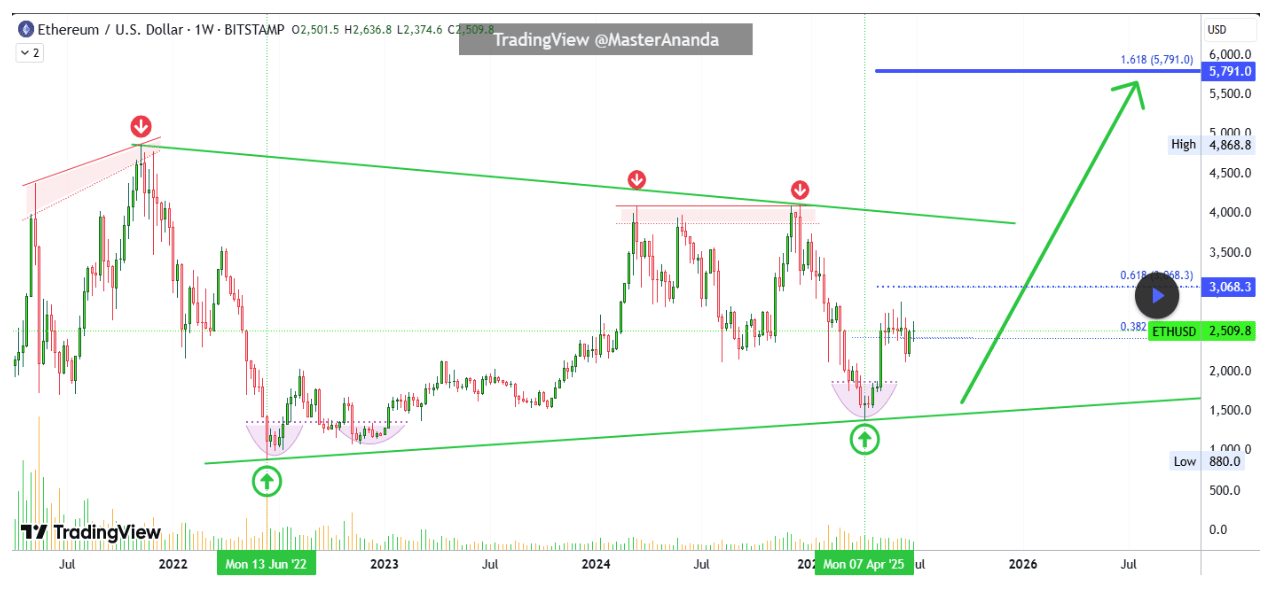
Ethereum: The $5,791 Minimum Target – A Tale of High Hopes and Lofty Dreams
MasterAnanda’s weekly candlestick chart reveals a large ETH wedge pattern with consistently rising lows from June 2022 to April 2025. Meanwhile, price highs have been relatively flat, specifically around the March and December 2024 peaks. Since April, Ethereum’s behavior has been marked by low volatility and sideways movement, which often precedes large market moves. The most interesting move was when its price dropped to as low as $1,470 on April 9 before quickly rebounding and establishing a rounded bottom formation.
But the analyst warns that Ethereum is due a major, major bullish wave. The question is not whether it will happen, but when it will. Now that the current consolidation is sitting right above trendline support, MasterAnanda argues that this formation will soon give way to a powerful bullish wave. The target is a minimum of $5,791, which is based on the 1.618 Fibonacci extension.

Interestingly, the analyst noted that it is possible for the Ethereum price to reach $8,500 or higher in the longer term if it breaks above the resistance trendline, which is currently at $4,000. This prediction is backed by improving fundamentals and current on-chain data showing accumulation through Spot Ethereum ETFs.
Wyckoff Accumulation: Ethereum’s Turn to Shine?
Crypto analyst Ted Pillows shared a separate but related analysis on the social platform X that’s based on a Wyckoff accumulation pattern playing out on ETH’s weekly chart. Pillows called the selloff to the $1,470 low in April as the “Spring” phase of Wyckoff accumulation, followed by a successful “Test” of a September 2024 support around $2,145, and the gradual move back to resistance now.
According to his projection, Ethereum’s breakout will unfold in stages. The first stage is a push to $3,000, then a correction, followed by a rise to $4,000 in Q3. Only after these steps will the parabolic leg truly begin. The parabolic leg, in this case, should take Ethereum above $5,700, if the price action plays out as predicted.
His analysis closely aligns with MasterAnanda’s call for a minimum $5,791 target. Just as the Wyckoff accumulation pattern pumped Bitcoin to its most recent all-time high, Ethereum may be on the verge of its own spotlight moment in this ongoing 2025 bull cycle.
At the time of writing, Ethereum is trading at $2,516.
Read More
- Who Is Harley Wallace? The Heartbreaking Truth Behind Bring Her Back’s Dedication
- 50 Ankle Break & Score Sound ID Codes for Basketball Zero
- 50 Goal Sound ID Codes for Blue Lock Rivals
- KPop Demon Hunters: Real Ages Revealed?!
- 100 Most-Watched TV Series of 2024-25 Across Streaming, Broadcast and Cable: ‘Squid Game’ Leads This Season’s Rankers
- Elden Ring Nightreign Enhanced Boss Arrives in Surprise Update
- Ultimate AI Limit Beginner’s Guide [Best Stats, Gear, Weapons & More]
- Lottery apologizes after thousands mistakenly told they won millions
- Mirren Star Legends Tier List [Global Release] (May 2025)
- How to play Delta Force Black Hawk Down campaign solo. Single player Explained
2025-07-06 21:42