The recent shift from a period of consolidation to an upward trajectory might just be the harbinger of a new rally phase. Or perhaps it’s merely a mirage, a fleeting illusion of hope in the vast desert of crypto despair. Is it time for altcoin season? Is Sei the best crypto to buy right now? Let’s dive into the mire and find out.
Market participants, those ever-so-savvy individuals who can predict the future with the same accuracy as a broken clock, are now fixated on critical support zones and technical formations that may—or may not—define SEI’s next direction. While the bullish bias remains, recent price action suggests a mixed bag of sentiments in the short term. 🤷♂️
Analysts Highlight Bullish Structure and Trade Setup
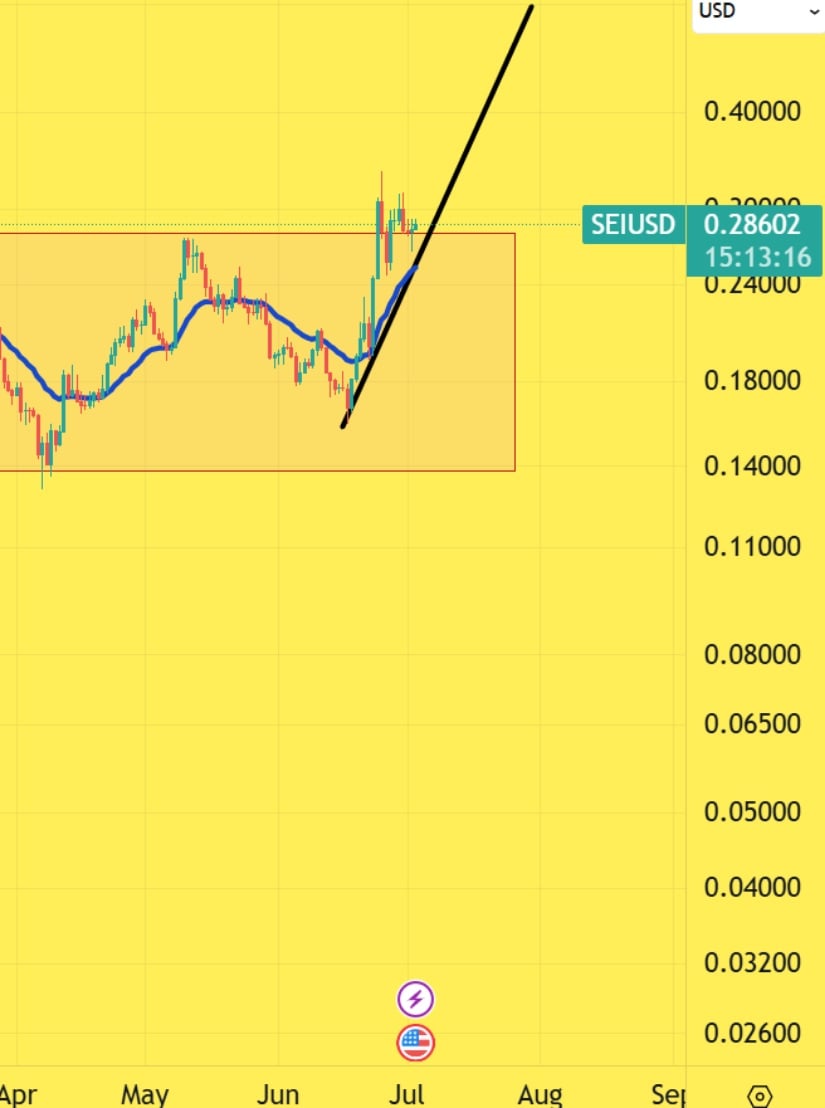
The SEI/USDT daily chart, a veritable masterpiece of technical analysis, shows a breakout above the long-standing consolidation range between $0.14 and $0.24, marking a notable technical milestone. Analyst @CryptoinfosTA, in a recent X post, labeled the formation as “BULLISH” with all the enthusiasm of a child on Christmas morning, citing the breakout as a structural shift away from the stagnation that persisted through April to late June.
As of the most recent chart capture, SEI was trading around $0.286, maintaining momentum following its breakout above the $0.24 resistance. A veritable triumph, one might say, if one were inclined to believe in such things.
In a separate post, analyst @core_crypto1 provided a scalp trading plan based on a symmetrical triangle pattern. The analysis identifies a potential entry between $0.270 and $0.276, with price targets at $0.30, $0.325, and $0.365. A stop-loss was recommended at $0.262, with leverage of 5x to 10x for risk-managed execution. A veritable recipe for disaster, or a path to riches, depending on your perspective. 🎯
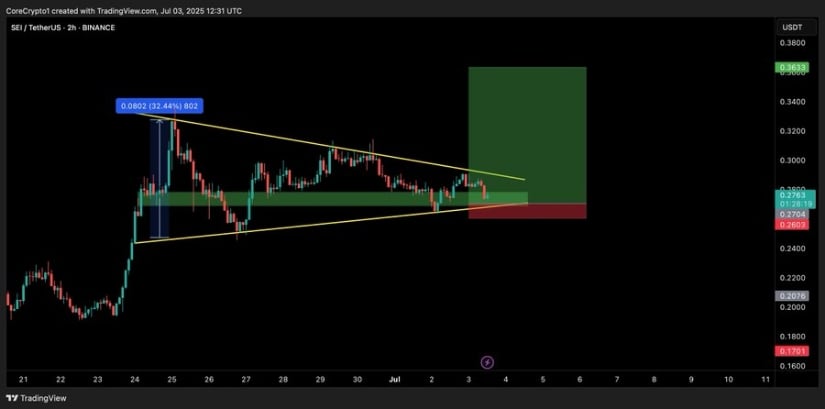
The triangle’s lower trendline support is acting as a potential rebound area, and if SEI respects this level, continuation toward the outlined targets becomes technically viable. Both analysts view the breakout as a signal for upside continuation, conditional on SEI holding above key support. A bit like hoping a leaky boat will stay afloat in a storm, but one must have faith, mustn’t one? 🌊
Market Data Reflects Short-Term Pressure Amid Structural Breakout
Data from Brave New Coin for the 24 hours ending July 4, 2025, paints a more cautious picture in the short term. SEI declined 7.09% over the session, falling from an intraday high near $0.285 to close at approximately $0.261. The downtrend was characterized by lower highs and lower lows, suggesting sustained selling interest. This followed a brief period of strength where SEI hovered above $0.280 before reversing, hinting at profit-taking or broader market weakness. A classic case of “buy the rumor, sell the news,” perhaps? 📉
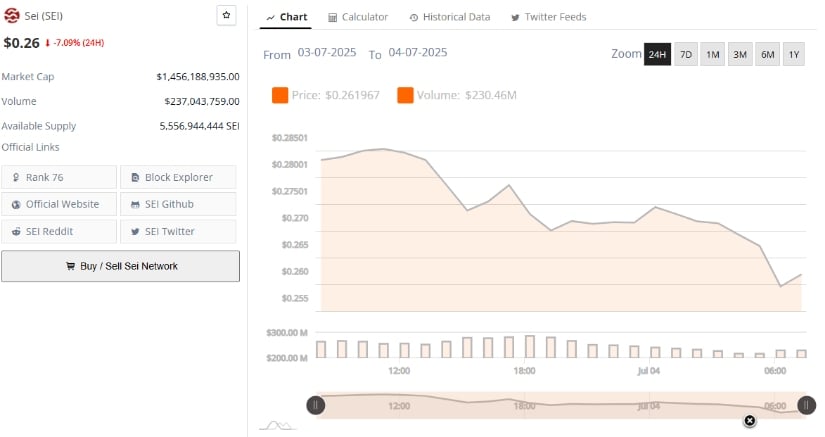
Trading volume reached $237.04 million, remaining stable without sudden spikes. The orderly decline indicates that the pullback was likely composed of controlled exits rather than panic-driven selling. SEI’s market capitalization stood at $1.45 billion, placing it at rank 76 globally. The consistent volume without major volatility suggests the recent loss may reflect positioning adjustments rather than a reversal of the broader trend. Immediate support lies around $0.255, which may play a pivotal role in determining the next price direction if buyers re-enter. A bit like a game of musical chairs, but with more charts and less dignity. 🎶
Momentum Indicators Suggest Weakening Strength at the Time of Writing
As of July 4, 2025, SEI was trading at $0.2634, reflecting a daily loss of 3.20%. The token remains under pressure after reaching highs above $0.31 in late June. Candlestick formations on the daily chart show lower closes and reduced buyer commitment, pointing to a short-term bearish shift. Key support near the $0.255–$0.260 zone may be tested again if the current trend continues without renewed interest from bulls. A bit like a bull in a china shop, but with less destruction and more indecision. 🏭
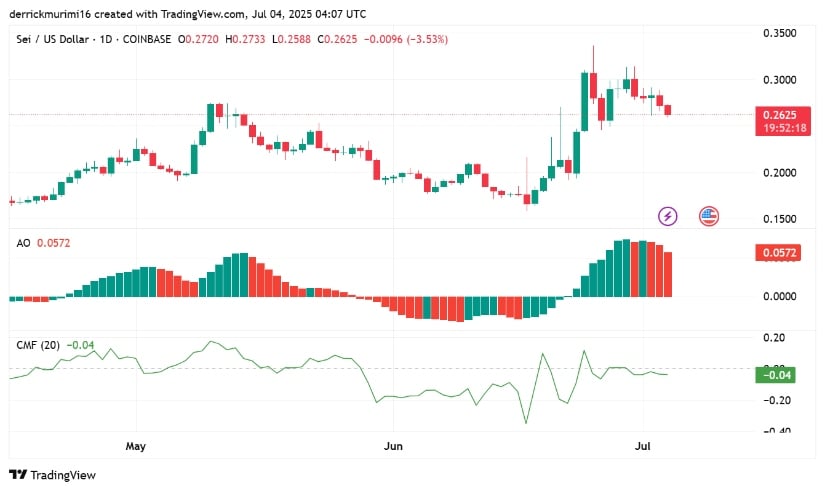
Technical indicators add weight to this cautious view. The Awesome Oscillator (AO) has shifted to red bars, printing a value of 0.0572, indicating fading bullish momentum. Although still above the zero line, the loss of upward momentum could result in a bearish crossover if current trends persist. The Chaikin Money Flow (CMF) reads -0.04, slightly below neutral, signaling modest capital outflows. While not a deep negative value, it shows that sellers currently have a slight edge. A reversal in both indicators would be needed to re-establish strong bullish control, particularly if SEI intends to challenge the $0.30 psychological level again. A bit like trying to climb a greased pole, but with more charts and less grease. 🤹♂️
Read More
- Who Is Harley Wallace? The Heartbreaking Truth Behind Bring Her Back’s Dedication
- 50 Ankle Break & Score Sound ID Codes for Basketball Zero
- Here’s Why Your Nintendo Switch 2 Display Looks So Blurry
- 100 Most-Watched TV Series of 2024-25 Across Streaming, Broadcast and Cable: ‘Squid Game’ Leads This Season’s Rankers
- 50 Goal Sound ID Codes for Blue Lock Rivals
- Elden Ring Nightreign Enhanced Boss Arrives in Surprise Update
- How to play Delta Force Black Hawk Down campaign solo. Single player Explained
- Jeremy Allen White Could Break 6-Year Oscars Streak With Bruce Springsteen Role
- MrBeast removes controversial AI thumbnail tool after wave of backlash
- KPop Demon Hunters: Real Ages Revealed?!
2025-07-04 22:53