Brace Yourselves: Bitcoin‘s Latest Circus Act! 🎪
- Whale activity has surged by a staggering 1,363% in a mere week, while outflows have plummeted by 61.63% — because nothing screams stability like a whale-sized appetite for more riches.
- The NVT Ratio took an 11.48% nosedive, whereas the Stock-to-Flow Ratio vaulted by 33.34%. It’s a bullish divergence — basically a financial game of ‘Who’s on First?’
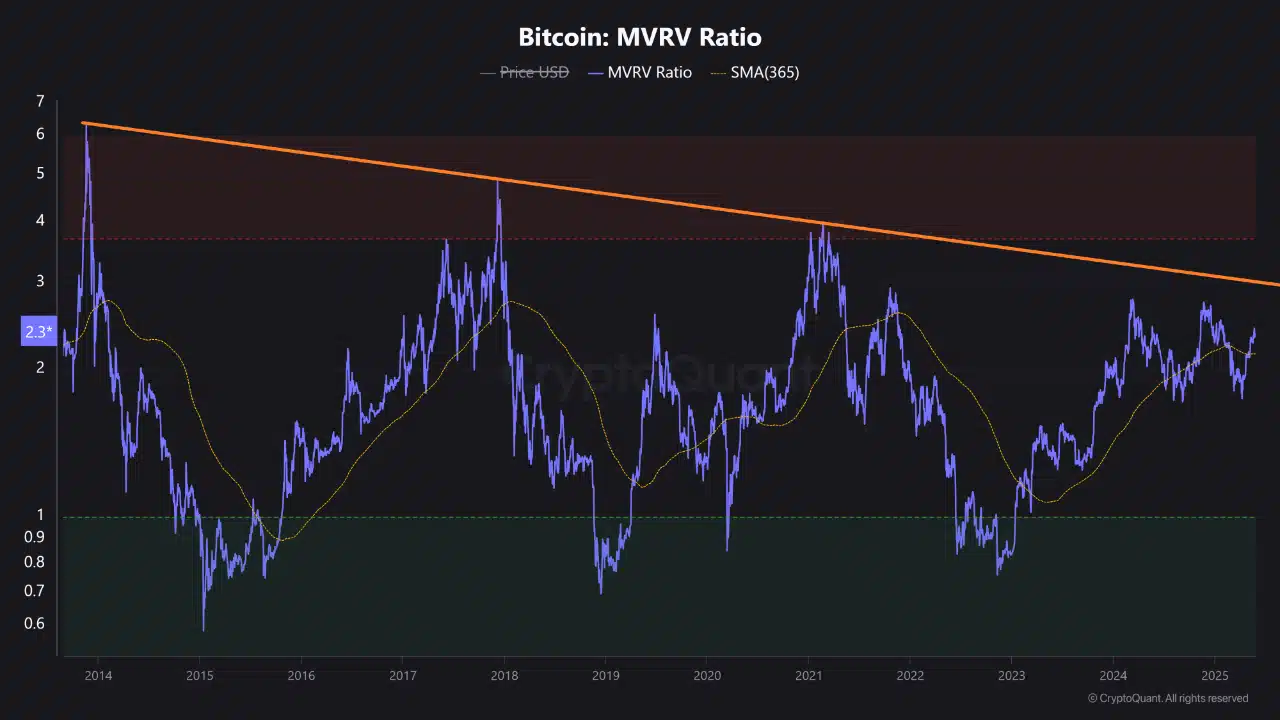
Bitcoin [BTC], that capricious digital gold, has broken above its 365-day MVRV SMA at 2.36 — a truly *historic* milestone (cue the fireworks). This level has a habit of spurring dramatic price upswings, reminiscent of April’s glory days when BTC leapt from $94K to $111K after a similar breakout — as if it were a mood ring for market fortunes.
This suggests the long-term holders are finally in the profit zone — or, at least, pretending to be, which is probably the same thing. Optimism is in the air. Well, until it isn’t.
At press time, BTC hovers around $108,864 — down a negligible 0.80%. Keep the champagne on ice; remaining above the SMA365 might kick off a bullish phase, provided the buyers remember to buy and not just tweet about it.
BTC NVT Ratio Tumbles -11.48%, While Supply Tightens!
Metrics from on-chain chatter depict a puzzle wrapped in an enigma. The NVT ratio, that notoriously fickle measure of transaction volume versus market cap, has fallen a handsome 11.48%, hinting that transactions are growing faster than the market’s overall worth — a bullish sign, or so we hope.
Meanwhile, the Stock-to-Flow ratio, that darling of the Bitcoin maximalists, soared 33.34%, indicating you should probably be panic-buying if you haven’t already — supply is getting tighter than a pair of new jeans.
In short: demand is surging, supply is shrinking, and the two are having a rather dramatic romantic comedy. Or tragedy.

Whale activity has transitioned from the ‘Hoarders Anonymous’ phase to the ‘Accumulation Fiesta’. Weekly large holder inflows spiked a jaw-dropping 1,363%, while outflows diminished by 61.63%. Over the past month, inflows exploded by over 4,112% — because who doesn’t love a good accumulation story?
They’re not just day-trading adventurers; they’re strategizing for the long haul, or perhaps just hoarding Bitcoin for a rainy day that’s been postponed indefinitely.

Price Pressure Zones: $104K–$107K Longs and $110K–$113K Shorts — Chaos Ensues
Data from Binance shows a dense cluster of long liquidations lurking between $104K and $107K — like a trap set by a nervous trader. Conversely, short liquidations loom just above at $110K–$113K, ready to be triggered if fortunes turn.
Currently sitting at around $108.8K, Bitcoin finds itself in a no-man’s land of potential chaos. One sharp movement could trigger a cascade of forced liquidations — a spectacle worthy of any soap opera.
If the buyer brigade retains the momentum and pushes past $110K, expect a short squeeze to light up the charts like a Christmas tree. Meanwhile, retail traders—those eternally bearish enthusiasts—remain convinced it’s all a massive scam. (Spoiler: they’re probably right.)

Stochastic RSI Hits Rock Bottom at 16.03 — Could Reversal Be Brewing?
On the technical front, Bitcoin is still trending upward but is consolidating beneath the elusive $112K barrier. The Stochastic RSI, that whimsically named indicator, has plunged to 16.03 — the sort of oversold reading that usually signals an impending rebound (or a minor catastrophe).
The 9/21 Moving Average crossover continues to whisper sweet nothings about bullish continuation, provided the price stays above $106K. But volume and momentum are waving a polite farewell, awaiting some catalyst of significance.
Brace yourselves: a decisive breakout or rejection at $112K could determine whether this is the beginning of Bitcoin’s next glorious chapter or just another elaborate game of ‘chicken.’

Will the Breakout Be the Real Deal or Just a Prank?
Bitcoin’s recent breakout above its 365-day MVRV average, coupled with rising whale inflows and a plunging NVT ratio, hints at bullish enthusiasm — or at least a convincing masquerade.
Yet, don’t get too comfortable: dense liquidation zones and the ever-present bearish retail sentiment add a dash of volatility to the recipe. If buyers push over $110K with volume to spare, a rally towards $113K–$115K could be set in motion — or not.
Failing that, a rejection near current levels might send it tumbling back to $104K–$107K, as traders cry into their keyboards. The metrics are leaning toward optimism, but momentum remains the unpredictable guest at this circus.
Read More
- Who Is Harley Wallace? The Heartbreaking Truth Behind Bring Her Back’s Dedication
- 50 Ankle Break & Score Sound ID Codes for Basketball Zero
- 50 Goal Sound ID Codes for Blue Lock Rivals
- 100 Most-Watched TV Series of 2024-25 Across Streaming, Broadcast and Cable: ‘Squid Game’ Leads This Season’s Rankers
- KPop Demon Hunters: Real Ages Revealed?!
- Basketball Zero Boombox & Music ID Codes – Roblox
- How to play Delta Force Black Hawk Down campaign solo. Single player Explained
- Lottery apologizes after thousands mistakenly told they won millions
- Umamusume: Pretty Derby Support Card Tier List [Release]
- Ultimate AI Limit Beginner’s Guide [Best Stats, Gear, Weapons & More]
2025-05-28 17:48