Well, well, well, look who’s back at it again! Bitcoin, the crypto that never sleeps, is doing its usual dance, with a little twist, of course. On April 30, BTC decided to take a little tumble, dipping to a mere $93,000. But hey, don’t panic just yet, because it bounced right back up to $95,000 like a champ! 🤑
Now, here’s the juicy part – it all started with a dramatic outflow from US-listed Bitcoin ETFs. Yes, you heard it right, the first outflow in two weeks! The net outflow was a whopping $56.23 million, thanks to the magical power of Fidelity’s FBTC and Ark & 21Shares’ ARKB. They were just trying to stop the $267 million inflow from BlackRock IBIT. Oh, the drama! 😏
But This means large holders, aka whales, are scooping up BTC like it’s going out of style. From April 13 to 27, over 43,100 BTC were grabbed by these deep-pocketed players. That’s not pocket change, folks! 🐋
The #Bitcoin $BTC Accumulation Trend Score is nearing 1, signaling that larger entities, or a significant portion of the network, are actively accumulating.
— Ali (@ali_charts) April 30, 2025
Speaking of whales, BlackRock’s IBIT was on a shopping spree, picking up more than 25,430 BTC worth around $2.4 billion in just a week! Their BTC stash now sits at a staggering 601,209 BTC. Talk about a crypto hoarder. 💰
BlackRock (IBIT) accumulated 25,430 $BTC($2.37B) over the past 7 days, bringing its total holdings to 601,209 $BTC($56.11B).
— Lookonchain (@lookonchain) April 30, 2025
Meanwhile, the long-term holders seem to be in a bit of a “denial” phase. Classic! The Net Unrealized Profit/Loss (NUPL) is showing these holders as uncertain – probably wondering if it’s time to sell or just sit back and wait for the big bang. 🤷♂️
According to the NUPL metric, long-term #Bitcoin $BTC holders are currently in the “denial” phase!
— Ali (@ali_charts) April 30, 2025
But don’t worry, folks, analysts are still wearing their rose-colored glasses. Martinez is all about the MVRV ratio testing the 1-year Simple Moving Average (SMA). If it crosses above, we could be in for some serious fireworks. 💥
#Bitcoin $BTC momentum could shift bullish once the MVRV crosses above its 1-year SMA. A golden cross that historically signals strong upside potential.
— Ali (@ali_charts) April 30, 2025
And if that happens? Oh, you’d better believe BTC could be making a run for $114,230 – the next big target on the MVRV radar. Hold onto your hats, folks, this rollercoaster is far from over. 🎢
Btc Price Outlook
Let’s take a quick peek at the daily BTC price chart, shall we? The RSI is hanging out near 66, which means we’re cruising in strong territory, but don’t get too comfy. If BTC can’t hold above $93,198, we could be looking at a deeper dip to around $83,444. Yikes! 😬
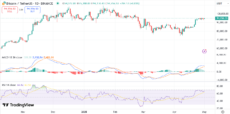
BTC price chart | Source: TradingView
And here’s the thing – the MACD is still in bullish territory, with the MACD line above the signal line. But, just to keep us on our toes, the histogram is starting to flatten. Uh-oh. If this momentum fizzles out, we could be in for some snooze-worthy consolidation. 😴
#Bitcoin $BTC is testing its Realized Warm Supply at $94,550, holding above it could signal mid-term holder support.
— Ali (@ali_charts) May 1, 2025
But don’t despair! BTC is holding strong above the Realized Warm Supply level of $94,550, which could indicate support from mid-term holders. If BTC can close above $95,870, we might just see a glorious sprint toward $100,000 and beyond. 🚀
Read More
- 50 Ankle Break & Score Sound ID Codes for Basketball Zero
- Stellar Blade Update 1.011.002 Adds New Boss Fight, Outfits, Photo Mode Improvements
- 50 Goal Sound ID Codes for Blue Lock Rivals
- Stellar Blade x Nikke DLC: Full Walkthrough | How to Beat Scarlet + All Outfit Rewards
- League of Legends: Bilibili Gaming’s Epic Stomp Over Top Esports in LPL 2025 Playoffs
- Complete Steal A Brainrot Beginner’s Guide
- Lucky Offense Tier List & Reroll Guide
- How to use a Modifier in Wuthering Waves
- League of Legends MSI 2025: Full schedule, qualified teams & more
- Ultimate Half Sword Beginners Guide
2025-05-01 15:05