Bitcoin’s price has dropped below $75,000, as increased selling and general market nervousness are challenging its recent attempt to recover. While the price drop is worrying by itself, one analyst at CryptoQuant has found something in exchange data that suggests this moment is similar to patterns seen throughout the last six years of Bitcoin’s price history.
Currently, there are about 2.67 million Bitcoin held in exchange wallets. Interestingly, this is the same amount that was held back in August 2019, when Bitcoin’s price was around $9,430. Today, Bitcoin is trading near $77,300 – roughly eight times higher than it was then, despite the same amount of Bitcoin being available on exchanges.

This comparison raises a key question: when exchange reserves show the same number at vastly different prices, it indicates fundamentally different market conditions. These differences include who’s participating, the level of institutional involvement, the rules in place, and how activity happens on the blockchain – even though the actual amount of supply remains constant. Essentially, everything else about those two points in time is different.
A CryptoQuant analyst combines exchange reserve data with a ‘Bull-Bear Market Cycle Indicator’ to get a more complete picture. This second indicator helps determine the context of the reserve levels – whether the same amount of cryptocurrency held in reserves means the same thing now as it did in the past, like comparing 2026 to 2019.
Same Supply Level But Two Very Different Market Regimes
A recent CryptoQuant analysis compared exchange reserves and highlighted a significant difference between past and present conditions. In August 2019, their Bull-Bear Market Cycle Indicator was strongly positive (+0.83, with a 30-day average of +1.045), indicating strong demand and confirming that decreasing Bitcoin supply on exchanges was meeting genuine buyer interest. This meant that the market structure at the time supported the idea that limited supply would drive up prices.

As of May 2026, this indicator stands at -0.379. Its recent 30-day average is -0.375, while the year-long average is -0.323. Current exchange reserves are at the same level as they were in 2019, but the economic conditions surrounding them are now reversed.
This report uses a clear and focused approach to analysis. While falling foreign exchange reserves limit the immediate supply of goods, this isn’t enough on its own to raise prices. There needs to be increased demand to meet that limited supply before prices will actually go up. In 2019, strong market conditions confirmed that demand was present. However, as of 2026, that demand hasn’t materialized yet.
The biggest difference between the current situation and past comparisons of Bitcoin reserves is the introduction of spot Bitcoin ETFs. Approved in January 2024, these ETFs represent a brand new source of demand that didn’t exist in 2019. Since their approval, ETF inflows have consistently reduced the overall Bitcoin reserves. This new, consistent buying pressure fundamentally alters the demand dynamics, making comparisons to 2019 incomplete.
The market is currently trying to determine if enough demand for Bitcoin ETFs can offset the limited supply. The answer to this question will likely determine where Bitcoin’s price goes next, and whether the Bull-Bear Indicator will confirm sustained demand.
Bitcoin Bears Retake Short-Term Control
Bitcoin has dropped below $75,000, signaling a weakening of its recent upward trend. It’s been facing difficulty breaking through the $80,000-$82,000 level for weeks. The latest price action suggests the market is shifting from a period of stability back to a selling trend, with sellers now in control after several unsuccessful attempts to push the price higher in May.
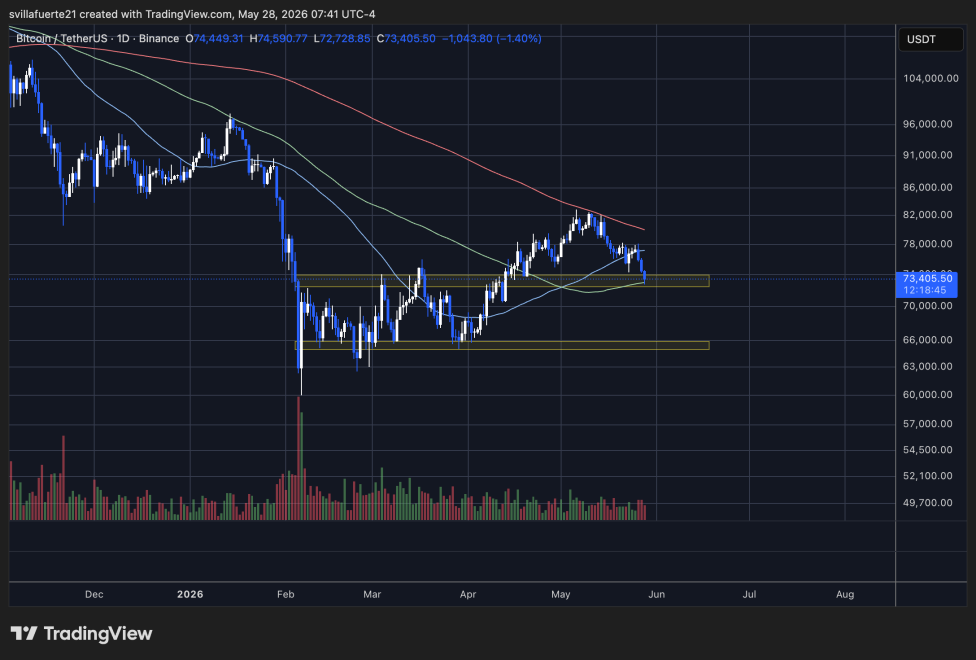
Bitcoin’s recent drop below the $73,500–$74,000 support level is a significant negative sign. This price range had been key to the price increase in April and coincided with a rising trendline, making it a crucial support area. Now that Bitcoin is trading below this level, and the 50-day moving average is starting to decline again after a short period of stability, it suggests further weakness.
Bitcoin’s price was pushed down after it failed to break through a key technical level around $80,000, confirming ongoing weakness in the overall market. Buyers couldn’t sustain a recovery, and once some initial support levels were broken, the price fell more quickly.
The next key price level to watch is between $65,000 and $66,000. This is where buyers stepped in strongly during the price drop in February. We’re also seeing a small increase in trading volume as prices fall, which could mean more people are starting to get involved as uncertainty grows.
If Bitcoin doesn’t soon rise back above $74,000, it’s more likely to continue falling and experience ongoing price swings, rather than quickly bouncing back.
Read More
- Off Campus Season 1 Soundtrack Guide
- X-Men ’97 Finally Gave Gambit the Hero Moment He Deserved
- Chainsaw Man Volume 24’s Cover Art Reveals a Brand-New Denji
- 46 Years Later, The Mandalorian & Grogu Answers A Major Empire Strikes Back Question
- HoI4 fans harsh reactions to the announcement of another DLC pack
- 10 Worst End-Game Couples In Sitcom History
- DoorDash responds after customer uses AI to make food look bad and get a refund
- Dragon Quest II HD-2D Remake: Where to get the Magic Key
- Emily Henry Says to ‘Trust the Vision’ For Beach Read Adaptation
- Hatsune Miku cosplayer goes viral selling $15 cups of “foot juice” to thirsty anime fans
2026-05-29 08:12