In April 2026, Ethereum sits at a jaunty $2,255.04, a 7.09% advance on the monthly ledger, after testing the $2,017.09 trough and, with the obstinacy of a curate on market day, clinging to the ascending trendline that has bound Ethereum’s vicissitudes since 2019. The MACD histogram, that modest barber’s chair of momentum, has finally turned positive at 129.89, the first sign of encouragement since the 2025 descent from the lofty $4,800 summit.
the SMA 50 at $2,440.86 is the nearest resistance and the SMA 20 at $2,857.71 lies further above. The April candle shows a long lower wick against the trendline, a candlestick flourish that historically signals demand absorption at a structurally significant level.
The Time-Honoured Trendline Holds, as the MACD Finds a Jovial Turn
The ascending support trendline on the monthly chart binds Ethereum’s bear-market lows from 2019, the 2020 pre-rally base, and the 2022 cycle bottom, making it the deepest and most tested bulwark in Ethereum’s price history. The $2,017.09 monthly wick represents the sternest test of that line in the current correction, and it has withstood without a monthly close beneath it. Price has since recovered to the $2,255 region, a positive monthly body above the trendline, as if to say, “Carry on, old man, the pace improves.”
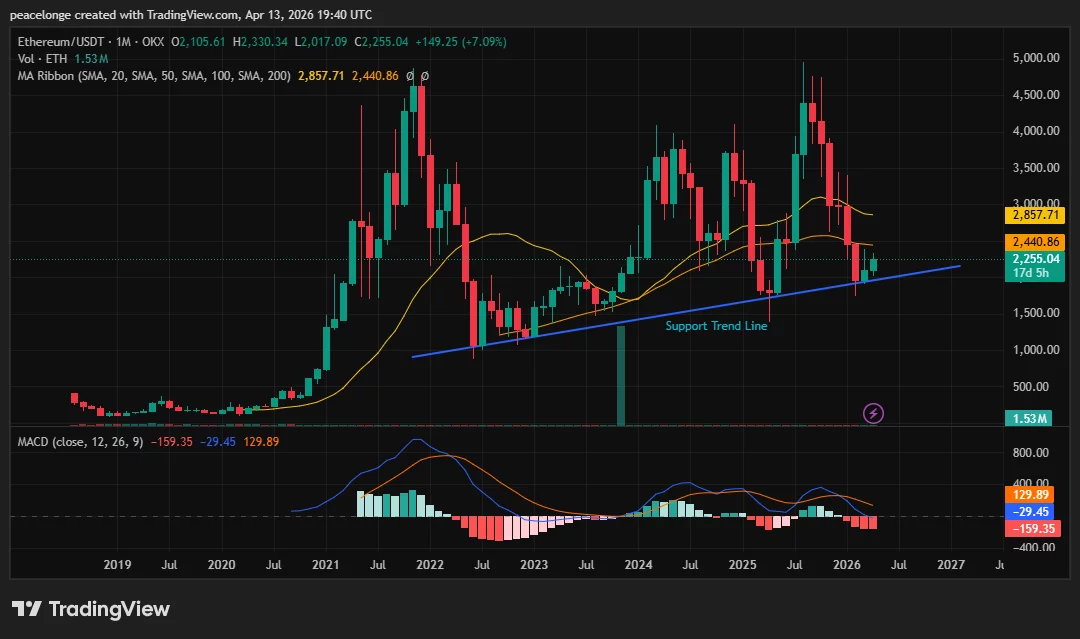
The monthly MACD (12,26,9) offers the crucial secondary signal. The MACD line at -29.45 sits 129.89 points above the signal at -159.35, producing a positive histogram. While both lines remain in negative territory, indicating the macro trend has not reversed, a histogram turning positive at a multiyear trendline test is consistent with momentum inflecting before price does on the longer timeframe. This is the first positive monthly histogram reading since Ethereum’s descent accelerated from its August 2025 high near $4,800.
Crypto analyst Leshka wrote on X that ETH “will 3x-4x in the next six months,” pointing to a supply squeeze developing on centralized exchanges as evidence of a structural base forming at the trendline, a view that gains more technical grounding with the monthly MACD now confirming improving momentum.
Key Levels: Support, Resistance, and Price Targets
The multiyear ascending trendline, currently intersecting around $2,000 to $2,100, is the structural floor on a monthly closing basis. The $2,017.09 monthly low is the concrete level to hold: a monthly close below it breaks the trendline and exposes $1,500, which aligns with the 2023 accumulation zone and represents the last major demand area before untested territory.
On the upside, the SMA 50 at $2,440.86 is the immediate recovery target. A monthly close above it shifts the SMA ribbon from fully bearish and begins reclaiming the moving average structure. The SMA 20 at $2,857.71 is the extended objective and represents a return toward where both SMAs converged before the 2025 breakdown.
Invalidation: a monthly close below $2,017.
On-Chain and Market Data Context
Perpetual futures on Ethereum showed a slightly positive funding rate as of April 12, indicating measured but persistent long-side demand is returning. The Ethereum Foundation staked 45,000 ETH on April 5, nearing a target of 70,000 ETH, reducing immediate circulating sell pressure while generating an estimated $3.9 to $5.4 million annually in yield. Whales withdrew over 120,000 ETH from centralized exchanges in early March, the largest outflow since October 2025, per CryptoQuant contributor Arab Chain, a pattern consistent with accumulation near structural support.
Upgrade Pipeline Provides Forward Catalyst
Ethereum’s Glamsterdam upgrade, scheduled for H1 2026, targets a significant increase in the gas limit, parallel transaction execution, and enshrined proposer-builder separation. The upgrade continues the scalability work started by the Fusaka hard fork and is expected to materially reduce Layer-2 transaction costs, strengthening the fundamental case for ETH at current prices.
If Ethereum holds the multiyear trendline on a monthly close basis and the MACD histogram continues to expand, the SMA 50 at $2,440 is the first recovery target, with the SMA 20 at $2,857 as the extended bull case. A monthly close below $2,017 breaks the trendline and shifts the macro structure bearish.
Read More
- Off Campus Season 1 Soundtrack Guide
- X-Men ’97 Finally Gave Gambit the Hero Moment He Deserved
- Chainsaw Man Volume 24’s Cover Art Reveals a Brand-New Denji
- 46 Years Later, The Mandalorian & Grogu Answers A Major Empire Strikes Back Question
- 10 Worst End-Game Couples In Sitcom History
- HoI4 fans harsh reactions to the announcement of another DLC pack
- Gold Rate Forecast
- DoorDash responds after customer uses AI to make food look bad and get a refund
- Emily Henry Says to ‘Trust the Vision’ For Beach Read Adaptation
- Dragon Quest II HD-2D Remake: Where to get the Magic Key
2026-04-14 03:57