Bitcoin (BTC), that slippery digital rascal, clung desperately to $67,900 on April 1-as if hanging from a ledge with buttered fingers-after a last-minute ETF rescue swooped in to save it from what would have been its third rather embarrassing tumble on the 8-hour chart.
The rescue arrived at the exact moment the 20-period Exponential Moving Average (EMA)-a rather serious-looking line that traders stare at like it’s a crystal ball-was about to collapse. But don’t be fooled just yet. The Coinbase Premium Index has sulked to its grumpiest negative level this year, and a sneaky bearish signal on the RSI is quietly whispering, “This might not end well unless $68,130 is properly reclaimed.”
Late-March ETF Heroics Save the Day (Sort Of)
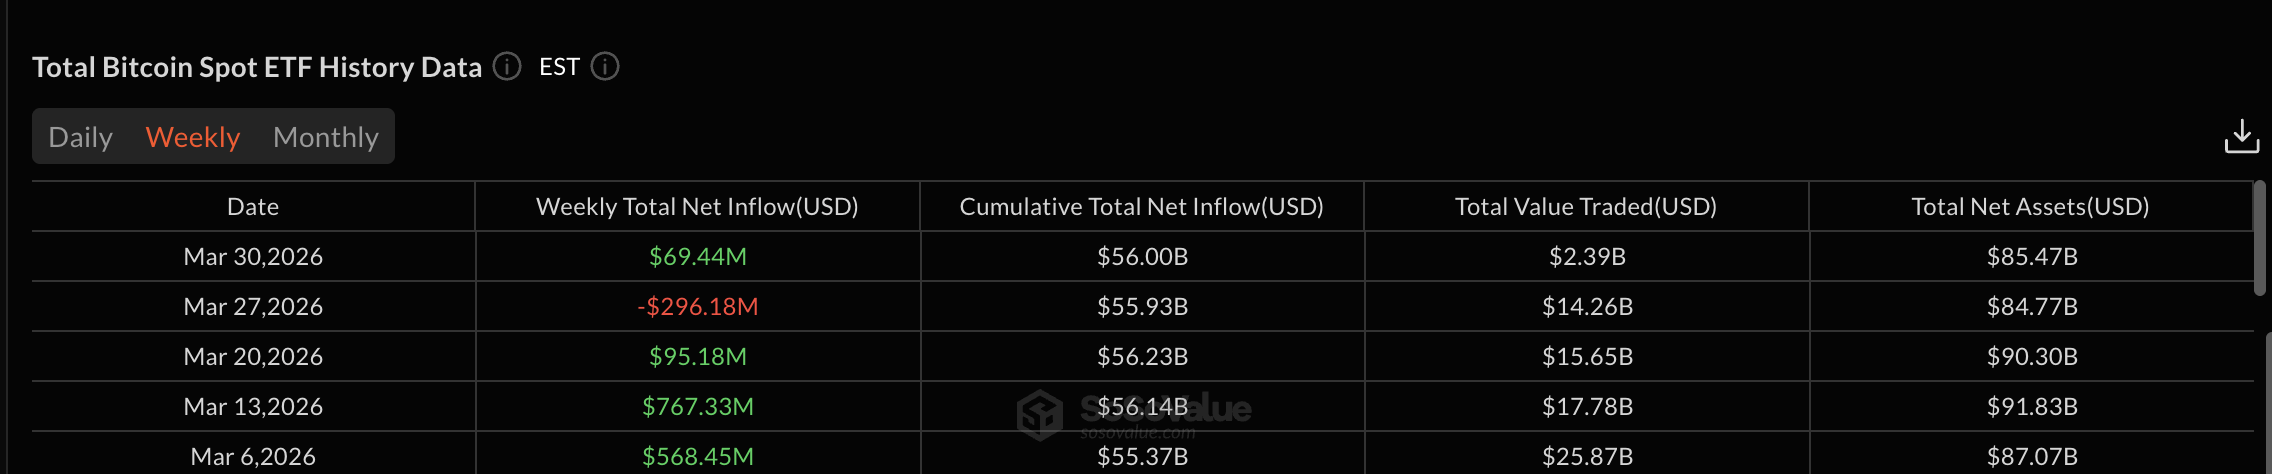
Bitcoin spot ETFs gobbled up around $1.2 billion in March, which sounds impressive-until you peek behind the curtain and discover a bit of chaos near the end.
The early weeks were positively gluttonous. March 6 brought in $568.45 million, and March 13 followed with a whopping $767.33 million. Then, like a child after too much cake, things slowed dramatically. By March 20, inflows shrank to a measly $95.18 million. And then-oh dear-the week of March 27 turned red with a dreadful -$296.18 million, sending nerves jangling.
But just when things looked rather grim, the final days of March staged a dramatic comeback. The week of March 30 scraped together $69.44 million, flipping things back into the green. It was a bit like tidying your room five minutes before guests arrive-technically acceptable, but everyone knows what happened earlier.
This last-minute rescue happened exactly when buyers decided to defend a crucial price level, like knights guarding a slightly wobbly castle wall.
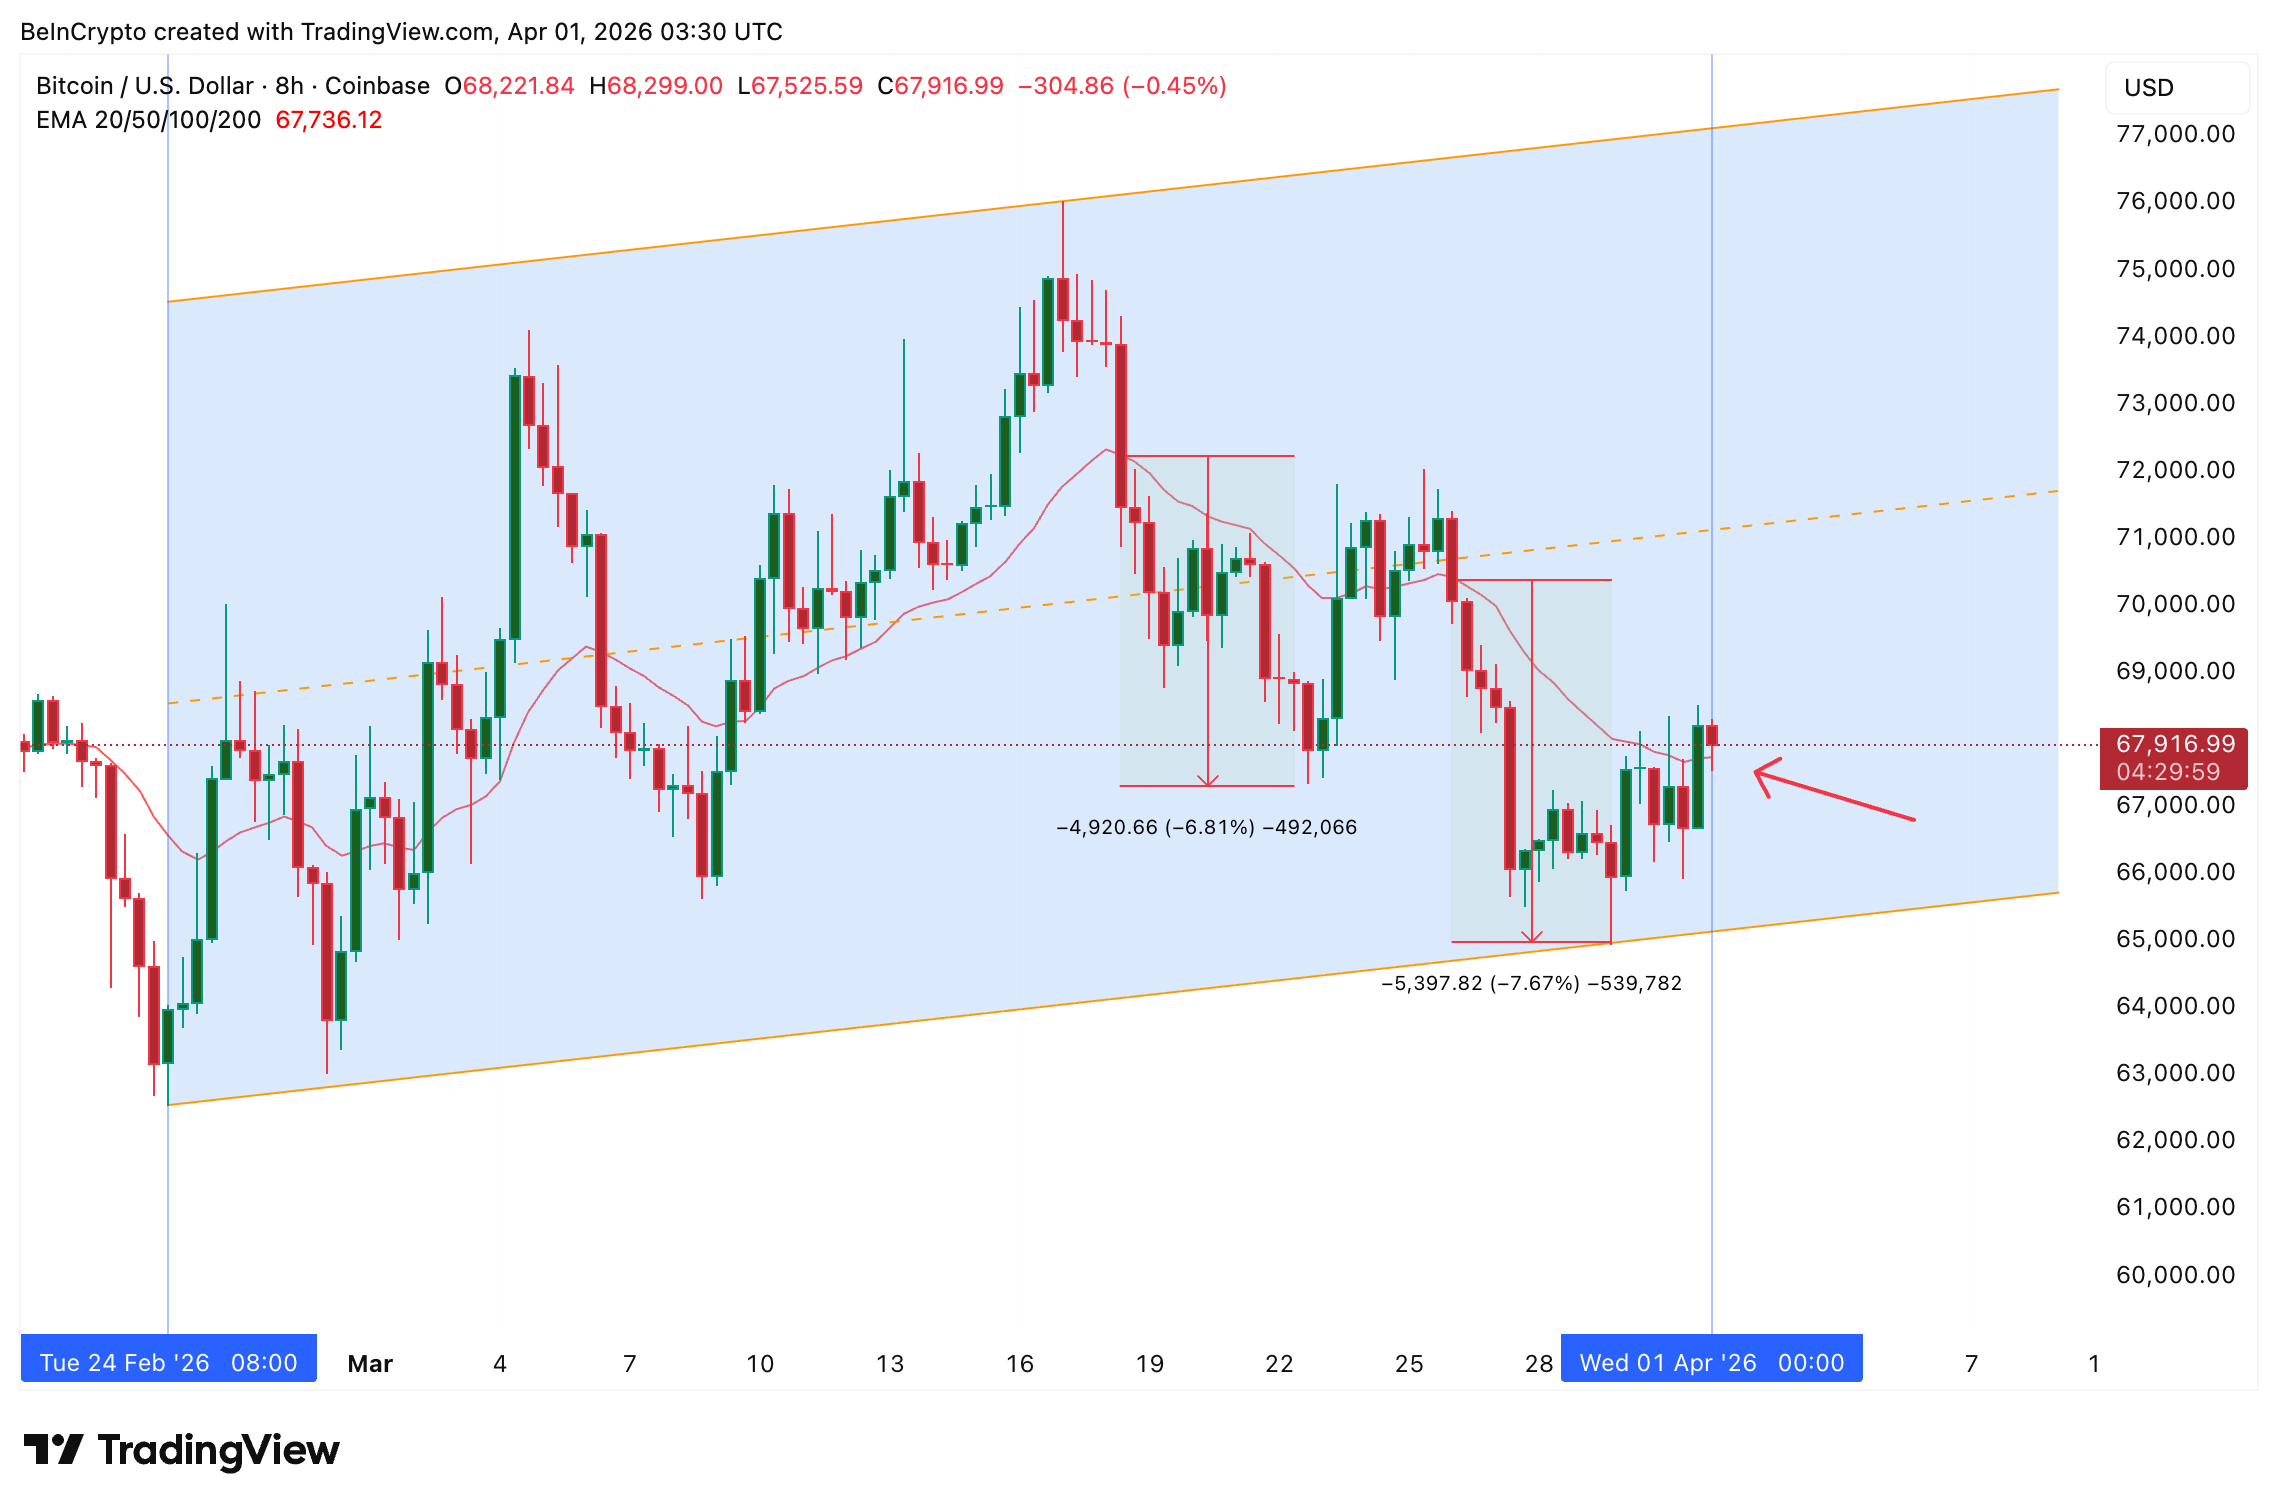
On the 8-hour chart, BTC has been marching upward in a neat little channel since February 24. The 20-period EMA currently sits at $67,730. The last two times Bitcoin slipped below it, the results were not pretty: a 6.81% drop on March 18 and a 7.67% tumble on March 26.
This time, however, BTC dipped below the line only briefly before scrambling back up again-rather like someone tripping on the stairs but pretending they meant to do that. The timing, conveniently aligned with ETF inflows turning positive, suggests some very large, very serious buyers stepped in to stop the fall.
Still, saving one level doesn’t mean the whole house isn’t wobbling.
The Coinbase Crowd Is Not Impressed
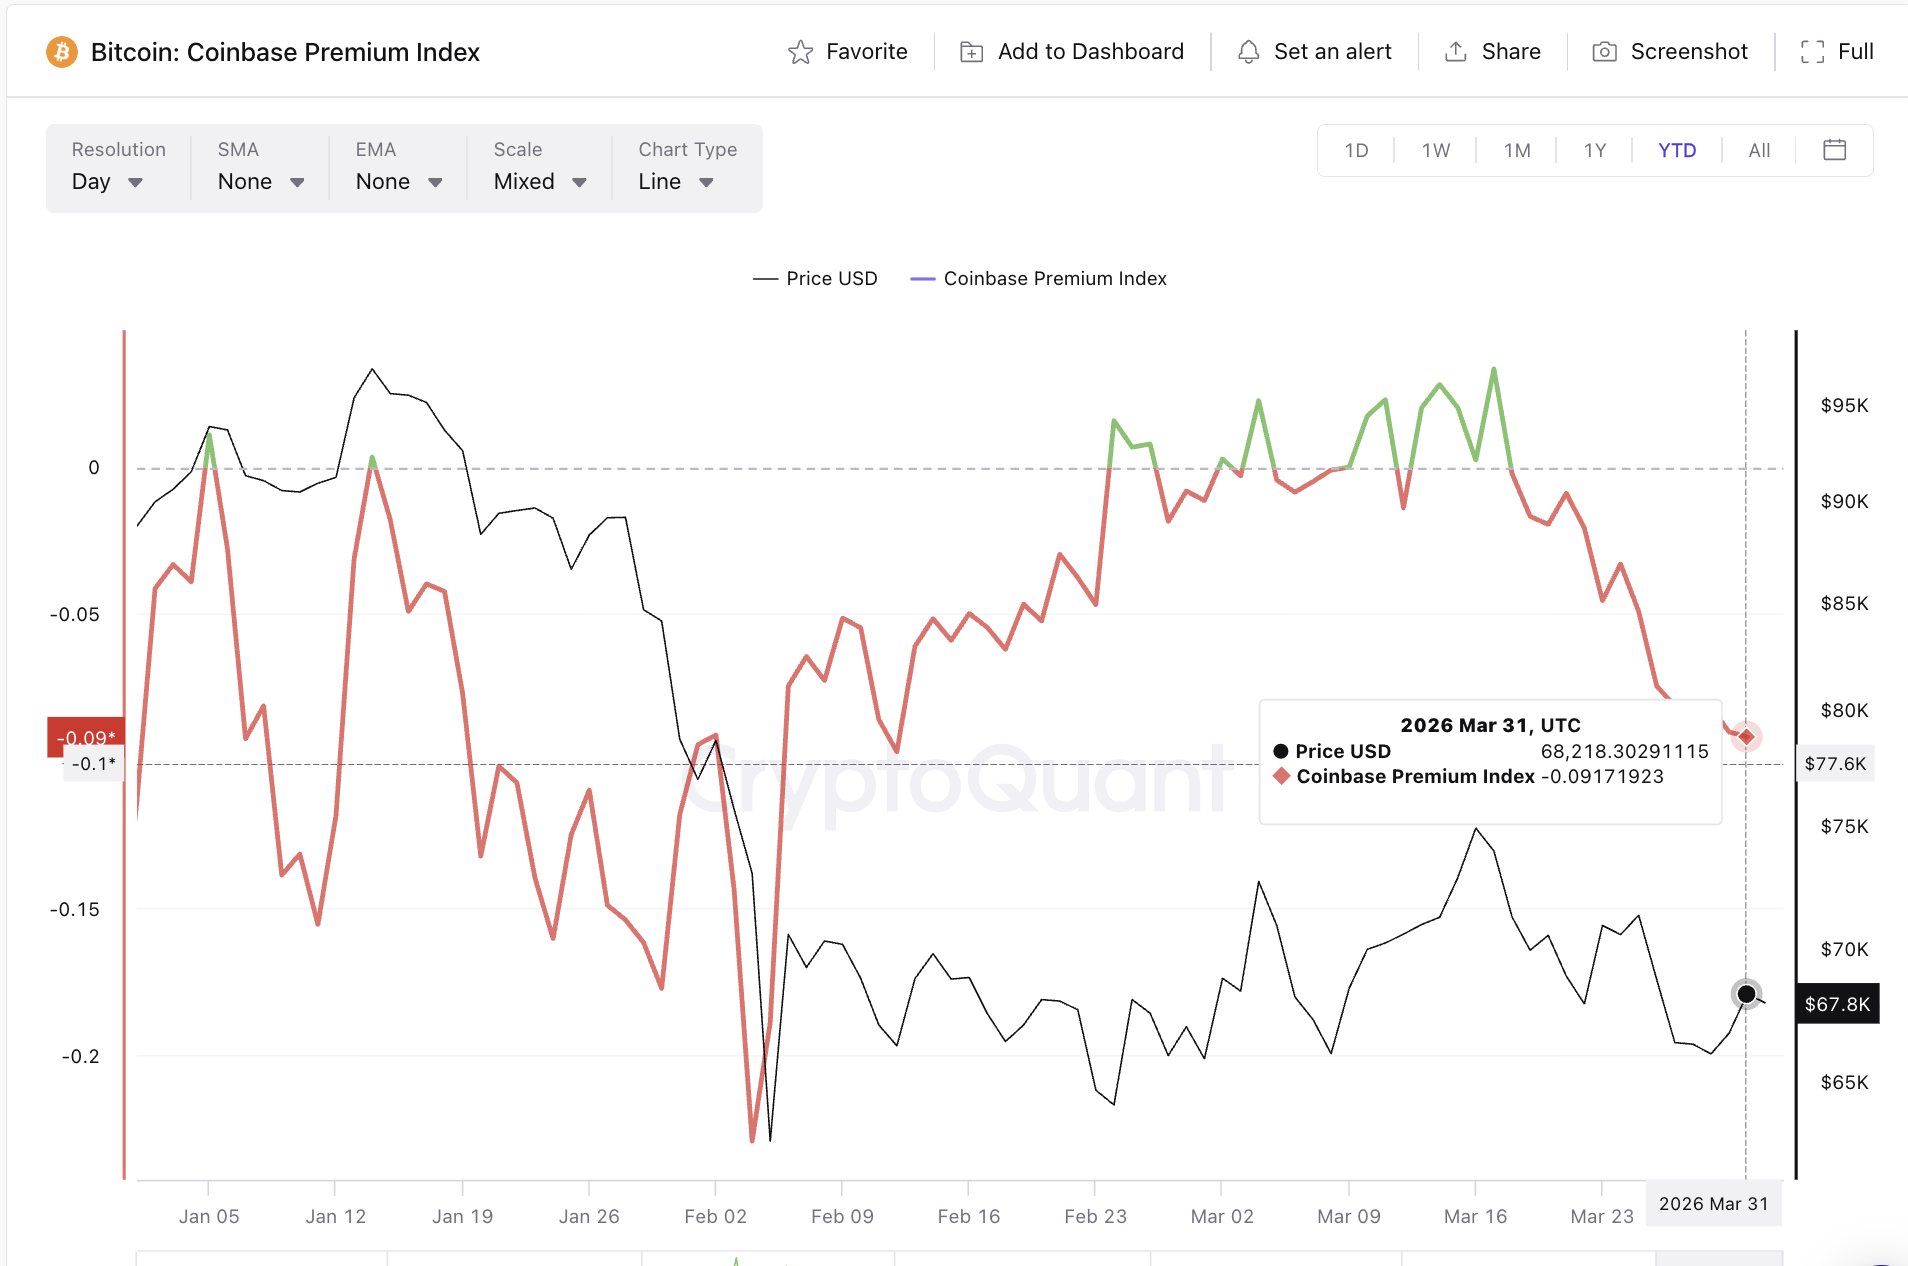
Meanwhile, the Coinbase Premium Index-our handy little thermometer for US investor enthusiasm-has plunged to -0.091 as of March 31. That’s not just cold. That’s “forgot your coat in Antarctica” cold.
Yes, March did see a few cheerful spikes, especially when ETF inflows were booming earlier in the month. But zoom out, and the broader trend shows US demand quietly fading away like a forgotten sandwich at the back of the fridge.
In other words: big institutional investors are happily buying through ETFs, while regular US traders seem to be shrugging and wandering off.
Want more token insights like this? Sign up for Editor Harsh Notariya’s Daily Crypto Newsletter here.
This creates a peculiar situation. ETF buyers-through proper, well-behaved products like BlackRock’s IBIT and Fidelity’s FBTC-are steadily accumulating Bitcoin. Meanwhile, traders on Coinbase are sitting on their hands, possibly sipping tea and looking unimpressed.
The result? ETFs are holding the floor steady, but without broader enthusiasm, there’s not enough fuel to send Bitcoin soaring dramatically upward.
And that, dear reader, makes the next move rather important.
A Hidden Trap Lurks Beneath the Surface
Now for the sneaky part. The 8-hour chart reveals a hidden bearish divergence between March 20 and March 31. Bitcoin’s price made a lower high, while the RSI-ever the rebellious indicator-made a higher high.
This is typically the market’s way of smiling politely while plotting something unpleasant.
The signal kicked in after BTC briefly poked its head above $68,130 before retreating again. That level, sitting just 0.4% above the current price, is now the all-important “prove it or lose it” line.
If Bitcoin manages to climb above $68,130 and stay there (no funny business), the next targets are $70,090 and possibly $73,280.
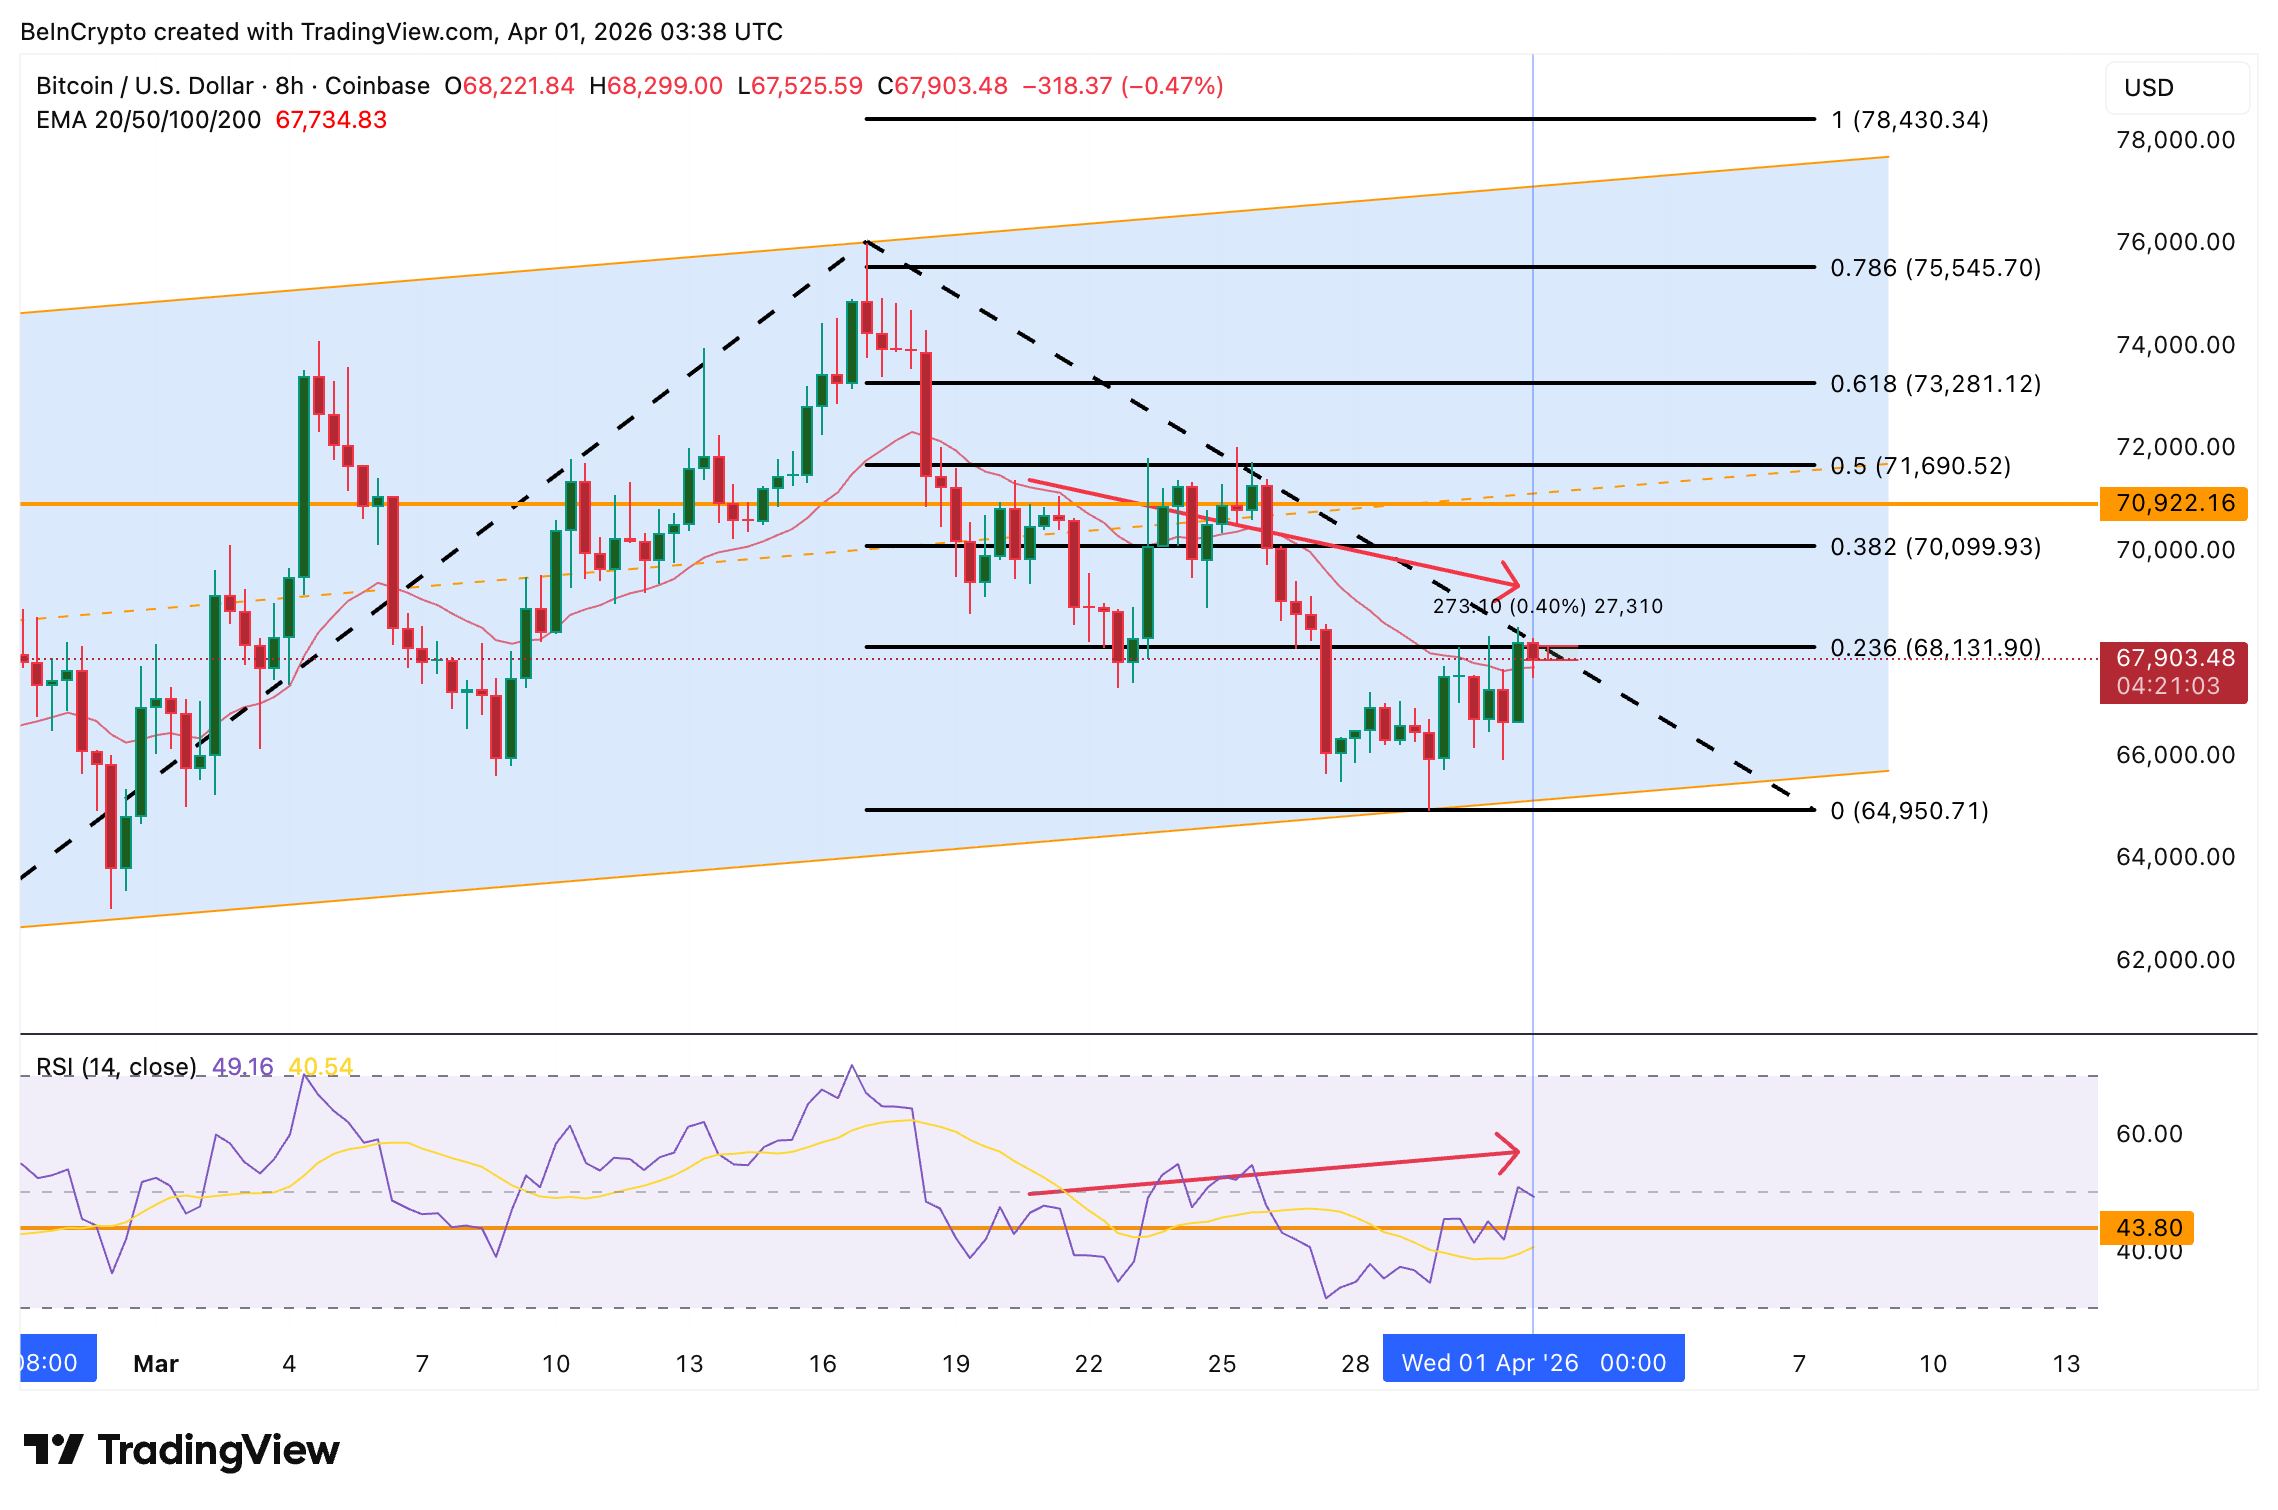
But if things go the other way-and that sneaky bearish divergence decides to do its job-the consequences could be rather unpleasant. A break below the 20-period EMA at $67,730 could trigger another drop, possibly dragging BTC down toward $64,950.
And if that level breaks? Well, the entire cheerful upward channel collapses, and things get properly messy.
So here we are: $68,130 stands like a stubborn gatekeeper. Above it lies hope, optimism, and shiny new highs. Below it… well, let’s just say it’s not where anyone wants to be.
Read More
- Off Campus Season 1 Soundtrack Guide
- X-Men ’97 Finally Gave Gambit the Hero Moment He Deserved
- 46 Years Later, The Mandalorian & Grogu Answers A Major Empire Strikes Back Question
- 10 Worst End-Game Couples In Sitcom History
- HoI4 fans harsh reactions to the announcement of another DLC pack
- Chainsaw Man Volume 24’s Cover Art Reveals a Brand-New Denji
- Emily Henry Says to ‘Trust the Vision’ For Beach Read Adaptation
- Hatsune Miku cosplayer goes viral selling $15 cups of “foot juice” to thirsty anime fans
- DoorDash responds after customer uses AI to make food look bad and get a refund
- Gold Rate Forecast
2026-04-01 12:07