Ah, the cryptocurrency market-a veritable circus of excitement and despair, where fortunes are made and lost faster than one can say “blockchain.” As if scripted from a particularly dramatic farce, we now find ourselves amidst a tumultuous sell-off, with a staggering $350 billion vanishing into thin air, leaving behind a faint odor of panic.
Yet, in a twist that would bemuse even the most seasoned of traders, capital has not fled the scene. Rather, it has surged forth with the fervor of an overzealous acrobat, as stablecoin inflows have doubled in the face of falling prices-a sign, perhaps, that our intrepid traders are not so much retreating as they are preparing for a grand entrance at the bottom of this rollercoaster ride.
The crux of the matter lies in a question that echoes through the hallowed halls of investment wisdom: has Bitcoin (BTC) already found its nadir, or must we endure further tribulations before any semblance of recovery can emerge? One cannot help but feel a twinge of anticipation as we watch this play unfold.
Stablecoin Inflow Doubles to Over $102 Billion
In what can only be described as a delightful twist of fate, weekly stablecoin exchange inflows have swelled nearly to double their previous figures. This surge indicates that while Bitcoin and its altcoin companions languish under the weight of heavy liquidations and a rather inconvenient short-term market structure, funds are still making their way to exchanges like eager spectators lining up for a sold-out show.
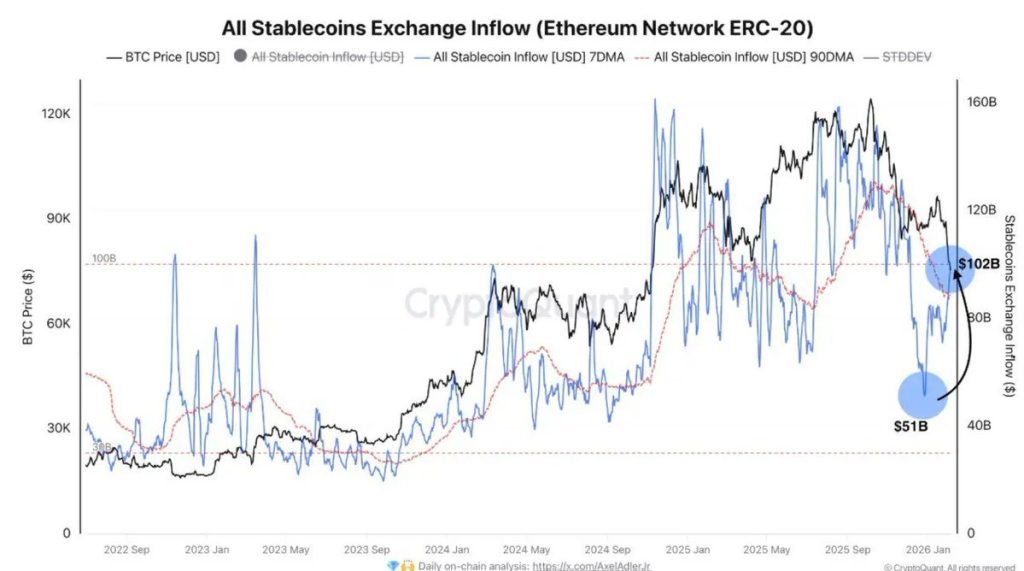
Data from CryptoQuant reveals a breathtaking spike in inflows-$102 billion, to be precise-surpassing the 90-day average of a mere $89 billion. What does this mean, you ask? It suggests that traders are not darting for the exits like frightened rabbits. Nay, they are poised, ready to pounce at the first hint of a market bottom.
When Does the Crypto Market Typically Bottom?
Historical patterns in Bitcoin bear markets are as predictable as a British rainstorm. From 2011 through to 2022, the market has displayed a penchant for deep drawdowns, typically ranging from 60% to 80%. It seems that the more dramatic the plunge, the more steadfastly the bottom eventually presents itself.
The chart reveals a rather unflattering truth: prior corrections rarely wrapped up with a gentle nudge. Instead, they seemed to linger in the depths of despair, characterized by rampant fear and participation dwindling faster than guests at a poorly attended dinner party. The last cycle, for instance, saw Bitcoin languish in mediocrity after a drawdown exceeding 70%, followed by several months of what could best be described as extended ennui.
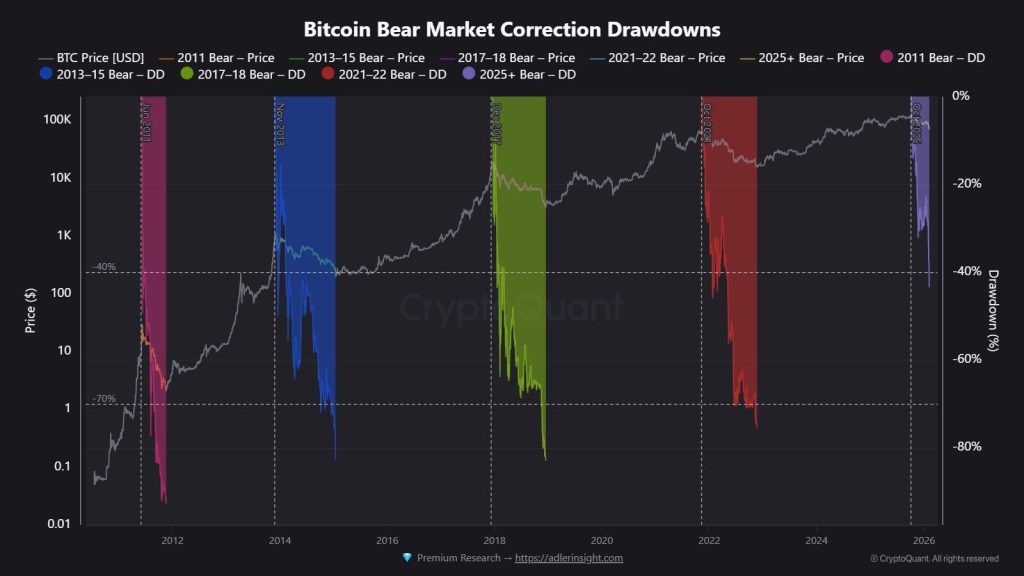
Currently, the drawdown appears almost timid when compared to past bear market bottoms. One might say it’s merely testing the waters, still in the throes of price discovery rather than confidently proclaiming a definitive bottom. Its history teaches us that true bottoms reveal themselves only after volatility has curled up in a corner and stopped making new lows.
This analysis leads one to conclude that, while capital positioning is indeed on the rise, time-and not just a single cataclysmic event-must elapse before a robust market bottom can be declared. Patience, dear investors, is a virtue.
The Bottom Line: What to Watch Next?
While data suggest the market is not yet in a state of panic-induced flight, it doesn’t appear to have entirely finished correcting itself either. With over $350 billion having evaporated from the total crypto market capitalization, stablecoin inflows have risen to a commendable $102 billion, indicating that capital is content to hang around rather than flee.
Historically speaking, Bitcoin’s bear market bottoms have often come after those hefty drawdowns of 60%-80%. Our current cycle, however, finds BTC down only about 35%-45%. Thus, the market still has some ground to cover before it reaches those familiar, historical lows. Speculation suggests that a probable downside zone for Bitcoin may lie between $48,000 and $42,000-an enticing prospect for long-term demand.
As for the broader crypto market, one could anticipate a similar decline that nudges total market capitalization toward the $1.6 trillion-$1.4 trillion range, a far cry from the recent highs hovering near $2.3 trillion.
In summary, while capital stands ready and waiting, history kindly advises that there may still be lower levels to investigate or a longer consolidation period to endure before we can celebrate a durable bottom.
FAQs
Why is the crypto market falling despite rising stablecoin inflows?
Prices are plummeting due to liquidations. However, stablecoin inflows indicate traders are staying active and gearing up to pounce, not packing their bags for an exit.
What do rising stablecoin inflows mean during a crypto crash?
They usually herald sidelined capital. Traders are moving their funds to exchanges, preparing for the moment when they can swoop in at potential market bottoms.
Is this crypto crash panic selling or strategic positioning?
Data suggests it’s more a case of positioning than panic. Capital is lounging on exchanges, waiting for the opportune moment when volatility decides to take a breather.
Read More
- Netflix’s Little House On The Prairie Reboot: Release Date, Cast & Everything We Know
- Off Campus Season 1 Soundtrack Guide
- Silver Rate Forecast
- Prime Video’s New R-Rated Spy Thriller Is Officially No.1 On Streaming Despite Poor Reviews
- Gold Rate Forecast
- Brent Oil Forecast
- EUR ZAR PREDICTION
- EUR USD PREDICTION
- KPop Demon Hunters Meets Avatar: The Last Airbender In Netflix’s 3-Part Fantasy Series
- Bulgakov’s Take: Koreans Bet the Farm on Chips, Crypto, and Chaos
2026-02-06 17:13