Author: Denis Avetisyan
A new approach aligns graph neural networks with financial tasks, boosting performance in dynamic stock market forecasting.
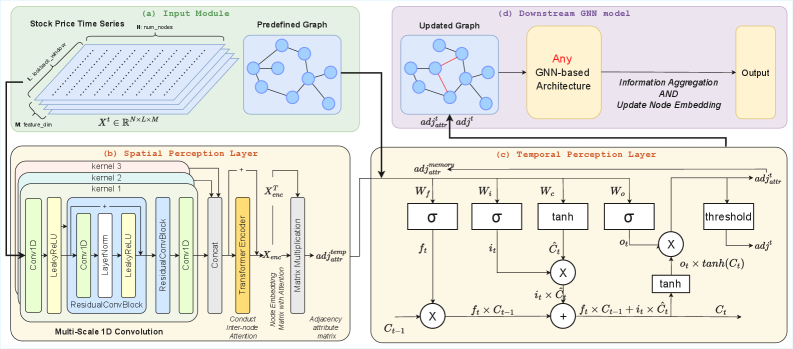
Researchers introduce GAPNet, an end-to-end trainable network that learns task-specific graph alignments for improved stock ranking and temporal dynamic modeling.
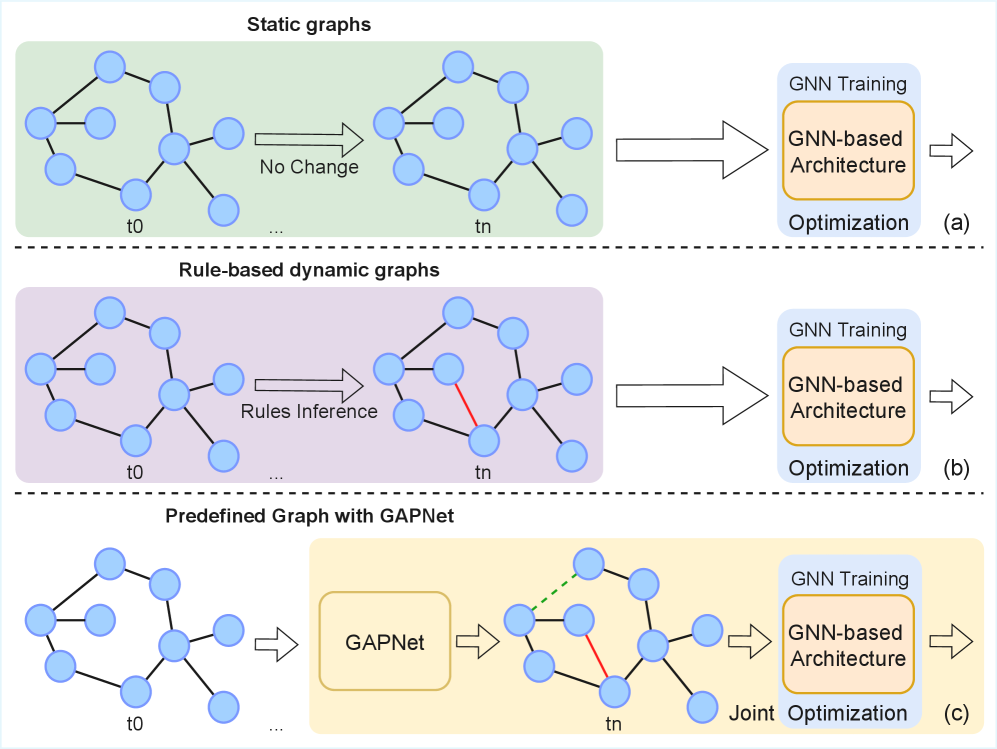
Existing graph neural network approaches to financial forecasting rely on pre-defined relationships between stocks, often failing to adapt to the noisy and dynamic nature of real-world market signals. To address this limitation, we introduce GAPNet-a Plug-in Graph Adaptation Network-detailed in ‘GAPNet: Plug-in Jointly Learning Task-Specific Graph for Dynamic Stock Relation’, which jointly learns task-specific graph topologies and representations in an end-to-end manner. Our results demonstrate that GAPNet consistently enhances profitability and stability across multiple datasets, yielding significant improvements over state-of-the-art models-up to 0.63 annualized cumulative return and a peak Sharpe Ratio of 2.20. Can this plug-and-play approach unlock more robust and adaptive relational modeling for a wider range of financial applications?
The Inherent Instability of Market Systems
The stock market operates not as a collection of isolated events, but as a complex system where numerous factors are inextricably linked. This inherent interconnectedness means that even seemingly minor shifts in one area – perhaps a change in global oil prices, a political announcement, or even investor sentiment – can ripple through the entire market, causing unpredictable fluctuations. This volatility isn’t random noise; it’s a natural consequence of the system’s dynamic equilibrium, constantly adjusting to new information and reacting to the collective behavior of millions of participants. Understanding this systemic nature is crucial, as traditional linear models often fail to account for these cascading effects and the emergent properties that define market behavior. The market’s complexity necessitates a shift toward methods that can capture these interdependencies and model the non-linear relationships driving price movements.
Conventional financial models, frequently reliant on static datasets and linear relationships, often fall short when confronted with the intricate, non-linear dynamics of stock markets. These models typically assume historical patterns will reliably repeat, failing to account for the influence of unpredictable events – geopolitical shifts, technological disruptions, or even investor sentiment. Consequently, predictions generated from these approaches can be significantly inaccurate, underestimating both potential gains and, crucially, the extent of possible losses. This predictive shortfall isn’t merely an academic concern; it translates directly into heightened financial risk for investors, portfolio instability, and systemic vulnerabilities within the broader economic landscape. The inability of traditional methods to capture the evolving interplay of market forces necessitates the exploration of more adaptive and nuanced forecasting techniques.
The pursuit of reliable stock price forecasting remains a central, yet elusive, goal in financial analysis. Unlike static systems, stock markets are perpetually reshaped by a confluence of factors – economic indicators, geopolitical events, investor sentiment, and even unforeseen disruptions – demanding predictive models capable of dynamic adaptation. Traditional approaches, often reliant on historical data and linear relationships, frequently falter when confronted with novel market regimes or ‘black swan’ events. Consequently, contemporary research increasingly focuses on techniques like machine learning and artificial neural networks, which offer the potential to identify complex, non-linear patterns and recalibrate predictions in real-time, acknowledging that a consistently accurate forecast isn’t about predicting the future, but about intelligently responding to its inherent unpredictability.
Establishing Foundational Relationships Through Static Graphing
Static graphs utilize industry sector classifications to illustrate persistent relationships between stocks, functioning as a visual representation of inherent structural connections. These graphs are constructed by identifying companies operating within the same or highly related sectors – for example, automotive manufacturers, technology hardware firms, or pharmaceutical companies – and establishing connections based on shared economic characteristics and business models. This approach differs from correlation-based analyses which focus on short-term price movements; instead, static graphs emphasize the underlying, long-term dependencies derived from sector membership, assuming that companies within the same sector are more likely to exhibit similar performance patterns over extended periods due to common industry forces and competitive landscapes. The resulting network provides a foundational view of market structure, independent of immediate price fluctuations, and can be used as a basis for further analysis incorporating dynamic factors.
The construction of static graphs representing stock relationships relies heavily on accurate sector information. Categorizing companies by sector – such as technology, healthcare, or energy – facilitates the identification of inherent connections stemming from shared business models and economic sensitivities. This grouping is not simply taxonomic; companies within the same sector tend to experience correlated price movements due to common factors like raw material costs, regulatory changes, and consumer demand. Consequently, sector classification serves as the foundational layer for defining potential relationships, allowing for the analysis of how these relationships manifest in actual market data, independent of short-term price fluctuations.
Momentum spillover effects describe the tendency for price movements in one stock to influence the price movements of related stocks, even absent new information specific to those related companies. This influence is quantified by analyzing correlation patterns between stock returns; positive momentum in a leading stock within a sector often extends to other stocks in that same sector, and this effect is demonstrably stronger within statically-defined industry groupings. The analysis of these spillover effects allows for the identification of inherent market structures, indicating which stocks act as leaders or followers and revealing the degree of interconnectedness within and between industry sectors. These connections are not necessarily based on fundamental business relationships, but reflect investor behavior and the propagation of trading signals.
Capturing Market Dynamics with Adaptive Graph Structures
Rule-based dynamic graphs represent stock relationships as nodes and edges, but unlike static graphs, these connections are not fixed. The graph structure is recalculated periodically, or in response to specific market events, based on pre-defined rules. This allows the model to reflect changing correlations and dependencies between stocks. The rules utilize quantitative data – such as price movements and trading volumes – to determine edge creation and removal. Consequently, stocks that exhibit increasing similarity or co-movement are linked, while those that diverge have their connections severed, providing a continuously updated representation of the market landscape.
Edges in dynamic graphs representing stock relationships are established using correlation thresholds to identify stocks exhibiting similar price movements. This process involves calculating the Pearson correlation coefficient between the daily returns of stock pairs; if the absolute value of this coefficient exceeds a predefined threshold – typically ranging from 0.5 to 0.8, but adjustable based on strategy – an edge is created, linking the two stocks. The threshold determines the strength of association required to consider a relationship significant; lower thresholds create more connections, potentially including spurious correlations, while higher thresholds yield fewer, but potentially more robust, relationships. These correlation-based edges are recalculated periodically – daily or intraday – to reflect changing market dynamics and ensure the graph accurately represents current stock behavior.
News co-occurrence analysis establishes dynamic connections between stocks by quantifying how frequently they appear together in news articles. This method operates on the principle that stocks mentioned in the same news context are likely to exhibit correlated behavior. The process involves natural language processing to identify stock tickers within news articles and then calculating a co-occurrence score – typically a frequency count or a statistically weighted measure – representing the strength of association. Higher co-occurrence scores indicate a stronger relationship, triggering the creation or strengthening of edges between the corresponding stocks in the dynamic graph. This signal is particularly valuable for capturing relationships driven by external events or sentiment shifts not readily apparent through purely quantitative data, and can be adjusted by time decay to prioritize recent co-occurrences.
Optimizing Investment Strategy Through Precise Stock Ranking
Effective stock ranking is a fundamental component of investment strategy, enabling the identification of equities with potentially high returns. This process relies on forecasting future performance, and subsequently ordering stocks based on these predictions to prioritize those exhibiting the most favorable outlook. Ranking systems are not simply based on historical data; they integrate predictive analytics to assess future value, allowing investors to focus capital on opportunities expected to outperform the market. The accuracy of these predictions directly impacts portfolio returns, making robust ranking methodologies critical for successful investment outcomes.
Stock ranking methodologies utilize several established financial metrics to assess investment potential. Cumulative Return represents the total percentage gain or loss over a specified period. Annualized Return converts this cumulative performance into an annual rate, facilitating comparison across different investment horizons. However, raw returns do not account for risk; therefore, the Sharpe Ratio is employed, which measures risk-adjusted return by subtracting the risk-free rate and dividing by the investment’s standard deviation. A higher Sharpe Ratio indicates a better return for the level of risk taken, and is therefore a crucial component in comparative stock ranking systems. These metrics, when used in conjunction, provide a comprehensive basis for evaluating and prioritizing investment opportunities.
The integration of graph-based insights with traditional financial metrics-Cumulative Return, Annualized Return, and the Sharpe Ratio-yields a more precise stock ranking system. Specifically, utilizing the CI-STHPAN graph neural network architecture in conjunction with the GAPNet enhancement on the NYSE dataset resulted in an annualized Internal Rate of Return (IRR) of 0.68. This performance indicates that combining graph-based analysis of stock relationships with established quantitative measures improves the identification of high-performing investment opportunities compared to relying on traditional metrics alone.
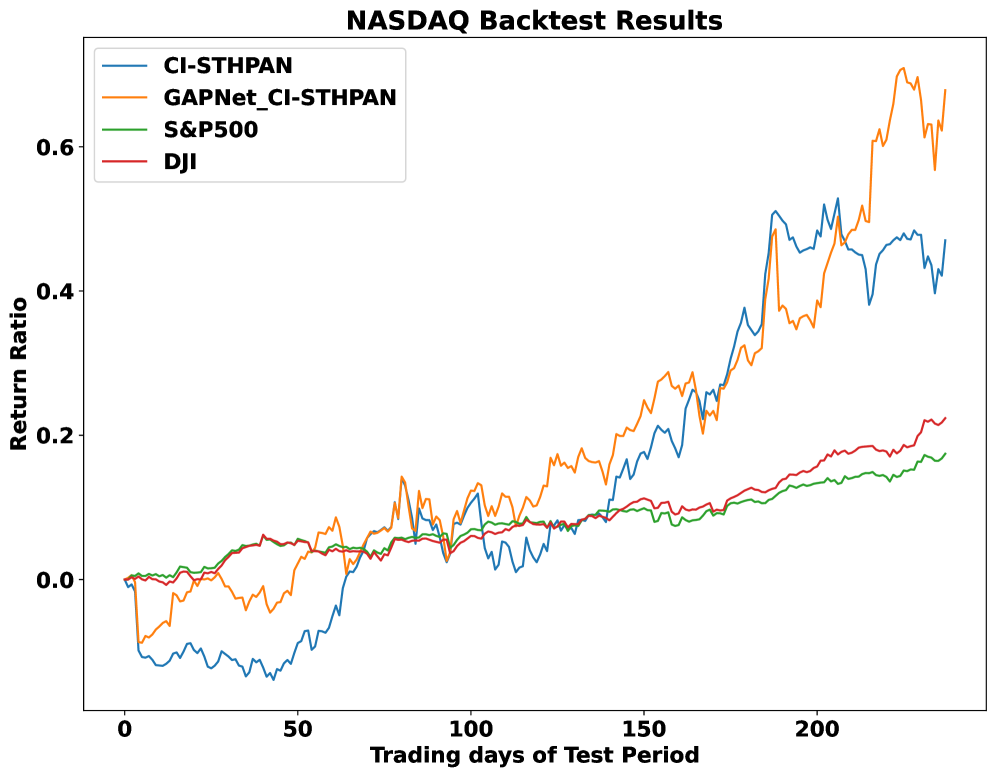
GAPNet consistently enhances investment performance metrics across diverse Graph Neural Network (GNN) architectures when applied to both the NASDAQ and NYSE datasets. Specifically, testing demonstrates an increase of up to 0.315 in annualised Internal Rate of Return (IRR) and up to 0.632 in the Sharpe Ratio when GAPNet is integrated. These improvements were observed consistently across various GNN models, indicating GAPNet’s broad applicability and positive impact on risk-adjusted returns within these major stock exchanges.
Performance evaluations on both the NASDAQ and NYSE datasets demonstrate the efficacy of the proposed methodology. Specifically, utilizing the RT-GCN architecture in conjunction with GAPNet resulted in a 0.632 improvement in the Sharpe Ratio when applied to the NASDAQ dataset. Furthermore, the CI-STHPAN architecture, when implemented without GAPNet on the NYSE dataset, achieved an annualised Internal Rate of Return (IRR) of 0.47; this serves as a benchmark demonstrating the added value provided by GAPNet integration.
The pursuit of robust financial forecasting, as exemplified by GAPNet, necessitates a commitment to provable correctness. The paper’s focus on aligning predefined graphs with downstream tasks through an end-to-end training paradigm reflects a desire for algorithmic rigor. This aligns perfectly with Dijkstra’s assertion: “Program testing can be a very effective way to find errors, but it can never prove the absence of errors.” While GAPNet utilizes data-driven learning, the underlying principle of graph adaptation aims to establish a more mathematically sound foundation for stock ranking, moving beyond solutions that merely ‘work on tests’ to ones that possess inherent reliability. The architecture’s emphasis on temporal dynamics and hypergraphs suggests a pursuit of a system verifiable beyond superficial performance metrics.
What Remains to be Proven?
The pursuit of adaptable graph structures for time-series analysis, as exemplified by GAPNet, necessitates a more fundamental consideration of what constitutes ‘alignment’ between a graph and a forecasting task. Current methodologies largely treat alignment as an optimization problem-a search for parameters that yield superior empirical performance. However, a truly elegant solution demands a formal definition of correspondence. What geometric or topological properties of a graph demonstrably facilitate accurate prediction? Until such principles are articulated, the field remains tethered to heuristic refinement.
Furthermore, the reliance on predefined graphs, even those subject to adaptation, introduces a structural bias. The implicit assumption that relevant relationships are adequately captured within a discrete graph representation warrants scrutiny. Hypergraphs, while offering increased representational capacity, do not resolve the underlying issue – the imposition of a combinatorial structure onto a potentially continuous dynamic. Future work should explore methods for learning graph structure directly from data, guided by information-theoretic principles rather than arbitrary connectivity patterns.
Ultimately, the true test lies not in achieving incremental gains on benchmark datasets, but in developing a predictive framework grounded in provable properties. The elegance of a solution is not measured by its accuracy on held-out data, but by the mathematical certainty of its correctness. Until then, the forecasting of stock relations, however sophisticated, remains a complex approximation of an unknowable reality.
Original article: https://arxiv.org/pdf/2602.00888.pdf
Contact the author: https://www.linkedin.com/in/avetisyan/
See also:
- Netflix’s Little House On The Prairie Reboot: Release Date, Cast & Everything We Know
- Off Campus Season 1 Soundtrack Guide
- Infinity Nikki Candlelight Reverie Challenge and Rewards Guide
- Gold Rate Forecast
- Brent Oil Forecast
- Prime Video’s New R-Rated Spy Thriller Is Officially No.1 On Streaming Despite Poor Reviews
- Silver Rate Forecast
- EUR ZAR PREDICTION
- KPop Demon Hunters Meets Avatar: The Last Airbender In Netflix’s 3-Part Fantasy Series
- Dua Lipa and Callum Turner Had a Town Hall Wedding
2026-02-04 04:20