Bitcoin, gold, and silver experienced a sudden surge in strength on Tuesday, the eve of what appears to be another Fed rate cut. 🤯
The pioneer crypto, as well as the two commodity safe havens, Gold and Silver, may face volatility around the Fed’s interest rate decision, even as XAG price breaks above $60/oz for the first time in history, now up +108% in 2025. 📈
Top BTC, XAU, and XAG Price Targets Ahead of the Fed Cut
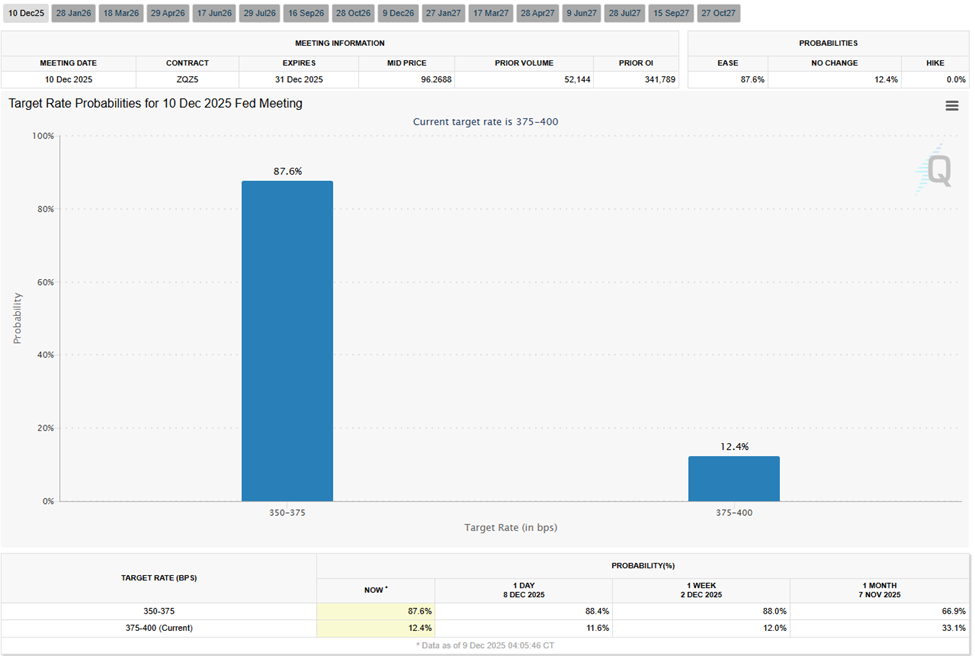
All eyes are on the Fed’s interest rate decision tomorrow and the subsequent Jerome Powell press conference. This is one of the most important macroeconomic events for Bitcoin and commodity safe havens this week. 🧐
Data from the CME FedWatch Tool shows that interest bettors see an 87.6% chance that the Fed will cut interest rates. 🎰
A Fed rate cut is generally a tailwind for Bitcoin as it injects liquidity into the financial markets. Gold is typically the cleanest and fastest beneficiary of rate cuts, while silver often lags gold initially, then outperforms during strong reflation moves. This is why silver tends to make violent upside moves after cuts once momentum builds. 🌪️
- Gold reacts first and most predictably 🏆
- Bitcoin benefits as liquidity expands 💸
- Silver often becomes the late-stage momentum winner 🐢
Based on current price action, however, markets are already pricing in the event, with traders already front-running a rate cut amid near-certain probabilities. 🚀
Bitcoin Races for $100,000 Ahead of Fed’s Interest Rate Decision
The Bitcoin price is trading with a bullish bias, consolidating within an ascending parallel channel since bottoming out at $80,600 on November 21. As long as the price remains confined within this technical formation, the prospects for further upside remain alive. 🧠
Based on the RSI (Relative Strength Index) indicator, momentum is rising, which could push BTC further north. Its position above the 50 threshold suggests significant buyer momentum, but a lot remains in the balance, as this midline level is also susceptible to a bearish takeover. 🧨
The Bitcoin price faces immediate resistance due to the 50-day Exponential Moving Average (EMA) at $97,015, a roadblock in BTC’s path to the most critical Fibonacci retracement level, 61.8%, at $98,018. 🚧
This would be a key entry point for late bulls, such that if the Bitcoin price breaks cleanly through the level with strong volume, it would signal a strengthening trend. Such a directional bias would see the pioneer crypto extend a neck higher to $103,399, earmarked by the 50% midrange. 🦄
In a highly bullish case, BTC could reach the 38.2% Fibonacci retracement level, signaling a strong trend. 🎯
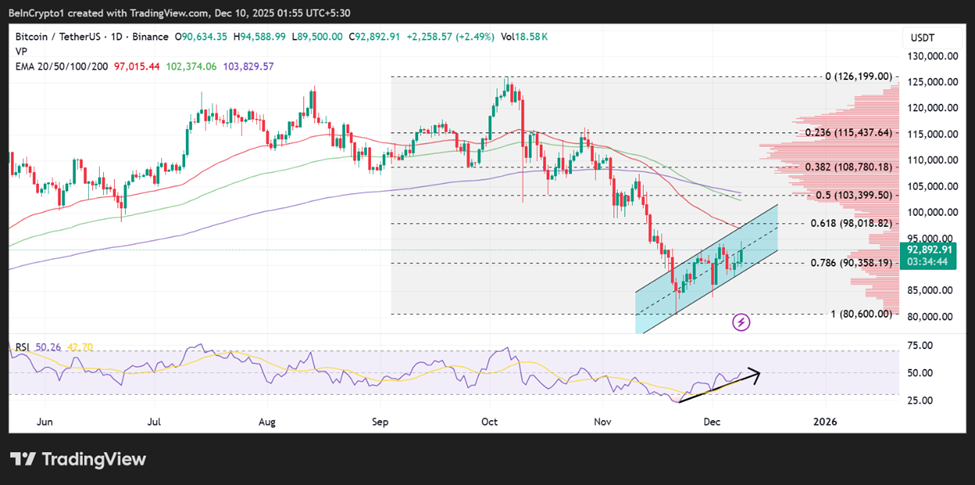
Conversely, if the 61.8% Fibonacci retracement level holds as resistance, it would set the tone for a trend reversal. 🔄
Sellers pulling the trigger at current levels could see the 78.6% Fibonacci retracement level give way as support, a move that could cause BTC to fall out of the ascending parallel channel. 🧨
Such a directional bias could send the pioneer crypto’s price toward the $80,600 support floor. Such a move would constitute a drop of almost 15% from current levels. 😭
Gold may be in a Stage A Classic Reload Zone
The gold price could sell off towards the lows of $4,199 and potentially violate the rising support trendline before reversing higher. Based on the RSI, momentum is fading, putting the XAU price at risk of a correction. 🧊
However, with the RSI still above the 50 threshold and strong downward support provided by the confluence of the 50- and 100-day EMAs at $4,202 and $4,203, respectively, the price could forge higher. 🚀
Critical support resides in the range between $4,178 and $4,192. If this zone holds, the bull structure would remain intact. 🦄
Meanwhile, the key resistance is at $4,241, with a clean break above this supplier congestion level likely to spark an acceleration. 🚀
In such a directional bias, targets would be $4,260, or in a highly bullish case, $4,300 before a potential recapture of the $4,381 all-time high (ATH). 🎉
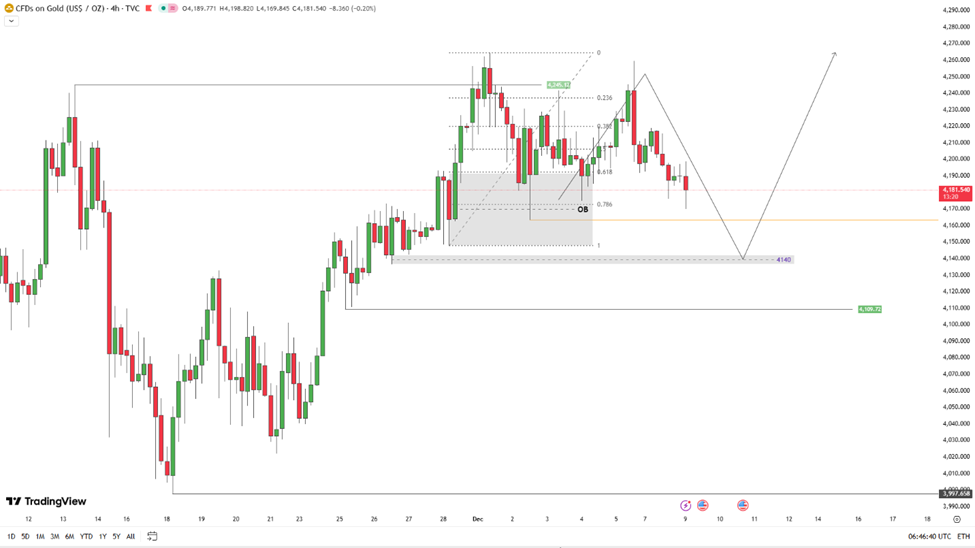
Therefore, current price levels could be a classic reload zone, with every dip providing a buying opportunity for late bulls. 🛒
Silver is up 6x as Much as the S&P 500 YTD
The silver price is experiencing one of the strongest bull runs in stock market history, up six times the S&P 500’s year-to-date (YTD) gain. The XAG/USD price is now on track for the largest 12-month gain since 1979. 🌟
After establishing a new all-time high of $60.794, silver is on price discovery levels, with potential for further upside. 🧭
On the 15-minute chart below, the XAG/USD price shows a clean bullish continuation breakout. The silver price has decisively cleared the prior range high near $58.83 and accelerated to price discovery, confirming a shift from consolidation to expansion. 🚀
All key EMAs (50/100/200) are now stacked bullishly and turning higher, signaling strong short-term trend alignment and trend strength. 🧠
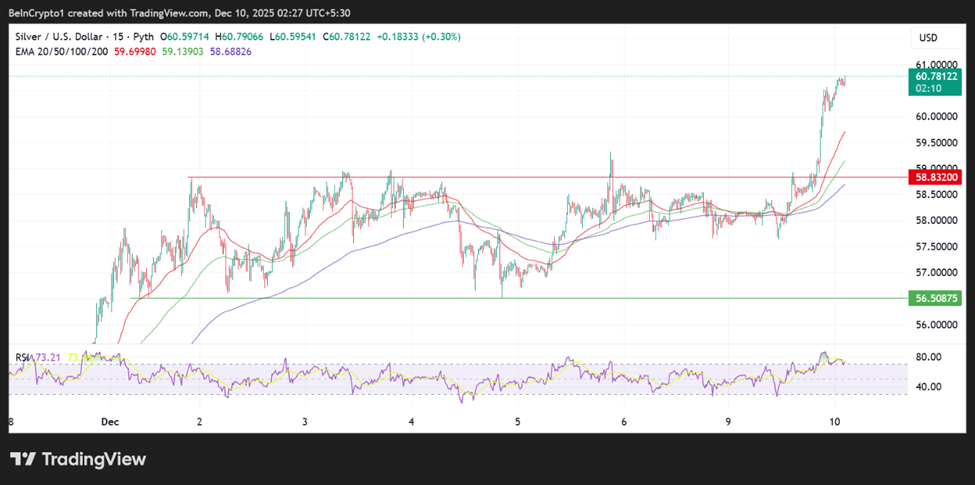
Momentum supports the move, as evidenced by the RSI above 73, indicating strong buying pressure. However, this RSI position also warns of near-term overheating and the risk of a shallow pullback or consolidation before continuation. 🌡️
Structurally, the former resistance at $58.80 to $59.00 now acts as first support, while the next psychological and technical target sits around $61.00-$61.50. 🎯
As long as the silver price holds above the rising 50-EMA (red), the bias remains buy-the-dip, with downside risk increasing only on a sustained breakdown back below $59.00. 🚧
Read More
- United Airlines can now kick passengers off flights and ban them for not using headphones
- Crimson Desert: Disconnected Truth Puzzle Guide
- All 9 Coalition Heroes In Invincible Season 4 & Their Powers
- Mewgenics vinyl limited editions now available to pre-order
- Assassin’s Creed Shadows will get upgraded PSSR support on PS5 Pro with Title Update 1.1.9 launching April 7
- Viral Letterboxd keychain lets cinephiles show off their favorite movies on the go
- Grey’s Anatomy Season 23 Confirmed for 2026-2027 Broadcast Season
- Does Mark survive Invincible vs Conquest 2? Comics reveal fate after S4E5
- All Golden Ball Locations in Yakuza Kiwami 3 & Dark Ties
- How to Get to the Undercoast in Esoteric Ebb
2025-12-10 02:03