Author: Denis Avetisyan
A new analysis reveals how shifting economic anxieties-from inflation to trade policy-have influenced U.S. presidential election polls in recent cycles.
This study examines the dynamic relationships between financial market volatility, economic uncertainty, and polling data from the 2020 and 2024 U.S. presidential election campaigns.
While conventional wisdom suggests economic conditions heavily influence electoral outcomes, the relationship between voter sentiment and financial markets is often surprisingly complex. This paper, ‘Electoral Polls and Economic Uncertainty: an Analysis of the Last Two U.S. Presidential Elections’, investigates the dynamic interplay between polling data and indicators of economic and financial uncertainty-including inflation expectations, business conditions, trade policy, and market volatility-during the 2020 and 2024 U.S. presidential campaigns. Our analysis reveals markedly different correlations between these factors in the two election cycles, with heightened sensitivity to shocks in 2020 contrasting with a largely muted response in 2024. Given these shifting dynamics, under what conditions can economic fundamentals reliably inform predictions of electoral behavior, and what non-economic forces are increasingly shaping voter preferences?
The Shifting Sands of Public Opinion
Accurately gauging voter preference remains a cornerstone of informed governance and effective campaigning, yet conventional polling methods are increasingly challenged by the velocity of modern events. The interplay of fluctuating economic indicators – inflation, employment rates, and market performance – combined with unpredictable geopolitical shifts, creates a volatile landscape where established predictors often fall short. Traditional surveys, typically snapshots in time, struggle to capture the dynamic ways these factors influence public opinion, leading to inaccurate forecasts and potentially misinformed strategies. This isn’t simply a matter of statistical noise; rather, it reflects a fundamental difficulty in isolating and quantifying the complex, often non-linear, relationship between macroeconomic conditions, global events, and the evolving sentiments of the electorate.
Accurate prediction of voter preference hinges on a comprehensive understanding of interwoven economic forces. Beyond simple economic fundamentals like employment and inflation, forecasts must account for the pronounced influence of market volatility – the degree to which financial markets fluctuate – and the often-unpredictable impact of policy uncertainty. Shifts in voter sentiment aren’t solely driven by stable economic indicators; instead, they react powerfully to perceived risk and instability stemming from both financial markets and ambiguous governmental actions. Research indicates that spikes in volatility, coupled with unclear policy directions, can disproportionately affect voters, creating a complex interplay where rational economic assessment is often superseded by emotional responses to uncertainty, making integrated modeling essential for reliable forecasts.
Traditional methods of gauging voter sentiment frequently fall short due to an inability to fully represent the complex and evolving connections between economic conditions, market fluctuations, and policy changes. These approaches often treat influencing factors as isolated variables, neglecting the crucial feedback loops and synergistic effects that truly drive shifts in public opinion. Consequently, forecasts can be inaccurate, failing to anticipate how voters react to interconnected events-for example, how rising inflation coupled with geopolitical instability impacts perceptions of leadership and policy effectiveness. A more nuanced approach necessitates integrating dynamic modeling techniques, incorporating real-time data streams, and employing computational linguistics to analyze the subtle shifts in language and sentiment expressed across various media platforms, thereby providing a more responsive and accurate reflection of the electorate’s evolving mindset.
Modeling the Interplay of Uncertainty
The Dynamic Conditional Correlation (DCC) model utilized extends the Generalized Autoregressive Conditional Heteroskedasticity (GARCH) framework by allowing the correlations between multiple time series to vary over time. Unlike traditional correlation analyses which assume constant relationships, the DCC model estimates time-varying correlations, capturing the changing interdependencies between economic indicators, market signals, and policy variables. This is achieved through a two-step process: first, the conditional variances of each time series are modeled using a GARCH specification; second, the correlations between the standardized residuals from these GARCH models are then modeled as a function of past values, enabling the capture of dynamic correlation patterns. The model’s parameters are typically estimated using maximum likelihood estimation, providing a statistically rigorous method for quantifying these evolving relationships.
Traditional correlation analyses often assume static relationships between variables; however, economic, market, and policy factors influencing voter behavior exhibit temporal variation. The Dynamic Conditional Correlation (DCC) model addresses this limitation by allowing the correlation coefficients between these variables to change over time. This is achieved by modeling the conditional variances and covariances of the time series, capturing periods of high or low correlation as conditions evolve. Consequently, the framework can identify how shifts in the relationship between indicators-such as the Aruoba-Diebold-Scotti Business Condition Index, inflation expectations, and trade policy uncertainty-affect the predictive power of these variables on voter sentiment, offering a more nuanced understanding than fixed-correlation models.
A composite sentiment proxy is constructed utilizing the Aruoba-Diebold-Scotti Business Condition Index, the 5-Year Breakeven Inflation Rate, and the Trade Policy Uncertainty Index. The Aruoba-Diebold-Scotti Index provides a coincident economic condition measure derived from multiple diffusion indices. The 5-Year Breakeven Inflation Rate serves as a market-based expectation of future inflation, reflecting investor sentiment regarding price stability. Finally, the Trade Policy Uncertainty Index quantifies uncertainty surrounding international trade relations. Combining these three indices creates a multifaceted measure intended to capture economic, inflationary, and geopolitical sentiments influencing voter behavior; each index is standardized prior to aggregation to ensure comparable scales and prevent undue influence from any single component.
Establishing a Foundation of Statistical Rigor
The Augmented Dickey-Fuller (ADF) test was employed to verify the stationarity of the time series data prior to Dynamic Conditional Correlation (DCC) modeling. Stationarity, the property of a time series having constant statistical properties over time, is a fundamental requirement for the validity of DCC models. The ADF test assesses this by examining whether a unit root is present in the time series; a significant p-value (typically ≤ 0.05) indicates the rejection of the null hypothesis of a unit root, thus confirming stationarity. Non-stationary data can lead to spurious regressions and unreliable parameter estimates within the DCC framework, necessitating this pre-modeling check. The test involves regressing the first difference of the time series against its lagged levels and calculating a test statistic to determine stationarity.
The ARCH-LM test was implemented to validate the presence of volatility clustering, a necessary condition for employing GARCH-type models. This test assesses whether the squared residuals from a time series exhibit autocorrelation, indicating periods of high and low volatility. Critically, the estimated parameters α and β from the GARCH model – representing the coefficients for the lagged squared error term and the lagged conditional variance, respectively – were verified to satisfy the condition α + β < 1. This ensures the model is covariance stationary and that the conditional variance remains finite, thereby confirming the validity and reliability of the GARCH model specification for subsequent analysis.
Statistical validation procedures, including the Augmented Dickey-Fuller (ADF) and ARCH-LM tests, were implemented to assess data suitability for time series modeling. The ADF test verified the stationarity of the data, a critical assumption for preventing spurious regressions and ensuring meaningful results. Concurrently, the ARCH-LM test confirmed the presence of volatility clustering, validating the applicability of GARCH-type models designed to capture time-varying volatility. Successful completion of these tests-demonstrating stationarity and volatility clustering-established a robust dataset and minimized the risk of inaccurate or unreliable analytical outcomes, thereby providing a solid foundation for subsequent modeling and inference.
Beyond Prediction: Understanding the Electorate
The study reveals a noteworthy relationship between the health of the economy, the turbulence of financial markets, and the attitudes of voters. Shifts in economic fundamentals – encompassing factors like employment rates and GDP growth – consistently correlate with changes in voter sentiment, indicating that economic conditions play a crucial role in shaping political opinions. This connection is further amplified by market volatility, specifically as measured by the CBOE Volatility Index (VIX), which acts as a barometer of investor anxiety and often mirrors public concerns. When economic indicators falter or market uncertainty rises, the analysis demonstrates a tendency for voter sentiment to shift accordingly, suggesting that anxieties about financial well-being can directly translate into political preferences and potentially influence election outcomes.
The analysis revealed that the relationship between public opinion polls and measures of economic or political uncertainty isn’t static; instead, correlations frequently flip from positive to negative and back again over time. This instability underscores the limitations of relying on fixed correlations for forecasting and strongly supports the application of dynamic correlation modeling techniques. Such models, unlike traditional approaches, account for the evolving nature of these relationships, allowing for a more nuanced understanding of how uncertainty influences voter sentiment. Essentially, the study demonstrates that simply identifying a correlation isn’t enough; tracking how that correlation changes is crucial for accurately interpreting shifts in public opinion and potentially predicting electoral outcomes.
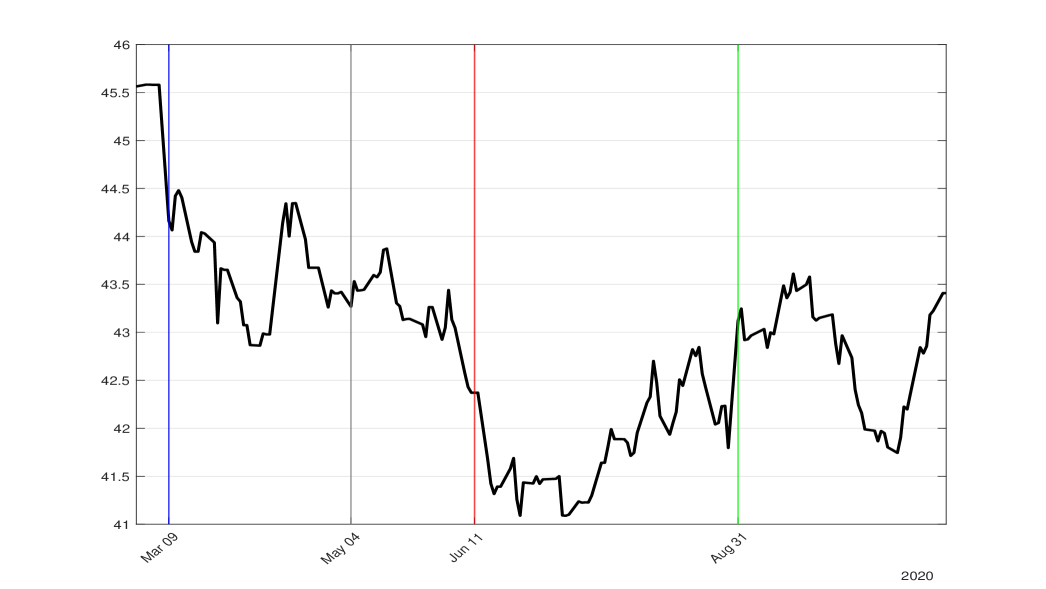
Analysis of voter sentiment during the 2020 and 2024 election cycles revealed a noteworthy correlation between financial market anxiety and shifts in public opinion. On August 31, 2020, a substantial surge in the VIX Index – a key measure of market volatility – registered a 48% increase, coinciding with a 133% spike in Trade Policy Uncertainty. These economic indicators demonstrated a strong relationship with contemporaneous changes in voter preferences, suggesting that anxieties surrounding economic policy and market stability significantly influenced the electorate. However, a comparable pattern was largely absent during the 2024 election, indicating a potential evolution in campaign strategies or a diminished role for immediate economic anxieties in shaping voter decisions, prompting further investigation into the changing dynamics of political persuasion.
The study reveals a shifting relationship between economic anxieties and polling data, a correlation far from static. It’s a reminder that predictive models, even those incorporating sophisticated metrics like dynamic conditional correlation, aren’t crystal balls. As Friedrich Nietzsche observed, “There are no facts, only interpretations.” The research doesn’t claim to predict outcomes, but rather to map the fluctuating influence of economic factors on public sentiment. The variance observed between 2020 and the unfolding 2024 campaign underscores a crucial point: models are mirrors of their makers, reflecting the specific conditions and biases inherent in their construction – and prone to failure when those conditions change.
Where Do We Go From Here?
The observed shifts in correlation between economic anxieties and polling data are, predictably, not a revelation of causation. It is, however, a reminder that models built on static relationships are fundamentally optimistic. The assumption of stability-that past performance predicts future results-is a convenient fiction. This work doesn’t explain electoral behavior; it highlights the precariousness of attempting to do so with incomplete data and shifting baselines.
Future research should focus less on identifying correlations-they will always surface, given sufficient statistical power-and more on quantifying the error surrounding those correlations. The dynamic conditional correlation model offers a useful framework, but its sensitivity to parameter selection warrants further investigation. A more robust approach may involve explicitly modeling the sources of uncertainty-not just economic indicators, but the very process of opinion formation and its susceptibility to exogenous shocks.
Ultimately, the true challenge lies not in predicting elections, but in acknowledging the inherent limits of prediction itself. Wisdom isn’t finding the perfect metric; it’s knowing your margin of error, and accepting that, in complex systems, a useful model is one that accurately describes its own failure modes.
Original article: https://arxiv.org/pdf/2601.21534.pdf
Contact the author: https://www.linkedin.com/in/avetisyan/
See also:
- United Airlines can now kick passengers off flights and ban them for not using headphones
- Crimson Desert: Disconnected Truth Puzzle Guide
- How to Get to the Undercoast in Esoteric Ebb
- All 9 Coalition Heroes In Invincible Season 4 & Their Powers
- All Golden Ball Locations in Yakuza Kiwami 3 & Dark Ties
- Warframe Voruna Prime access begins on April 8 for all platforms, new deluxe cosmetic Warframe skins revealed
- Zendaya’s 4 Big 2026 Movies Could Beat Brie Larson’s Box 2019 Office Record
- Dakota County’s plan to end hunger involves locking mayors in escape rooms
- Katanire’s Yae Miko Cosplay: Genshin Impact Masterpiece
- Fire Emblem: Path of Radiance Trial Maps Unlock Guide
2026-01-31 07:37