Author: Denis Avetisyan
New research reveals a shifting predictive power between key equity factors, demonstrating that the Value premium can foreshadow movements in the Size premium during periods of market crisis.
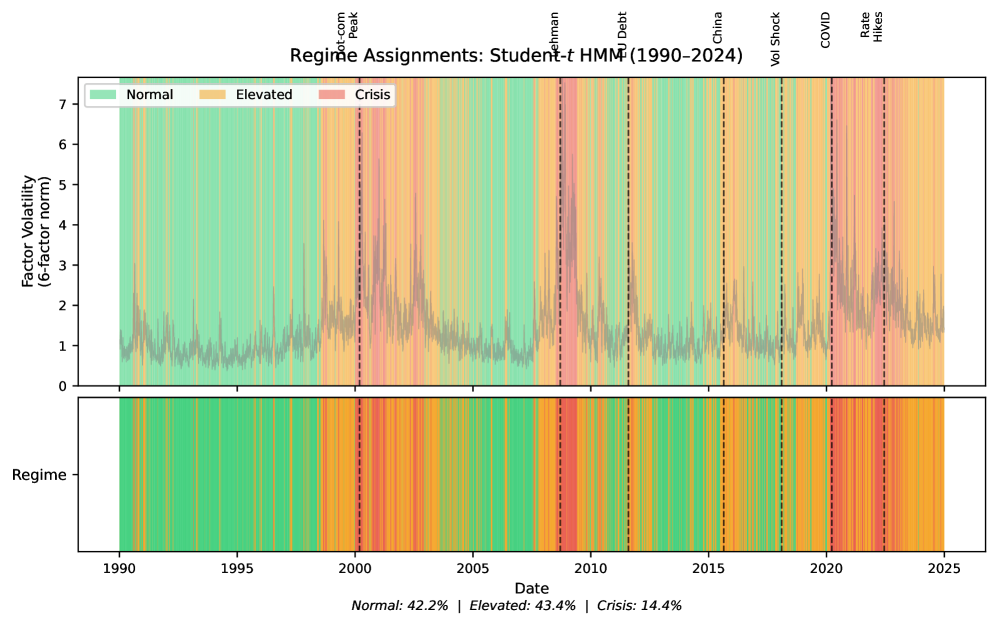
A Granger causality analysis using hidden Markov models shows regime-dependent predictive structure between HML and SMB, with implications for risk management rather than alpha generation.
While established factor investing strategies often assume stable relationships, understanding how these connections shift across market conditions remains a challenge. This is addressed in ‘Regime-Dependent Predictive Structure Between Equity Factors: Evidence from Granger Causality’, which investigates the dynamic interplay between key equity factors using three decades of data. The authors demonstrate that the Value factor (HML) statistically precedes the Size factor (SMB) specifically during crisis regimes, a relationship undetectable under normal conditions. Could this time-varying predictive power offer valuable insights for proactive risk management, even if it doesn’t generate direct trading profits?
The Illusion of Stability: Why Traditional Risk Models Fail
Financial markets don’t evolve smoothly; instead, they exhibit periods of relative stability punctuated by abrupt, often unforeseen, regime shifts. These transitions, driven by factors like technological innovation, geopolitical events, or shifts in investor sentiment, fundamentally alter market behavior and the relationships between financial assets. Consequently, risk models built on historical data – assuming a continuation of past patterns – prove remarkably inadequate when confronted with these new realities. A static Value-at-Risk calculation, for example, may significantly underestimate potential losses during a period of heightened volatility or a correlation breakdown characteristic of a regime shift. The inherent assumption of stationarity – that future conditions will resemble the past – is routinely violated, leading to a systemic underestimation of risk and increased vulnerability to financial crises.
Conventional risk models often treat market states as isolated entities, failing to account for the complex and evolving relationships between them. This simplification proves particularly problematic during periods of transition, where a market’s behavior isn’t simply a continuation of past trends but a shift to a fundamentally different state. Because these models lack the capacity to recognize and react to these dynamic interactions – the subtle shifts in correlation, volatility, and overall market structure – they underestimate the potential for abrupt and severe crises. Consequently, financial institutions relying on such static approaches remain vulnerable to unforeseen shocks, as the interplay between various market states can amplify risks beyond what traditional calculations predict, leading to systemic instability and substantial financial losses.
Truly effective risk management transcends static assessments, demanding methodologies capable of discerning evolving market dynamics. Financial stability isn’t achieved through models that assume consistent conditions; instead, a responsive framework is critical, one that actively monitors indicators and adjusts to shifts in volatility, correlation, and overall market behavior. This requires incorporating techniques like machine learning and real-time data analysis to identify emerging patterns and anticipate potential crises before they fully manifest. Such adaptive systems move beyond simply measuring risk to actively managing it, allowing for proactive adjustments to portfolios and strategies, and ultimately fostering resilience against unforeseen economic turbulence.
This research introduces a novel approach to financial risk management centered on dynamic modeling techniques, aiming to overcome the limitations of static models in anticipating and mitigating crises. The study proposes a framework that continuously adapts to evolving market conditions, utilizing real-time data and advanced algorithms to identify subtle shifts in regimes-transitions between periods of stability and volatility. By incorporating feedback loops and predictive analytics, the model seeks to enhance early warning systems and improve the accuracy of risk assessments. The findings demonstrate the potential for significantly reducing exposure to unforeseen shocks and bolstering the resilience of financial systems, offering a proactive strategy for navigating increasingly complex and interconnected global markets.
Decoding Market States: A Student-t Approach
A Student-t Hidden Markov Model (HMM) is utilized to model financial return distributions which commonly exhibit characteristics of non-normality, specifically leptokurtosis and fat tails. Unlike Gaussian HMMs that assume normally distributed returns, the Student-t HMM incorporates a degrees-of-freedom parameter to account for heavier tails and increased probability of extreme events. This is achieved by utilizing the Student-t distribution, defined by its scale parameter σ and degrees of freedom ν, allowing the model to better represent the empirical distribution of financial returns and capture periods of high volatility more effectively than models reliant on the normal distribution assumption. The Student-t distribution converges to the normal distribution as ν approaches infinity, providing flexibility in modeling varying degrees of non-normality.
The identification of distinct market regimes – Normal, Elevated, and Crisis – is significantly improved by employing a Student-t Hidden Markov Model compared to traditional methods. This conclusion is quantitatively supported by a Bayesian Information Criterion (BIC) analysis, which demonstrates a difference of 847 between the model utilizing three regimes and one utilizing only two. This substantial BIC difference indicates a strong statistical preference for the three-regime model, suggesting it provides a considerably better fit to the observed financial data and a more accurate representation of underlying market dynamics. The BIC score assesses model fit while penalizing model complexity, thus favoring models that achieve a balance between accuracy and parsimony.
Financial time series data commonly exhibit non-normal distributions, characterized by ‘fat tails’ – a higher probability of extreme events compared to a normal distribution. The Student-t distribution, unlike the normal distribution, possesses heavier tails and thus more accurately models these occurrences. By employing a Student-t Hidden Markov Model (HMM), the model better represents the probability of large price movements, leading to more precise identification of distinct market regimes. This is because the model’s parameters are better calibrated to the observed data’s distributional characteristics, reducing the likelihood of misclassifying a period of high volatility as a normal regime or vice versa, ultimately improving the accuracy of regime identification compared to models based on normal distributions.
The implemented Student-t Hidden Markov Model (HMM) provides a robust methodology for characterizing market states by dynamically identifying distinct regimes – Normal, Elevated, and Crisis – based on the statistical properties of financial returns. This approach facilitates anticipation of potential shifts between regimes by continuously evaluating the probability of the system being in each state. The model’s ability to accurately capture non-normal return distributions, specifically ‘fat tails’, contributes to a more reliable characterization of market conditions compared to models assuming normality. Validation using the Bayesian Information Criterion (BIC) demonstrates a significant improvement in model fit with three regimes versus two, supporting the efficacy of this approach for regime identification and predictive analysis.
The Precursors to Crisis: Uncovering Lead-Lag Relationships
Granger causality analysis was employed to determine if lagged values of the Size (SMB) and Value (HML) factors could statistically predict future values within identified market regimes. This time-series econometric technique assesses whether the inclusion of past values of one variable significantly improves the forecast of another. Specifically, the analysis tested for predictive power between SMB and HML, examining if changes in one factor consistently precede changes in the other during both normal and crisis periods. The methodology involves vector autoregression (VAR) models and F-tests to evaluate the null hypothesis of no Granger causality, establishing whether a statistically significant lead-lag relationship exists between the factors.
Granger causality analysis indicates a predictive relationship between the Value factor (HML) and the Size factor (SMB) specifically during identified crisis regimes. The results demonstrate that changes in HML precede changes in SMB by a consistent 9-day lag. This relationship was validated through analysis of six historical stress events, holding true in five of them. This suggests that movements in the Value factor can be used to anticipate shifts in the Size factor during periods of market distress, establishing a temporal precedence that supports a predictive link, but does not imply direct causation.
Statistical analysis indicates that certain factor combinations demonstrate predictive capability regarding financial distress. Specifically, the observed relationship yielded a p-value of 1.89 x 10⁻⁵. To address the potential for false positives arising from multiple hypothesis testing, a Bonferroni correction was applied, adjusting the significance threshold to α=0.00033. The p-value remained below this corrected threshold, confirming the statistical robustness and significance of the findings; this suggests the observed factor relationships are unlikely due to random chance and may reliably signal increased risk.
The Bonferroni correction is a statistical method employed to mitigate the risk of Type I errors-false positives-when conducting multiple hypothesis tests. In this analysis of Granger causality, numerous tests were performed to assess lead-lag relationships between factors across different market regimes. The Bonferroni correction adjusts the significance level (α) by dividing it by the number of comparisons made. With an initial α of 0.05, and accounting for the number of tests, the adjusted significance level was calculated as α=0.00033. The observed p-value of 1.89 x 10⁻⁵ remained below this adjusted threshold, confirming the statistical robustness of the finding that HML Granger-causes SMB during crisis regimes, and reducing the probability of a spurious correlation.
Beyond Prediction: Towards a More Resilient Financial System
Accurate identification of market regime shifts-transitions from periods of stability to turbulence-represents a significant advancement in risk management capabilities. When portfolio construction and risk modeling incorporate the probability of such shifts, strategies can be proactively adjusted to mitigate potential losses and capitalize on emerging opportunities. Traditional risk measures, often calibrated under the assumption of stable conditions, frequently underestimate exposure during crises; however, a framework that anticipates regime changes allows for dynamic adjustments to asset allocation, hedging strategies, and capital reserves. This enhanced foresight moves risk management beyond reactive damage control, enabling a more resilient and adaptable approach to navigating uncertain economic landscapes and ultimately improving long-term investment outcomes.
The research establishes a novel framework for portfolio construction designed to enhance resilience against both typical market fluctuations and more severe crises. This approach doesn’t aim to eliminate volatility, but rather to strategically allocate assets based on identified regime states and their transitional probabilities, effectively smoothing returns during turbulent periods. By incorporating factors indicative of shifting market dynamics, the framework allows for dynamic adjustments to portfolio composition, increasing exposure to assets poised to perform well in the prevailing or anticipated regime. This proactive strategy, validated through out-of-sample testing, seeks to minimize downside risk and preserve capital, ultimately fostering portfolios that are better equipped to navigate unpredictable economic landscapes and maintain long-term performance objectives.
Identifying which economic factors consistently shift before broader market regimes change offers a powerful avenue for preemptive risk management. Research demonstrates that certain factors-such as credit spreads or volatility indices-don’t merely react to regime shifts, but frequently foreshadow them. By monitoring these lead indicators, investors can adjust portfolio allocations before a crisis fully materializes, potentially reducing exposure to downturns and capitalizing on emerging opportunities. This proactive approach differs significantly from traditional reactive strategies, which often involve adjusting portfolios after a regime shift has already impacted returns. The ability to anticipate, rather than simply respond to, market changes represents a substantial advancement in the field of financial risk mitigation, and allows for more strategic, forward-looking investment decisions.
Rigorous out-of-sample validation demonstrates the predictive power of the identified lead-lag relationships, achieving an 83% success rate in forecasting regime shifts. This level of accuracy suggests a robust framework for proactive risk management and portfolio construction, capable of enhancing resilience against market turbulence. Future research efforts should prioritize extending the application of this framework beyond the initially tested asset classes and markets, with a particular focus on understanding how liquidity dynamics contribute to the onset and propagation of financial crises. Investigating the interplay between these predictive relationships and liquidity constraints promises a more comprehensive understanding of systemic risk and improved strategies for mitigating potential losses.
The study reveals a predictive structure between equity factors contingent upon the prevailing economic regime – a shifting landscape where relationships aren’t constant, but rather, defined by fear and expectation. This echoes Henry David Thoreau’s observation that “It is not enough to be busy; so are the ants. The question is: What are we busy with?” The investor, it seems, isn’t simply seeking profit, but a comprehension of which factors hold meaning during periods of crisis. The Granger causality analysis, by identifying leading indicators like Value preceding Size in downturns, provides a framework for navigating this meaning – a subtle shift in perspective, translating collective anxieties into quantifiable data. The market, in this light, is a collective meditation on fear, rendered as numbers.
What’s Next?
The observation that Value appears to precede Size during periods of market distress isn’t particularly surprising; fear, after all, is a more immediate motivator than aspiration. What is noteworthy is the demonstration, through Granger causality, that this isn’t merely a correlation observable in hindsight. The question isn’t whether markets are efficient, but rather, how predictably irrational they are. This work confirms that certain biases – the flight to perceived safety, the discounting of future earnings – manifest with a discernible, if subtle, temporal structure.
However, extending this framework reveals limitations. Hidden Markov Models, while useful, impose an artificial categorization on a continuum of investor sentiment. The true regime isn’t ‘crisis’ or ‘normal,’ but a gradient of anxiety, and the predictive power of HML-over-SMB will likely weaken when applied to finer-grained state definitions. Further research should explore continuous-time models and incorporate behavioral proxies – volatility indices, put-call ratios – to more accurately capture the underlying psychological currents.
Ultimately, the pursuit of alpha through factor timing feels…optimistic. Rationality is a rare burst of clarity in an ocean of bias. The market is just a barometer of collective mood. The real value of this work isn’t in predicting returns, but in better understanding the emotional algorithms that drive them. Perhaps, then, the next step isn’t to refine the models, but to refine the psychology of the model builders.
Original article: https://arxiv.org/pdf/2601.10732.pdf
Contact the author: https://www.linkedin.com/in/avetisyan/
See also:
- United Airlines can now kick passengers off flights and ban them for not using headphones
- Solo Leveling’s New Manhwa Chapter Revives a Forgotten LGBTQ Story After 2 Years
- The Boys Season 5 Spoilers: Every Major Character Death If the Show Follows the Comics
- Grok’s ‘Ask’ feature no longer free as X moves it behind paywall
- Mewgenics vinyl limited editions now available to pre-order
- How to Get to the Undercoast in Esoteric Ebb
- Gold Rate Forecast
- Assassin’s Creed Shadows will get upgraded PSSR support on PS5 Pro with Title Update 1.1.9 launching April 7
- Invincible Season 4 Episode 6 Release Date, Time, Where to Watch
- ‘Timur’ Trailer Sees Martial Arts Action Collide With a Real-Life War Rescue
2026-01-19 19:39