Author: Denis Avetisyan
A new framework integrates wildlife movement, genomic data, and environmental factors to improve forecasting of highly pathogenic avian influenza outbreaks.
This study introduces zooNet, a heterogeneous graph network model for spatiotemporal epidemiological reasoning under sparse data, focusing on avian influenza A/H5 circulation in wildlife.
Wildlife pathogen surveillance is often hampered by sparse, detection-driven data that obscures underlying transmission dynamics. To address this, we present ‘From Ecological Connectivity to Outbreak Risk: A Heterogeneous Graph Network for Epidemiological Reasoning under Sparse Spatiotemporal Data’, introducing zooNet, a framework integrating ecological, genomic, and spatiotemporal information within a unified graph structure. Applying zooNet to highly pathogenic avian influenza A/H5 in US wild bird data, we demonstrate consistent identification of ongoing transmission weeks to months before confirmed detections, even in areas with limited sequencing. Could this approach unlock proactive surveillance and risk assessment for emerging zoonotic diseases across diverse wildlife reservoirs?
Unveiling the Lag in Avian Influenza Surveillance
Current avian influenza surveillance systems, often reliant on monitoring sick or dead birds reported by the public or limited farm inspections, present a critical lag in detecting and responding to evolving viral threats. This reactive approach struggles to keep pace with the rapid mutation rate of influenza viruses, particularly those exhibiting high pathogenicity. The infrequent and geographically constrained sampling inherent in these traditional methods frequently misses early signals of viral spread, allowing outbreaks to establish themselves before effective control measures can be implemented. Consequently, resources are often diverted towards containment rather than proactive prevention, increasing economic losses and posing a continued risk to both poultry populations and potential zoonotic spillover events. This reliance on delayed detection underscores the urgent need for more dynamic and comprehensive surveillance strategies.
Current avian influenza surveillance often falls short due to a fragmented approach to data analysis. Traditional risk assessments typically operate in silos, examining genomic data – viral evolution and strain identification – separately from spatial information, such as migratory patterns and farm locations, and crucial ecological factors like wild bird populations and environmental conditions. This lack of integration hinders a complete understanding of disease dynamics, obscuring transmission pathways and preventing accurate prediction of outbreak risks. Consequently, responses are often reactive rather than proactive, struggling to anticipate spread beyond immediate detections and limiting the effectiveness of preventative measures. A holistic view, combining these diverse data streams, is essential for building a robust and predictive surveillance system capable of mitigating the impacts of highly pathogenic avian influenza.
The escalating global prevalence of highly pathogenic avian influenza A/H5 necessitates a fundamental shift from reactive containment to predictive outbreak management. Current surveillance systems, often reliant on confirmed cases reported after symptoms appear, struggle to keep pace with the virus’s remarkable mutation and dissemination rates. A novel framework, detailed in this study, addresses this challenge by integrating diverse datasets – including viral genomic sequences, migratory bird patterns, and environmental factors – into a dynamic forecasting model. This approach demonstrates a quantifiable improvement in predicting the spatial and temporal spread of the virus, enabling preemptive interventions such as targeted vaccination campaigns and enhanced biosecurity measures. By transitioning towards a proactive, data-driven paradigm, public health officials and agricultural stakeholders can significantly reduce the economic and ecological impacts of highly pathogenic avian influenza.
ZooNet: A Graph-Based Epidemiological Framework-Modeling the Connections
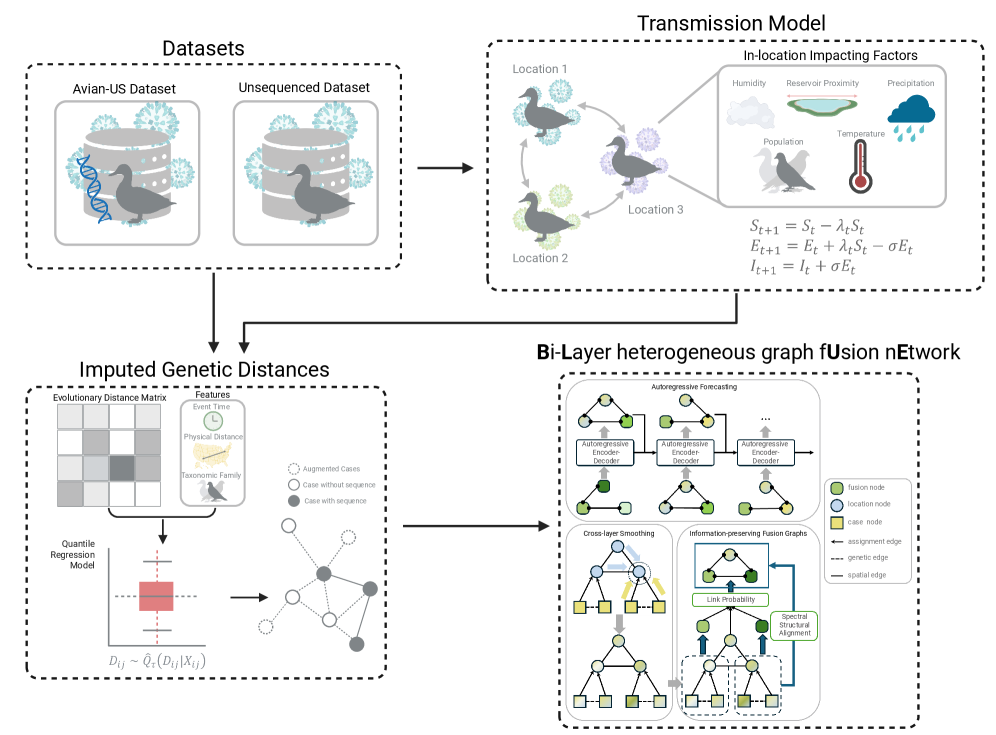
ZooNet employs a bi-layer heterogeneous graph structure to model epidemiological data, consisting of two interconnected layers: an outbreak layer and a region layer. The outbreak layer represents individual disease occurrences, characterized by attributes such as location, time, and viral strain. The region layer models administrative areas – including counties and flyways – and incorporates static features like population density, land cover, and ecological characteristics. Edges within and between these layers define relationships; for instance, outbreaks within the same region are connected, as are outbreaks geographically proximate to each other. This bi-layer approach enables the integration of both event-specific data and static regional factors, providing a holistic representation of disease spread and facilitating the analysis of spatial-temporal patterns.
The ZooNet framework incorporates multiple data types to construct its bi-layer heterogeneous graph. Genomic sequences of viral isolates provide information on pathogen evolution and relatedness. Spatial locations, detailing outbreak sites, are integrated with geographic data. Ecological factors are derived from sources such as eBird Data, which tracks bird observations and distributions, and USA Avian Flyways, outlining migratory routes. These datasets, combined with temporal data on outbreak occurrences, provide a multi-faceted representation of disease spread and facilitate the modeling of transmission dynamics.
ZooNet models avian influenza transmission by representing four key relationships within a graph-based framework: Spatial Proximity, which links locations geographically close to each other; Temporal Adjacency, connecting events occurring in close succession; Host Similarity, relating hosts based on species and characteristics; and Genetic Relatedness, establishing connections between viral sequences. The integration of these relationships allows ZooNet to capture the complex interplay of factors driving disease spread and achieve competitive forecasting performance across established US avian flyways, demonstrating improved predictive capability compared to existing epidemiological models.
Imputing the Gaps: Genetic Relationships and Signal Smoothing
ZooNet addresses the challenge of incomplete genomic data in viral strain analysis through Genetic Distance Imputation. This process utilizes models, notably the Kimura Two-Parameter Model, to estimate genetic distances and infer relationships between strains even when full genomic sequences are unavailable. The Kimura Two-Parameter Model D = -0.5ln(1 - 2p - q) calculates the genetic distance (D) based on the probabilities (p and q) of transitions and transversions, respectively. By imputing these missing data points, ZooNet constructs a more complete network representation of viral evolution and transmission, enabling more robust analyses despite data gaps.
The integration of imputed genetic data into the ZooNet graph structure enhances viral tracking by establishing connections between strains that lack complete genomic sequences. This process creates a more comprehensive network representation of viral relationships, enabling the propagation of information across the graph. By linking incomplete data points, the system can more accurately infer evolutionary pathways and predict the spread of viral variants. Specifically, imputed genetic distances are used as edge weights, reflecting the degree of relatedness between nodes – representing viral strains – within the network. This augmented graph then facilitates improved analysis of viral dynamics and transmission patterns.
Laplacian Regularization and Cross-layer Smoothing were implemented to improve the accuracy of signal propagation within the ZooNet graph structure. Laplacian Regularization minimizes noise by leveraging the graph’s connectivity, assuming similar nodes should have similar values. Cross-layer Smoothing further refines signals by propagating information across different layers of the graph, enabling the integration of data from multiple sources and reducing the impact of individual data errors. Evaluation in the Atlantic Flyway demonstrated a Mean Squared Error (MSE) of 49.85 ± 10.48, representing the lowest MSE achieved compared to other analytical approaches.
Predictive Power and Ecological Modeling: Understanding the Drivers
ZooNet employs a novel approach to disease outbreak prediction by representing geographic areas and their connections as a dynamic, evolving graph. This spatiotemporal graph learning technique allows the system to analyze how disease risk changes not only across space, but also over time, factoring in animal movement patterns and environmental influences. Utilizing graph neural networks, ZooNet then processes this complex web of information to identify areas with elevated risk, effectively learning the patterns that precede outbreaks. The framework’s predictive power stems from its ability to go beyond simple location-based risk assessments, instead focusing on the interconnectedness of ecosystems and the cascading effects of disease transmission, ultimately providing more accurate and timely forecasts than traditional methods.
ZooNet’s predictive capacity extends beyond simple pattern recognition through the incorporation of ecological modeling, fundamentally linking disease spread to environmental conditions. The framework utilizes the graph structure – representing animal movement and interactions – to inform these models, allowing researchers to assess how factors like temperature, precipitation, and land cover influence transmission rates. This approach moves beyond correlative studies by establishing a mechanistic understanding of disease dynamics; for instance, models can simulate how changes in wetland availability affect the concentration of waterfowl – and thus, the potential for viral exchange. By integrating environmental data with the network of animal interactions, ZooNet doesn’t just identify where outbreaks might occur, but begins to explain why, offering a pathway towards more targeted and effective preventative measures.
ZooNet enhances disease outbreak prediction by combining real-world surveillance with simulations from Susceptible-Exposed-Infectious (SEI) models, offering a crucial advantage for proactive intervention. This integrated approach not only leverages existing data but also forecasts potential spread based on epidemiological dynamics. Analysis reveals a particularly strong correlation – a Pearson Correlation of 0.2173 ± 0.0644 – within the Pacific Flyway, indicating the framework’s ability to accurately reflect transmission patterns in this region. Furthermore, the model achieved its highest F1-score (0.1383 ± 0.0725) in the same flyway, suggesting effective identification of outbreak events. Notably, the Atlantic Flyway exhibited the lowest Mean Absolute Error (21.49 ± 2.34), demonstrating the system’s capacity for precise forecasting in specific geographic contexts and ultimately enabling targeted public health responses.
Towards a Proactive Global Health Surveillance System: Expanding the Horizon
The ZooNet system utilizes a graph-based architecture designed for inherent flexibility, extending its capabilities beyond the initial focus on avian influenza. This framework represents entities – such as animal species, geographic locations, and viral strains – as nodes, with connections defining relationships like transmission pathways or migratory routes. By representing complex ecological networks in this manner, the system isn’t limited to a single disease; the same architecture readily accommodates data related to other zoonotic threats, including those originating in diverse animal reservoirs. This unified approach facilitates cross-disease surveillance, allowing researchers to identify potential spillover events and emerging risks that might otherwise be missed when analyzing diseases in isolation. The adaptability of ZooNet provides a scalable solution for a proactive global health strategy, creating a common platform for monitoring and responding to a wide range of infectious disease threats.
The emergence of novel infectious diseases demands a surveillance system capable of synthesizing information from disparate sources – genomic data, animal health reports, human case records, and even environmental factors. This framework addresses that need by employing a graph-based architecture designed to ingest and correlate these diverse datasets. Advanced analytical techniques, including network analysis and machine learning algorithms, are then applied to identify patterns and predict potential outbreaks with greater accuracy. Crucially, the system isn’t limited by data type or geographic location; its scalability allows for the seamless incorporation of new information streams and expansion to cover a broader range of pathogens and regions, offering a proactive and adaptable approach to strengthening global health security and building resilience against future pandemics.
Efforts are now concentrating on refining the system’s capacity for immediate data assimilation and the development of algorithms capable of forecasting outbreaks before they escalate. Recent analysis indicates an infection rate of 0.0487 ± 0.0110 within the Pacific Flyway, a key migratory route for birds, and highlights predictive modeling challenges with a Mean Squared Error of 155.81 ± 48.91 also observed in this region; conversely, the Central Flyway demonstrates higher accuracy in Mean Absolute Error predictions at 29.86 ± 3.86. Integrating these real-time data streams and improving the precision of predictive models are crucial steps towards establishing a global health surveillance system capable of proactively mitigating the impact of emerging infectious diseases and fostering a more robust and responsive defense against future pandemics.
The framework detailed in this research subtly echoes a fundamental principle of ordered systems. As Thomas Hobbes observed, “The life of man is solitary, poor, nasty, brutish, and short.” While seemingly pessimistic, this observation highlights the inherent fragility of existence without interconnectedness and regulation. zooNet, by meticulously mapping ecological and genomic relationships, attempts to counter that ‘nastiness’ through predictive modelling. The heterogeneous graph network establishes a form of ‘social contract’ for epidemiological understanding, offering a structured means to anticipate outbreaks and mitigate risk, turning potential chaos into manageable foresight. This emphasis on interconnectedness and preemptive action demonstrates an elegant solution to a complex problem.
What’s Next?
The pursuit of predictive power in epidemiology often feels like chasing shadows, a frantic attempt to impose order on systems fundamentally resistant to complete comprehension. ZooNet, by thoughtfully integrating ecological connectivity with genomic surveillance, represents a step towards a more nuanced understanding of HPAI circulation. However, the elegance of the framework only highlights the remaining dissonances. The current reliance on sparse spatiotemporal data, while pragmatically necessary, introduces a fragility; the model sings, but its voice is easily drowned out by gaps in observation.
Future iterations must address the challenge of truly active surveillance – moving beyond reactive sampling to anticipatory data collection. Furthermore, the implicit assumption of a static ecological network deserves scrutiny. Wildlife populations aren’t fixed landscapes; their movement, behavior, and interactions shift, creating a dynamic backdrop against which viral transmission unfolds. Capturing this fluidity-perhaps through integration with agent-based models-could move the field beyond correlation towards something approaching genuine prediction.
Ultimately, the true test of such frameworks isn’t their ability to forecast outbreaks, but their capacity to inform effective intervention strategies. A beautifully tuned model that fails to translate insights into tangible benefits remains merely an aesthetic exercise. The goal, then, isn’t simply to see the shadows, but to design a light that banishes them-a task demanding not just computational innovation, but a profound respect for the complexity of the natural world.
Original article: https://arxiv.org/pdf/2601.09738.pdf
Contact the author: https://www.linkedin.com/in/avetisyan/
See also:
- United Airlines can now kick passengers off flights and ban them for not using headphones
- Crimson Desert: Disconnected Truth Puzzle Guide
- All 9 Coalition Heroes In Invincible Season 4 & Their Powers
- The Boys Season 5 Spoilers: Every Major Character Death If the Show Follows the Comics
- Mewgenics vinyl limited editions now available to pre-order
- Invincible Season 4 Episode 6 Release Date, Time, Where to Watch
- Grok’s ‘Ask’ feature no longer free as X moves it behind paywall
- Assassin’s Creed Shadows will get upgraded PSSR support on PS5 Pro with Title Update 1.1.9 launching April 7
- Solo Leveling’s New Manhwa Chapter Revives a Forgotten LGBTQ Story After 2 Years
- ‘Timur’ Trailer Sees Martial Arts Action Collide With a Real-Life War Rescue
2026-01-17 20:27