Author: Denis Avetisyan
A new self-supervised learning pipeline automatically identifies and labels transient events within spectrograms, offering a powerful tool for analyzing everything from fusion plasmas to animal vocalizations.
This work demonstrates robust event extraction from time-frequency representations using neural networks trained without manual labels, generalizing across diverse datasets including tokamak diagnostics and bioacoustics.
The increasing volume of complex data generated by modern scientific instruments often outpaces traditional manual analysis techniques. Addressing this challenge, we present a novel framework detailed in ‘Fast Spectrogram Event Extraction via Offline Self-Supervised Learning: From Fusion Diagnostics to Bioacoustics’, which automatically extracts and labels transient events from time-frequency representations of signals. This self-supervised pipeline leverages neural networks to identify coherent modes in diverse datasets, demonstrating robust generalization across tokamak diagnostics and even extending to bioacoustic applications. Could this signals-first approach unlock new avenues for automated discovery and real-time control in complex physical systems?
Decoding the Language of Plasma: Unveiling Hidden Instabilities
Achieving viable fusion energy hinges on the precise control of plasma, yet diagnosing instabilities within it presents a formidable challenge. These instabilities, if left unchecked, can quench the fusion reaction and damage the reactor. However, the signals indicative of these crucial events are frequently buried within a sea of stochastic noise – random fluctuations arising from the sheer complexity of plasma turbulence. This noise isn’t merely a nuisance; it actively obscures the coherent signals that would otherwise reveal the nature and progression of instabilities, hindering efforts to develop reliable diagnostic tools and effective control strategies. Consequently, researchers face the ongoing task of developing innovative methods to sift through this chaotic background and extract the vital information necessary to stabilize plasma and unlock the promise of fusion power.
Accurate diagnosis of plasma instabilities, essential for realizing fusion energy, is significantly hampered by the difficulty of discerning genuine signals from pervasive background turbulence. Conventional signal processing methods, designed for clearer data, often fail to effectively isolate the weak, coherent signatures of these instabilities amidst the strong stochastic noise inherent in plasma environments. This inability to separate signal from noise leads to misinterpretations of plasma behavior, inaccurate estimations of key parameters, and ultimately, hinders efforts to control and optimize fusion reactions. The challenge lies not simply in amplifying the desired signal, but in developing algorithms capable of identifying and filtering out the complex, multi-scale turbulence that obscures the crucial information embedded within the noisy data.
The inherent turbulence within plasmas presents a significant hurdle to accurate diagnostics, demanding analytical methods beyond conventional signal processing. Spectrograms, visual representations of signal frequencies over time, often appear as dense, chaotic patterns due to the superposition of coherent plasma signals and stochastic noise. Extracting meaningful data requires sophisticated algorithms – wavelet analysis, machine learning, and advanced spectral estimation techniques – capable of discerning subtle, embedded patterns. These methods don’t simply filter noise; they aim to deconstruct the complex interplay between coherent structures and background fluctuations, revealing the underlying physics driving plasma instabilities and ultimately enabling more reliable control and optimization of fusion devices. Consequently, the development of these techniques is not merely a matter of improving signal clarity, but of unlocking a deeper understanding of plasma behavior itself.
Accurate plasma diagnostics, essential for achieving viable fusion energy, are fundamentally limited by the pervasive presence of noise – not merely random static, but complex signals originating from a multitude of sources within the plasma itself. These include turbulent eddies, electromagnetic fluctuations, and even the diagnostic instruments employed for measurement. Identifying and characterizing these noise sources – distinguishing them from the coherent signals indicative of critical plasma instabilities – is therefore paramount. Researchers are increasingly focused on developing sophisticated algorithms and advanced signal processing techniques specifically designed to deconstruct these complex signals, effectively separating the ‘signal’ from the ‘noise’. This detailed understanding isn’t simply about cleaning up data; it’s about revealing the underlying physics governing plasma behavior, ultimately allowing for more precise control and optimization of fusion devices and unlocking the full potential of plasma-based diagnostics.

Isolating the Signal: Advanced Spectroscopic Techniques
Baseline removal in spectrogram processing addresses the issue of broadband turbulence masking coherent signals. Spectrograms often exhibit a high-amplitude, low-frequency background originating from plasma turbulence and instrumental noise. This baseline obscures the typically lower-amplitude, higher-frequency signals associated with coherent modes, such as those caused by instabilities or wave phenomena. Baseline removal algorithms estimate and subtract this turbulent background, typically using techniques like polynomial fitting, median filtering, or adaptive filtering. Successful baseline removal significantly improves the signal-to-noise ratio of coherent modes, enabling their accurate identification and characterization within the spectrogram data. The choice of algorithm and its parameters are critical, as aggressive baseline removal can distort or eliminate genuine coherent signals.
Multichannel denoising techniques improve signal clarity in plasma diagnostics by exploiting spatial correlations within stochastic noise. These methods utilize data from multiple, simultaneously measured signals to statistically differentiate coherent plasma features from random fluctuations. Algorithms such as wavelet-based denoising and principal component analysis are applied to the multichannel data, effectively suppressing noise while preserving the amplitude and phase of signals originating from subtle plasma instabilities. By averaging or filtering across multiple channels, the signal-to-noise ratio is increased, allowing for the detection of weak signals and improved characterization of plasma behavior that would otherwise be obscured by background noise.
High-resolution magnetic measurements, utilizing techniques such as flux loops and magnetic probes, provide crucial data regarding the plasma’s magnetic field structure and fluctuations. These measurements are often coupled with diagnostics like electron cyclotron emission (ECE) – a form of microwave spectroscopy – which allows for the determination of electron temperature and density profiles. By simultaneously acquiring magnetic field data and ECE measurements, researchers can establish a comprehensive dataset correlating plasma temperature, density, and magnetic field behavior. This combined approach enables detailed analysis of plasma instabilities, turbulence characteristics, and energy transport mechanisms, exceeding the capabilities of either diagnostic alone.
The synergistic application of baseline removal, multichannel denoising, and high-resolution magnetic measurements enables the identification of plasma instabilities previously masked by background noise and turbulence. By first subtracting broadband contributions from spectrograms, researchers can isolate coherent signals indicative of instabilities. Subsequent denoising techniques further reduce stochastic noise, improving the signal-to-noise ratio and revealing subtle features. Correlating these spectroscopic observations with detailed magnetic field data provides the necessary context to characterize the observed instabilities, including their spatial structure, growth rate, and drive mechanisms – data unattainable with individual techniques alone.

From Diagnostics to Insight: Identifying Plasma Instabilities
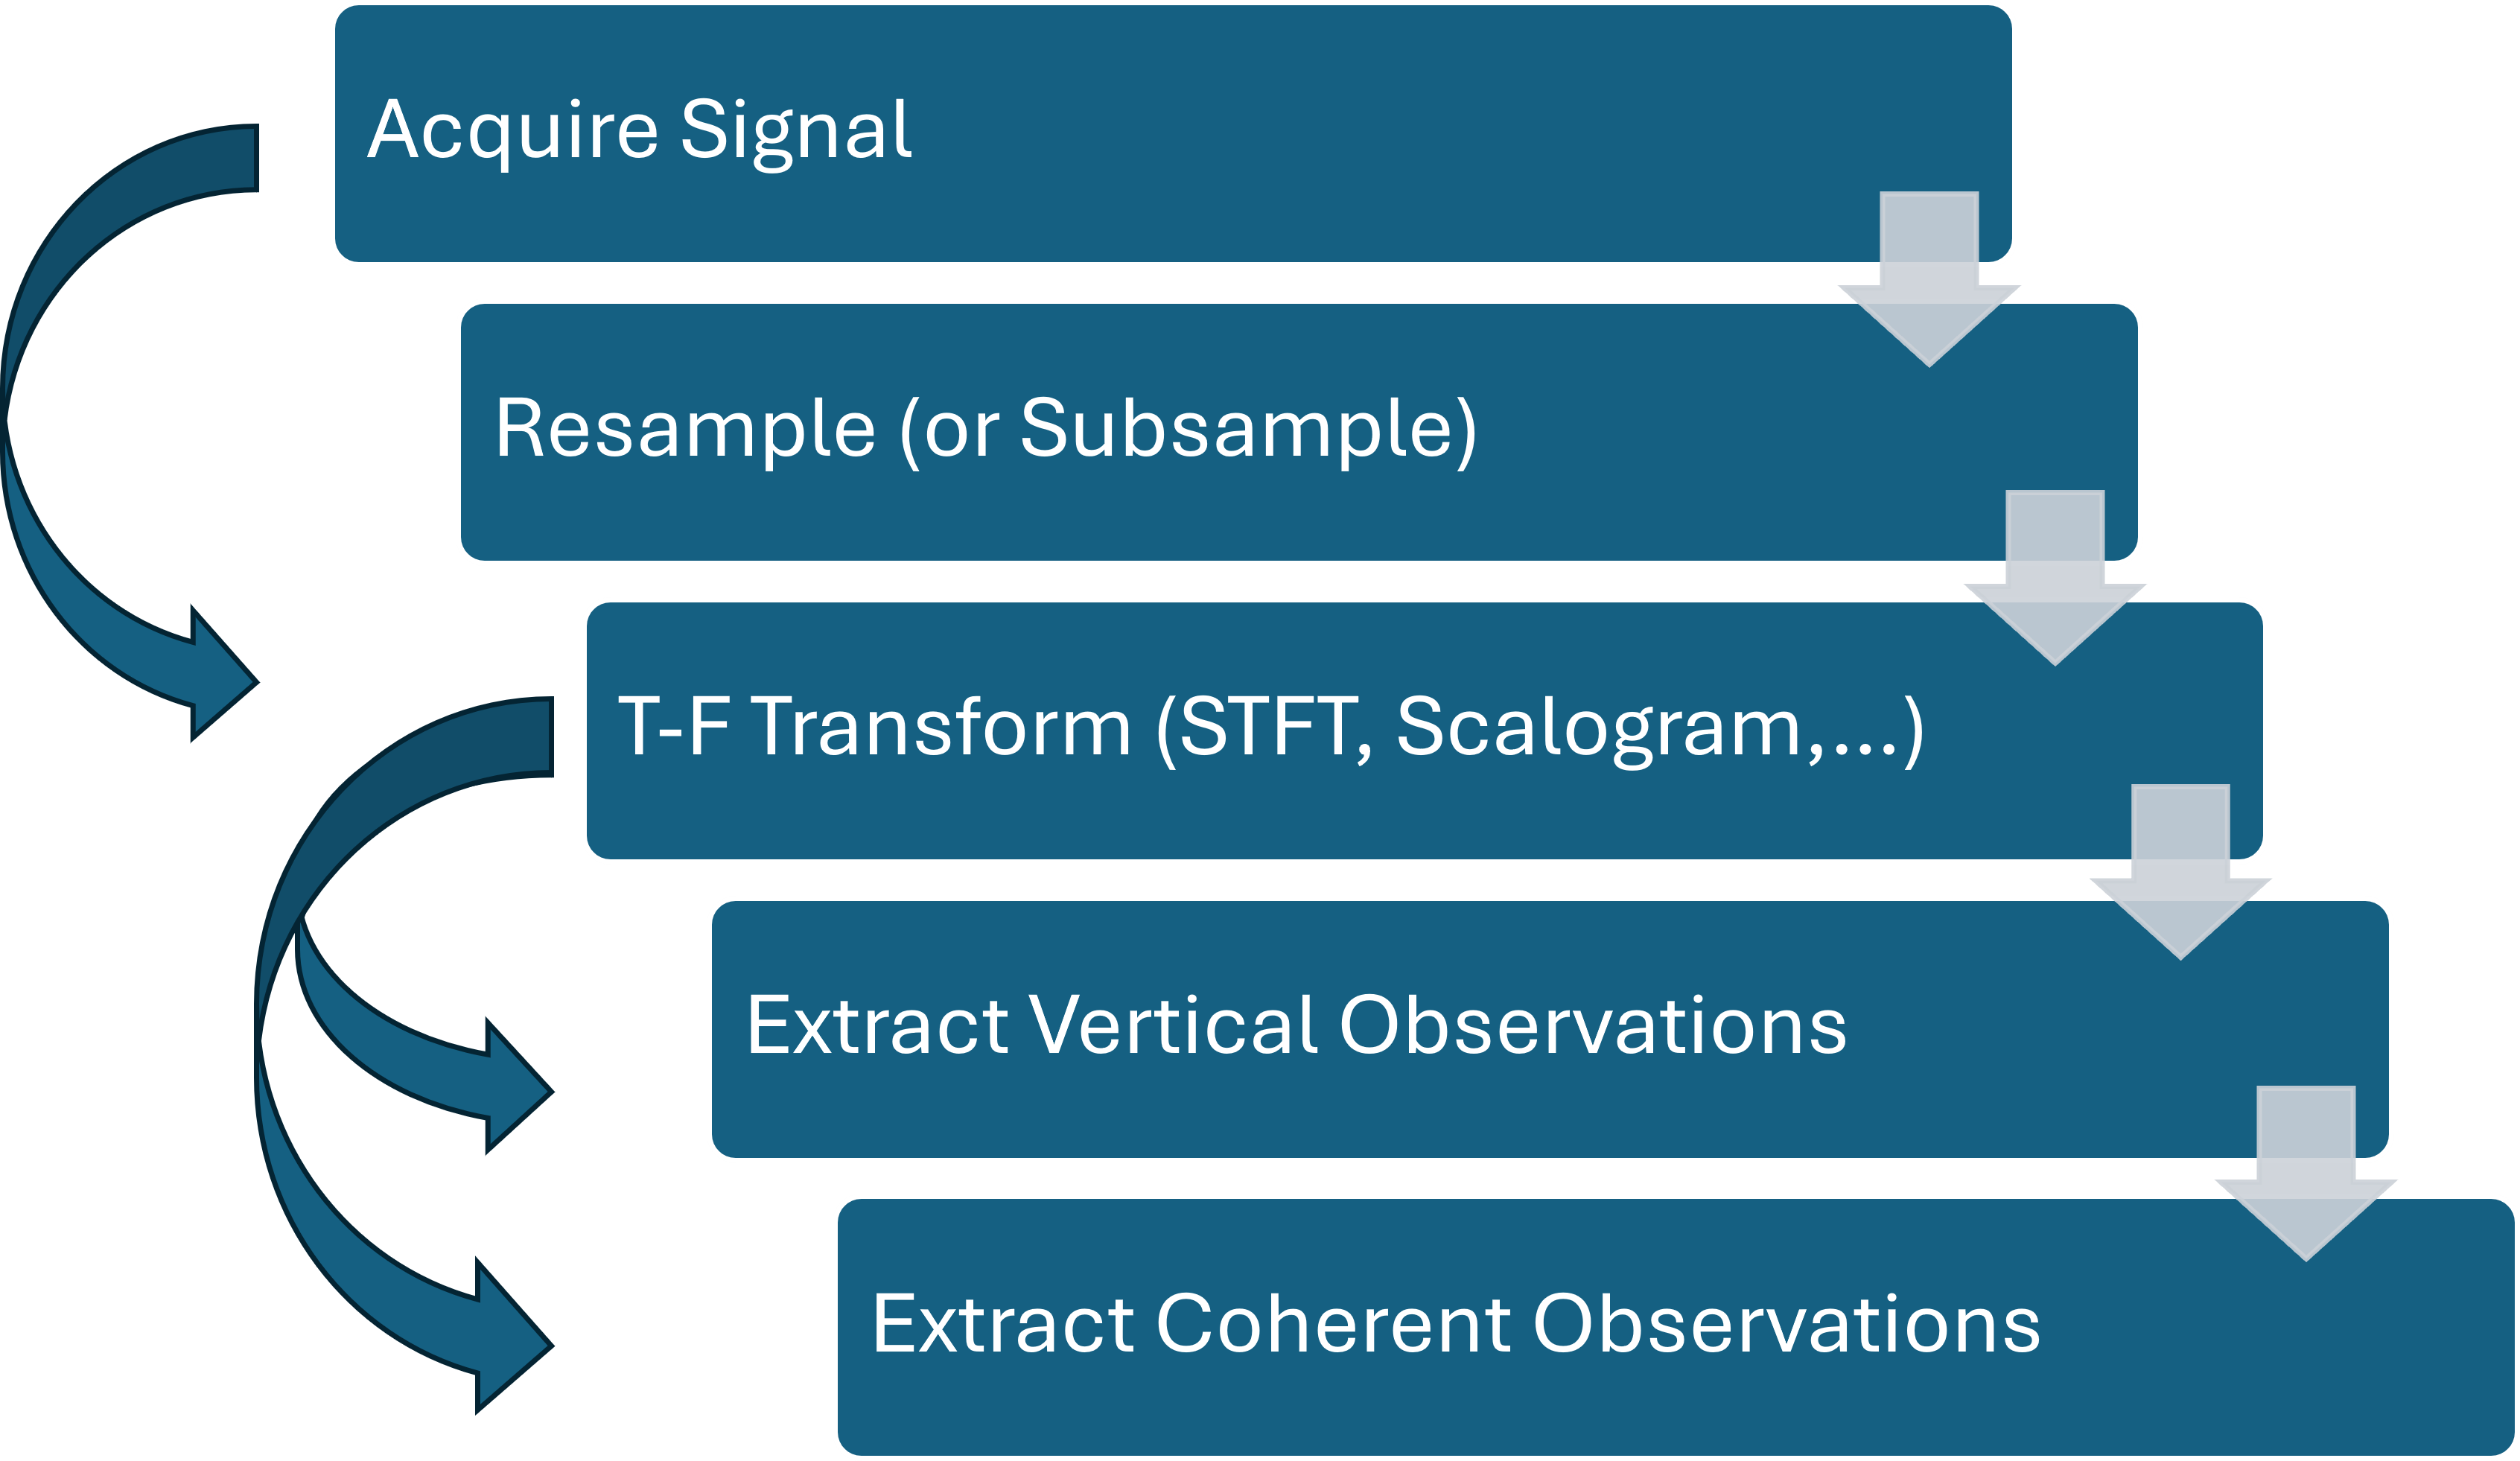
Spectrograms are generated by applying the Short-Time Fourier Transform (STFT) to plasma diagnostic signals, effectively creating a two-dimensional representation of signal frequency content as it changes over time. These visualizations are crucial for identifying plasma instabilities because different instability types-such as Alfvén Eigenmodes, Edge Localized Modes (ELMs), and Tearing Modes-exhibit characteristic frequency signatures and temporal behaviors. For example, Alfvén Eigenmodes typically appear as discrete frequencies, while ELMs manifest as bursts of broad-spectrum activity. The STFT process involves dividing the signal into short segments and performing a Fourier Transform on each, allowing for the observation of these frequency changes over the duration of the plasma discharge. Analyzing the spectrogram’s features-frequency, amplitude, and temporal evolution-enables researchers to diagnose the presence and characteristics of these instabilities, which are critical to maintaining stable plasma confinement in fusion devices.
Plasma diagnostics deployed on advanced fusion devices, notably the DIII-D tokamak and the TJ-II stellarator, routinely generate spectrograms used for instability detection. These diagnostics typically employ arrays of magnetic probes and/or reflectometry systems to measure fluctuations in magnetic fields or plasma density. The resulting time-frequency representations – the spectrograms – provide a visual depiction of the amplitude and frequency content of these fluctuations. Data acquisition systems on DIII-D and TJ-II are capable of high temporal and frequency resolution, enabling the identification of a broad range of instabilities, from low-frequency MHD modes to high-frequency kinetic instabilities. The data richness of these spectrograms stems from the large number of diagnostic channels and the extended duration of data collection during experiments, providing statistically significant information for characterizing plasma instabilities.
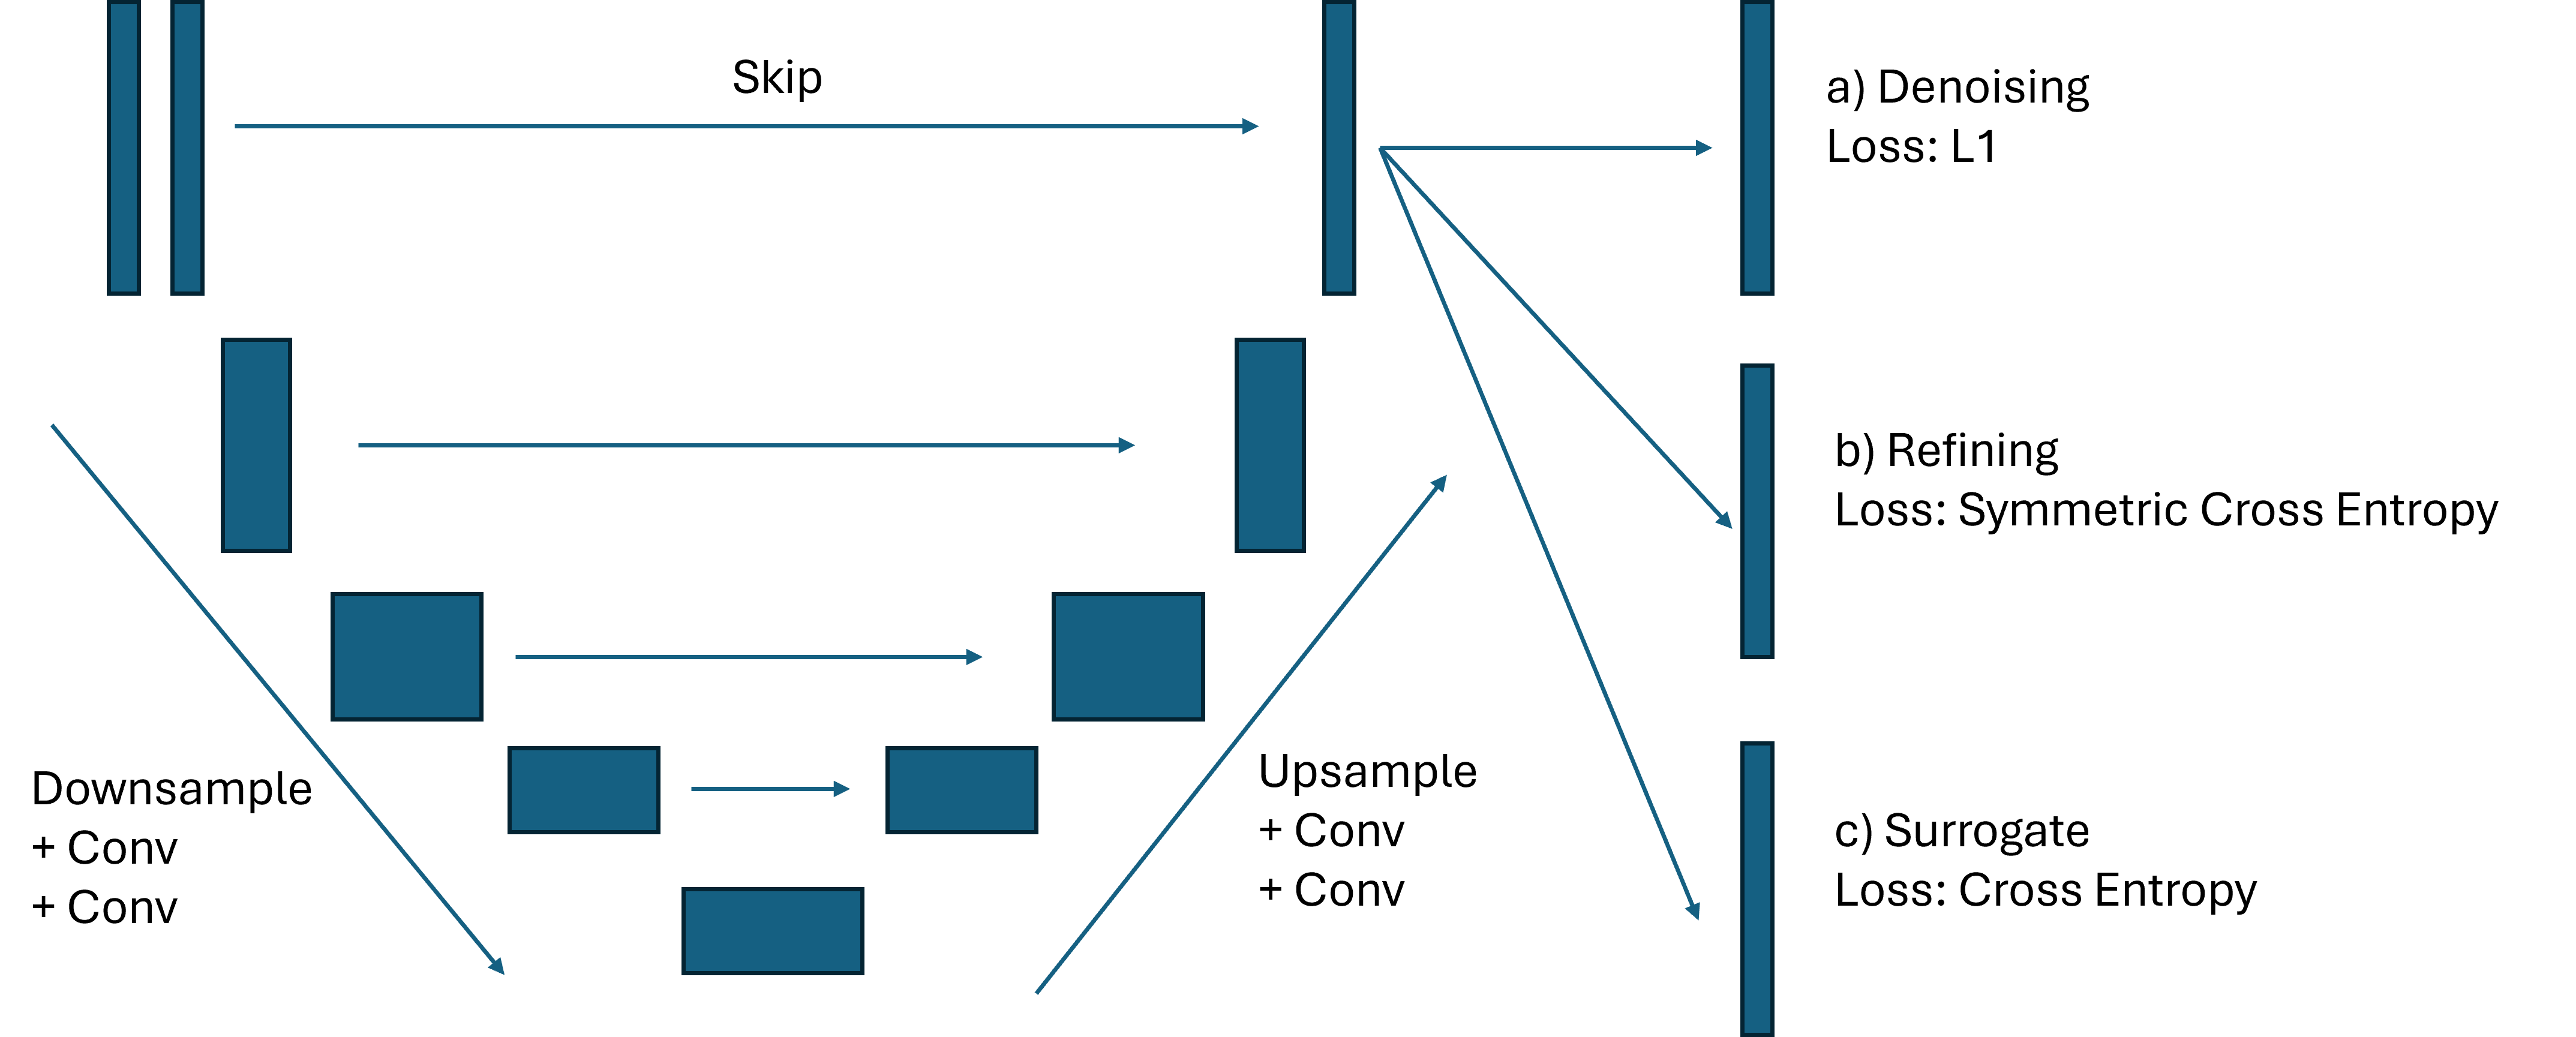
Automated identification of features within plasma spectrograms is achieved through image segmentation techniques. Simple thresholding methods isolate features based on intensity values, while more complex semantic segmentation, utilizing U-Net convolutional neural network architectures, provides pixel-wise classification of instability modes. U-Net’s encoder-decoder structure effectively captures contextual information, allowing it to differentiate between various instability signatures, even with limited training data. The output of these segmentation processes is a labeled spectrogram, where each pixel is assigned a class corresponding to a specific instability or background noise, enabling quantitative analysis and real-time monitoring of plasma dynamics.
Automated analysis of plasma diagnostics data, specifically spectrograms, enables the characterization of plasma behavior under a wide range of experimental conditions with significantly reduced analysis time. Traditional manual analysis is often time-consuming and subject to human interpretation, potentially introducing bias or inconsistencies. Automated techniques, leveraging algorithms to identify and classify instability features, facilitate the processing of large datasets generated during experiments on devices like DIII-D and TJ-II Stellarator. This rapid data processing allows researchers to efficiently compare plasma responses across varying parameters – such as magnetic field strength, plasma density, and heating power – ultimately accelerating the optimization of plasma confinement and performance. The ability to quickly assess behavior across diverse conditions is crucial for validating theoretical models and improving predictive capabilities in fusion research.

Beyond Observation: Harnessing Machine Learning for Predictive Control
Recent advances demonstrate the power of self-supervised learning in bolstering plasma instability detection. Utilizing U-Net architectures, researchers are now able to train effectively on the vast amounts of unlabeled spectrogram data commonly produced in fusion experiments. This approach bypasses the need for extensive, manually labeled datasets-a significant bottleneck in traditional machine learning. By learning inherent patterns within the spectrograms themselves, the U-Net models develop a robust understanding of plasma behavior, improving their capacity to pinpoint and categorize instabilities with greater accuracy. The technique not only enhances detection rates but also reduces reliance on expert annotation, paving the way for more efficient and scalable plasma control systems.
By treating plasma spectrograms as images, researchers are employing semantic segmentation – a technique originally developed for computer vision – to gain an unprecedented, pixel-wise understanding of plasma dynamics. This approach moves beyond simply detecting instabilities to actively identifying their precise location and characteristics within the spectrogram, revealing subtle patterns often imperceptible to the human eye. Each pixel is classified, indicating the type of plasma behavior it represents, allowing for the mapping of instability development and propagation with high spatial resolution. Consequently, previously hidden precursors to disruptions – events that can prematurely terminate fusion reactions – become visible, offering the potential for proactive control and improved stability in fusion experiments. This detailed analysis unlocks a deeper understanding of complex plasma phenomena and paves the way for more reliable and efficient fusion energy production.
The pursuit of robust machine learning models for complex systems often faces a critical hurdle: the availability of sufficiently large, labeled datasets. Interestingly, solutions can emerge from unexpected sources; the DCLDE dataset, originally compiled for the study of marine mammal vocalizations, has proven surprisingly effective as a training ground for algorithms designed to analyze plasma instabilities. This cross-disciplinary application leverages the shared characteristics of signal processing challenges across seemingly disparate fields-both bioacoustic signals and plasma spectrograms exhibit complex temporal and spectral features. By initially training on the extensive DCLDE dataset, researchers can establish a strong foundation for their models before fine-tuning them on the comparatively smaller datasets of plasma physics experiments, significantly accelerating development and improving generalization capabilities. This resourceful approach demonstrates the potential for leveraging data from one domain to address challenges in another, fostering innovation and reducing the reliance on expensive and time-consuming data acquisition.
A novel data-driven pipeline demonstrates a high degree of accuracy in identifying plasma instabilities within the TJ-II stellarator, achieving a recall of 0.825 when evaluated against expert-labeled data. Notably, the system’s efficacy extends beyond its initial application; without any retraining, the same pipeline successfully generalized to the analysis of bioacoustic signals, attaining recalls of 0.7708 for the common dolphin (Delphinus capensis) and 0.7953 for the short-beaked common dolphin (Delphinus delphis). This cross-domain performance suggests the learned features capture fundamental patterns relevant to signal analysis generally, highlighting the potential for leveraging techniques developed in plasma physics to address challenges in fields like marine biology and vice versa.
The developed instability detection pipeline demonstrates a compelling balance between accuracy and computational efficiency. Utilizing a graphics processing unit (GPU) allows for near real-time analysis, completing inference in just 0.5 seconds per plasma shot – a critical feature for applications demanding immediate feedback or control. However, the system remains functional, albeit at a reduced speed, when deployed on a central processing unit (CPU), requiring between 5 and 10 seconds per shot. This adaptability broadens the potential deployment scenarios, allowing for utilization in environments where dedicated GPU hardware is unavailable, though at the cost of timely insights.
The pursuit of automatically extracting meaningful events from complex signals, as demonstrated in this work with plasma diagnostics and bioacoustics, echoes a fundamental principle of understanding any system: discerning order from chaos. The presented pipeline, leveraging time-frequency analysis and self-supervised learning, attempts to reveal underlying patterns previously hidden within raw data. This resonates with Richard Feynman’s assertion: “The first principle is that you must not fool yourself – and you are the easiest person to fool.” Rigorous analysis, as applied here to spectrograms, forces a confrontation with the data, preventing the imposition of preconceived notions and allowing true anomalies – whether in fusion plasmas or animal vocalizations – to emerge. The strength of the method lies in its ability to generalize, suggesting a universal logic governing these seemingly disparate phenomena.
What Lies Ahead?
The presented work functions as a microscope, revealing patterns in complex signals previously obscured by the sheer volume of data. However, even with enhanced visibility, the nature of the ‘specimen’ – transient events in plasma physics and beyond – remains stubbornly multifaceted. While the self-supervised pipeline demonstrates a remarkable capacity for generalization, it is not a universal solvent. The model’s success hinges on the underlying assumption that meaningful patterns are inherently present in the unlabeled data, a proposition that, while intuitively appealing, warrants continued scrutiny. The transferability to bioacoustics is encouraging, yet it also highlights a fundamental question: is the algorithm truly ‘understanding’ these events, or merely recognizing recurring statistical features?
Future work will likely focus on refining the time-frequency representations used as input, exploring alternative neural network architectures capable of capturing longer-range dependencies, and addressing the persistent challenge of interpretability. A crucial step involves moving beyond mere event detection to event characterization – not simply identifying that something happened, but discerning what happened and why.
Ultimately, the pursuit of automated event extraction is not merely a technical exercise. It represents a broader attempt to formalize intuition, to encode expert knowledge into algorithms, and to accelerate scientific discovery. The imperfections of the current model, therefore, are not shortcomings to be eliminated, but rather opportunities to deepen understanding – both of the physical systems under investigation and of the very nature of intelligence itself.
Original article: https://arxiv.org/pdf/2602.20317.pdf
Contact the author: https://www.linkedin.com/in/avetisyan/
See also:
- United Airlines can now kick passengers off flights and ban them for not using headphones
- Crimson Desert: Disconnected Truth Puzzle Guide
- All 9 Coalition Heroes In Invincible Season 4 & Their Powers
- Mewgenics vinyl limited editions now available to pre-order
- Assassin’s Creed Shadows will get upgraded PSSR support on PS5 Pro with Title Update 1.1.9 launching April 7
- Grey’s Anatomy Season 23 Confirmed for 2026-2027 Broadcast Season
- Viral Letterboxd keychain lets cinephiles show off their favorite movies on the go
- Does Mark survive Invincible vs Conquest 2? Comics reveal fate after S4E5
- Crimson Desert Guide – How to Pay Fines, Bounties & Debt
- How to Get to the Undercoast in Esoteric Ebb
2026-02-25 20:28