Author: Denis Avetisyan
New research reveals that while combining multiple data sources can improve financial predictions, these systems are surprisingly vulnerable to even minor data manipulation.
This study assesses view-aligned robustness in same-source financial imaging, emphasizing the need for leakage-resistant evaluation protocols in time-series analysis.
While multi-view learning promises enhanced predictive power in financial time-series, its robustness remains poorly understood, particularly when views are derived from the same source. This work, ‘When Fusion Helps and When It Breaks: View-Aligned Robustness in Same-Source Financial Imaging’, investigates the interplay between fusion strategies, label noise, and adversarial vulnerability using financial image representations of gold price data. Our findings reveal a non-monotonic relationship between data filtering and predictive performance, alongside significant susceptibility to even small perturbations, with late fusion consistently improving robustness under view-constrained attacks. Under what conditions can multi-view financial imaging reliably deliver both accuracy and resilience in the face of noisy data and targeted manipulation?
The Illusion of Prediction: Beyond Statistical Rituals
For decades, the analysis of financial time series data has been heavily dependent on statistical techniques – methods like autoregression and moving averages. While foundational, these approaches often falter when confronted with the non-linear, chaotic, and multi-faceted patterns inherent in real-world financial markets. Traditional methods frequently assume data is stationary or normally distributed, conditions rarely met in volatile environments. Consequently, they struggle to capture intricate dependencies, long-range correlations, and subtle shifts in market behavior, leading to inaccurate predictions and missed opportunities. The limitations of these statistical models have spurred exploration into alternative approaches capable of handling the complexity and nuance of financial data, pushing researchers toward techniques better suited to discern underlying patterns beyond simple linear relationships.
Financial forecasting traditionally depends on statistical analyses, yet struggles to capture the nuanced and often chaotic patterns inherent in market data. Recent work proposes a shift in perspective, transforming raw financial time series data into visual representations akin to images. This innovative approach allows practitioners to apply the robust techniques of computer vision – originally designed for image recognition – to the realm of financial prediction. By encoding time series information as pixels, subtle patterns and dependencies previously obscured become visually apparent, offering deep learning models a new and potentially more effective way to identify predictive signals and ultimately improve forecasting accuracy. The potential lies in treating financial data not as a sequence of numbers, but as a complex visual landscape ripe for exploration.
The conversion of financial time series data into a visually interpretable format centers on a dual representation strategy. First, Open-High-Low-Close-Volume (OHLCV) data, the foundational elements of price action, are encoded as visual elements within the image. This is then augmented with a ‘Technical Indicator Matrix’, where commonly used indicators – such as Moving Averages, RSI, and MACD – are calculated and arranged as additional channels within the image. This combined approach doesn’t merely present data; it constructs a rich, multi-layered visual representation that captures both price dynamics and underlying momentum. The resulting image-like structure is specifically designed to be directly processed by deep learning models, allowing them to identify complex patterns and relationships that might be obscured in traditional numerical time series data, ultimately enhancing predictive capabilities.

The Architecture of Prediction: Fusion and Feature Extraction
Two strategies were investigated for combining multiple representations, or “views,” of the financial data: Early Fusion and Late Fusion. Early Fusion concatenates the raw data from each view prior to feature extraction, creating a single, high-dimensional input. Conversely, Late Fusion processes each data view independently to extract features, then combines these extracted features for prediction. This modular approach of Late Fusion facilitates independent optimization and analysis of each view, while Early Fusion requires a unified feature extraction process capable of handling the combined data characteristics. The selection between these strategies depends on the correlation between views and the computational cost of processing the combined data in Early Fusion.
Late Fusion operates by processing each data view – representing different aspects of the financial data – independently before combining them at a later stage. This modularity enables flexibility in incorporating or excluding specific views without retraining the entire system. To address potential discrepancies arising from independent processing, a Cross-View Consistency Regularization technique is employed. This regularization imposes a penalty during training when predictions derived from different views diverge significantly, effectively encouraging agreement between the views and improving the robustness and accuracy of the overall prediction model.
The prediction model utilizes a Convolutional Neural Network (CNN) to process the integrated data representations. Following the fusion of different data views into a unified image-like structure, the CNN applies convolutional filters to extract hierarchical features from this representation. These learned features are then fed into fully connected layers for final prediction. The CNN architecture was selected for its capacity to automatically learn spatial hierarchies and translational invariance, enabling effective pattern recognition within the fused data. The specific configuration of convolutional layers, pooling operations, and fully connected layers was determined through experimentation and hyperparameter optimization to maximize predictive performance on the validation dataset.
Refining the Signal: Data Integrity and Validation
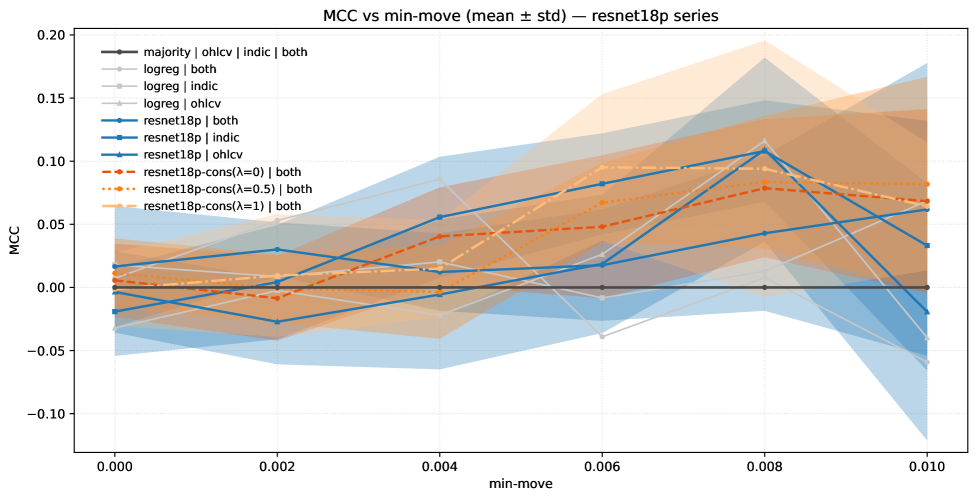
The implementation of a Minimum Movement Threshold served to refine the training dataset by excluding price changes below a pre-defined magnitude. This filtering process aimed to reduce noise and focus model learning on substantial price movements, thereby improving signal clarity. The threshold value was determined empirically through analysis of historical price data to balance noise reduction with data retention; values below this threshold were considered statistically insignificant for predictive modeling and were removed from the training set. This data cleansing step is crucial for preventing the model from overfitting to minor, random fluctuations in price.
To mitigate data leakage and ensure unbiased model evaluation, a Leakage-Resistant Time-Block Split was implemented during the training process. This methodology divides the historical data into sequential time blocks, strictly adhering to a forward-walking approach. Specifically, earlier blocks are used for training, while subsequent, non-overlapping blocks are reserved for validation and testing. This prevents the model from being trained on data from time periods it is intended to predict, thereby avoiding artificially inflated performance metrics and ensuring a realistic assessment of its predictive capabilities on unseen data. The split is designed to simulate real-world forecasting scenarios where future information is unavailable during the training phase.
Evaluations conducted on SGE Gold Spot Data demonstrate a measurable improvement in predictive accuracy following the implementation of these techniques. Specifically, a peak Matthews Correlation Coefficient (MCC) of 0.129 was achieved. This MCC value serves as a key performance indicator and establishes a baseline for future robustness evaluations and comparisons with alternative predictive models or parameter configurations. The MCC was chosen due to its suitability for imbalanced datasets, commonly encountered in financial time series analysis, and its ability to accurately reflect the quality of predictions beyond simple accuracy rates.
The Illusion of Control: Adversarial Manipulation and System Fragility
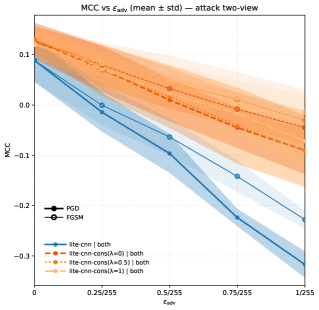
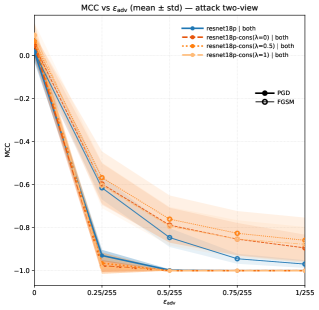
The study delved into the adversarial robustness of a multimodal model, specifically examining its vulnerability to manipulated input data. Researchers assessed the model’s performance under two distinct attack strategies: view-constrained attacks, which target individual input modalities, and joint attacks, where perturbations are applied across all modalities simultaneously. This investigation utilized L^\in fty-bounded perturbations-subtle alterations to the input-to simulate realistic adversarial scenarios. The goal was to determine the model’s capacity to maintain accurate predictions even when presented with deliberately deceptive data, and to understand how different attack types impact its reliability. Evaluating performance against both isolated and combined attacks provides a comprehensive assessment of the model’s resilience in potentially hostile environments.
The model’s resilience to subtle, yet deliberate, data alterations was evaluated through the application of L^\in fty-bounded perturbations. This technique introduces minimal, imperceptible changes to input data – changes designed to mislead the model without being readily detectable by humans. By limiting the magnitude of these alterations, researchers aimed to simulate realistic adversarial attacks, focusing on the model’s ability to maintain accurate predictions even under conditions of carefully crafted noise. The assessment reveals how sensitive the model is to these subtle manipulations, providing insights into its inherent robustness and identifying potential vulnerabilities that could be exploited in real-world applications where data integrity cannot be guaranteed.
Investigations into adversarial robustness reveal a notable advantage for late fusion architectures when facing view-constrained attacks – scenarios where manipulation is limited to specific input channels. These architectures consistently exhibit improved resilience, maintaining predictive accuracy despite subtle, intentionally crafted distortions. However, joint attacks, which exploit vulnerabilities across all input views simultaneously, continue to pose a significant challenge. Notably, the Lite-CNN-Cons model, configured with a weighting of λ=1, demonstrated a particularly strong defense, achieving a positive Matthews Correlation Coefficient (MCC) even when subjected to perturbations of ϵ=2/255. This result underscores the model’s relative resilience and suggests a promising direction for developing more robust multi-view learning systems.
The pursuit of robustness in financial imaging, as detailed within, isn’t about achieving an unyielding fortress, but rather cultivating a system prepared for inevitable revelation. Monitoring, in this context, becomes the art of fearing consciously; each perturbation, even a minor one, signals potential systemic vulnerability. The paper demonstrates how easily multi-view techniques can be misled, a reminder that true resilience begins where certainty ends. As Grace Hopper observed, ‘It’s easier to ask forgiveness than it is to get permission.’ This resonates deeply; clinging to the illusion of perfect prediction is far more dangerous than acknowledging the inherent uncertainties and adapting to emergent realities. The leakage-resistant evaluation protocols aren’t just about measuring accuracy-they’re about embracing the chaotic nature of financial systems and building for graceful failure.
What Lies Ahead?
The pursuit of robustness in financial time-series analysis, as illuminated by this work, is not a matter of achieving a final, defensible architecture. It is, instead, the endless deferral of inevitable failure. Each layer of complexity, each view aligned and fused, merely alters the shape of the eventual collapse, not its certainty. The paper demonstrates the fragility of these systems – even minimal perturbations can unravel carefully constructed predictions. This is not a flaw; it is the inherent condition. Order is just cache between two outages.
Future work must abandon the notion of ‘best practices’ and embrace the understanding that there are only survivors. Evaluation protocols, especially, require a fundamental shift. Leakage-resistant approaches are not simply about eliminating statistical artifacts; they are about acknowledging the inherent unknowability of the future. The focus should not be on preventing attacks, but on designing systems that degrade gracefully, revealing their vulnerabilities rather than concealing them.
Ultimately, the field must move beyond the question of whether a system is robust, and instead ask how it fails. The true measure of progress will not be in achieving perfect predictions, but in building systems that offer increasingly informative post-mortems. Architecture is how one postpones chaos, not defeats it.
Original article: https://arxiv.org/pdf/2602.11020.pdf
Contact the author: https://www.linkedin.com/in/avetisyan/
See also:
- United Airlines can now kick passengers off flights and ban them for not using headphones
- Gold Rate Forecast
- How to Solve the Glenbright Manor Puzzle in Crimson Desert
- How to Complete Bloom of Tranquility Challenge in Infinity Nikki
- All Golden Ball Locations in Yakuza Kiwami 3 & Dark Ties
- How to Get to the Undercoast in Esoteric Ebb
- 8 Actors Who Could Play Blackbeard In One Piece Live-Action Season 3
- A Dark Scream Theory Rewrites the Only Movie to Break the 2-Killer Rule
- ‘Babylon 5’ Remains a Sci-Fi Classic That Completely Changed the Genre
- All MLB The Show 26 Quirks & What They Do
2026-02-12 22:46