Author: Denis Avetisyan
New research shows artificial intelligence models can accurately forecast daily hypoxia levels in coastal waters, offering critical insights for marine ecosystem management.
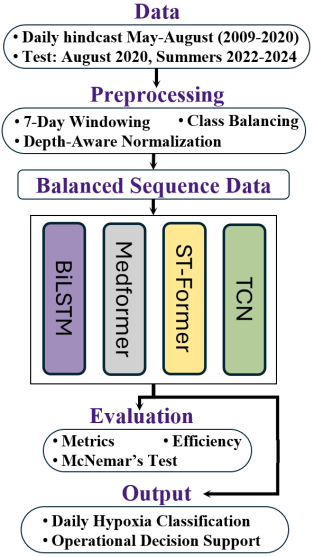
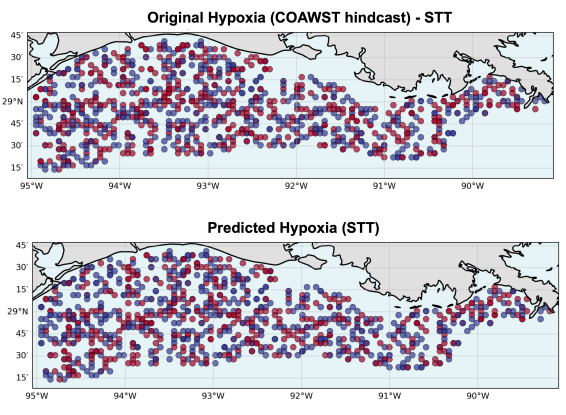
This study benchmarks deep learning architectures, including Spatio-Temporal Transformers, for improved daily forecasting of coastal hypoxia in the Gulf of Mexico using time-series and spatio-temporal modeling techniques.
Predicting daily coastal hypoxia remains a challenge due to the fine-scale temporal variability not captured by traditional seasonal models. This study, ‘Benchmarking Artificial Intelligence Models for Daily Coastal Hypoxia Forecasting’, comparatively evaluates four deep learning architectures-BiLSTM, Medformer, ST-Transformer, and TCN-for improved daily hypoxia classification in the Gulf of Mexico. Results demonstrate that a Spatio-Temporal Transformer achieved the highest performance across all metrics, offering a significant advancement in predictive accuracy. Could this reproducible framework, leveraging advanced AI, ultimately enhance ecosystem resilience and inform more responsive coastal management strategies?
The Inevitable Bloom: Forecasting the Collapse
The proliferation of harmful algal blooms, often fueled by excessive nutrient runoff from agricultural and urban sources, is increasingly responsible for the creation of widespread hypoxic, or low-oxygen, conditions in aquatic environments. These ‘dead zones’ pose a significant threat to marine ecosystems, disrupting food webs and causing mass mortality of fish and shellfish. Economically, hypoxia impacts fisheries, tourism, and the overall health of coastal communities, as reduced biodiversity and ecosystem services lead to substantial financial losses. The issue isn’t limited to coastal areas; even large lakes and inland waterways are susceptible, demonstrating the far-reaching consequences of nutrient pollution and its contribution to oxygen depletion.
Existing approaches to forecasting hypoxic events, commonly known as “dead zones,” frequently fall short of providing the precision and advance warning necessary for proactive intervention. Historically, these predictions have relied on simplified models that struggle to account for the intricate interplay of factors driving oxygen depletion – from fluctuating water temperatures and currents to the unpredictable bloom dynamics of algae and the rate of organic matter decomposition. Consequently, resource managers often receive alerts too late to implement effective mitigation strategies, such as adjusting nutrient runoff or temporarily relocating vulnerable marine life. This lack of predictive skill not only hinders conservation efforts but also poses significant economic risks to fisheries and coastal communities dependent on healthy marine ecosystems, highlighting the urgent need for more sophisticated and timely forecasting tools.
Predicting hypoxic events – commonly known as ‘dead zones’ – is extraordinarily complex, demanding a holistic understanding of interwoven environmental factors. These zones don’t simply appear due to a single cause; instead, they arise from the intricate interplay of physical circulation patterns which dictate water mixing and stratification, chemical processes like nutrient loading and oxygen consumption, and biological responses from phytoplankton blooms to the metabolic activity of marine organisms. Models attempting to forecast hypoxia must therefore integrate data on water temperature, salinity, currents, and nutrient levels with estimates of primary productivity, respiration rates, and decomposition – a challenging feat given the non-linear nature of these interactions and the spatial and temporal variability inherent in marine systems. Successfully capturing these multifaceted processes is crucial not only for improving the accuracy of predictions, but also for providing sufficient lead time to implement effective mitigation strategies and protect vulnerable ecosystems.
Deep Learning: Mapping the Inevitable
Deep learning methodologies provide an effective means of modeling hypoxia formation due to their capacity to represent complex, non-linear relationships inherent in the system. Traditional statistical methods often struggle to accurately capture interactions between variables influencing dissolved oxygen levels, such as temperature, salinity, nutrient loading, and organic matter decomposition. Deep neural networks, particularly recurrent neural networks (RNNs) and long short-term memory (LSTM) networks, can ingest multi-dimensional datasets incorporating these factors and learn the intricate dependencies driving oxygen depletion. This allows for improved prediction of hypoxic events compared to linear or simpler non-linear models, as these networks can identify and model subtle interactions that would otherwise be missed. The ability to handle large datasets and automatically extract relevant features further enhances the predictive power of deep learning approaches in this context.
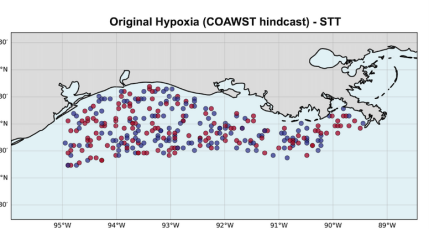
The Coastal Ocean Atmosphere Wave Sediment Transport (COAWST) system is a fully coupled modeling framework designed to simulate complex coastal environments. It integrates the Regional Ocean Modeling System (ROMS) for ocean circulation and hydrodynamics, the Weather Research and Forecasting (WRF) model for atmospheric forcing, and the Sediment Transport Model (STM) to simulate bedload and suspended sediment dynamics. This integration allows for a comprehensive representation of physical processes influencing hypoxia formation, including water column stratification, nutrient delivery from atmospheric deposition and river runoff, and sediment-driven oxygen consumption. By coupling these models, COAWST provides a robust foundation for simulating the complex interplay of factors contributing to oxygen depletion in coastal ecosystems, enabling more accurate and detailed hypoxia predictions.
The development of accurate hypoxia forecasting models relies on the synergistic combination of historical time-series data and outputs from the COAWST modeling system. Historical data, encompassing dissolved oxygen measurements, temperature, salinity, and nutrient levels, provides crucial context and validation datasets. When coupled with high-resolution hydrodynamic and biogeochemical simulations from COAWST – which model physical circulation, sediment transport, and biological processes – these datasets facilitate the training of machine learning algorithms. Specifically, time-series analysis techniques, such as recurrent neural networks and long short-term memory networks, can identify complex temporal patterns and non-linear relationships between environmental variables and hypoxia formation, leading to improved predictive capabilities and the ability to forecast the onset, duration, and spatial extent of hypoxic events.
The integration of the North Pacific Ecosystem Model for Understanding Regional Oceanography (NEMURO) into hypoxia modeling frameworks enhances the simulation of oxygen dynamics by explicitly representing nutrient cycling and phytoplankton activity. NEMURO simulates the complex interactions between nitrogen, phosphorus, silicon, and various planktonic groups, thereby providing a more realistic estimate of primary production and organic matter decomposition rates. These rates directly influence oxygen consumption through respiration and remineralization processes. By coupling NEMURO with hydrodynamic models like COAWST, researchers can move beyond simplified oxygen budget calculations and accurately represent the biological drivers of hypoxia formation, leading to improved predictive capabilities for coastal ecosystems.
Spatiotemporal Echoes: Architectures for Prediction
Bidirectional Long Short-Term Memory (BiLSTM) networks and Temporal Convolutional Networks (TCNs) have proven effective in modeling temporal dependencies inherent in oceanographic data. BiLSTMs process sequential data in both forward and reverse directions, enabling them to capture past and future contextual information relevant to hypoxia development. TCNs utilize causal and dilated convolutions to efficiently process long sequences, mitigating the vanishing gradient problem common in recurrent networks. Both architectures excel at identifying patterns in time series data, such as seasonal variations in temperature, salinity, and dissolved oxygen, which are critical indicators for predicting hypoxic events. Their ability to learn and represent these temporal relationships contributes to improved forecasting accuracy compared to traditional statistical methods.
The ST-Transformer and Medformer architectures address spatiotemporal forecasting by integrating attention mechanisms to capture dependencies across both spatial locations and temporal steps. Unlike recurrent or convolutional networks which process these dimensions sequentially, these transformer-based models allow for parallel processing of the entire spatiotemporal input. The ST-Transformer utilizes a self-attention mechanism to weigh the importance of different spatial locations at each time step, and vice versa, facilitating the identification of complex interactions. Medformer extends this approach with a multi-scale attention mechanism, enabling the capture of relationships at varying spatial and temporal resolutions. This capability is particularly valuable in oceanographic modeling where hypoxia formation is influenced by factors operating across multiple scales, from localized stratification to large-scale current systems.
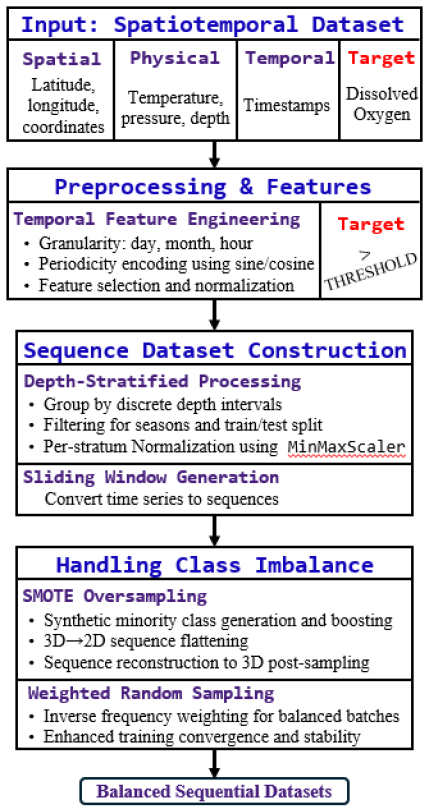
The prediction of hypoxic events relies heavily on the analysis of multivariate time series data, encompassing variables such as dissolved oxygen, temperature, salinity, and nutrient levels collected across spatial locations and sequential time steps. Advanced architectures like BiLSTMs, TCNs, ST-Transformers, and Medformers facilitate efficient processing of this data by enabling the simultaneous consideration of temporal dependencies and spatial correlations. Traditional methods often struggle with the high dimensionality and complex interactions inherent in oceanographic datasets; these architectures address these limitations through mechanisms like attention and dilated convolutions, allowing for the extraction of relevant features and the construction of accurate predictive models. The ability to process multivariate data efficiently is paramount, as hypoxia is rarely driven by a single factor but rather by the confluence of multiple interacting environmental conditions.
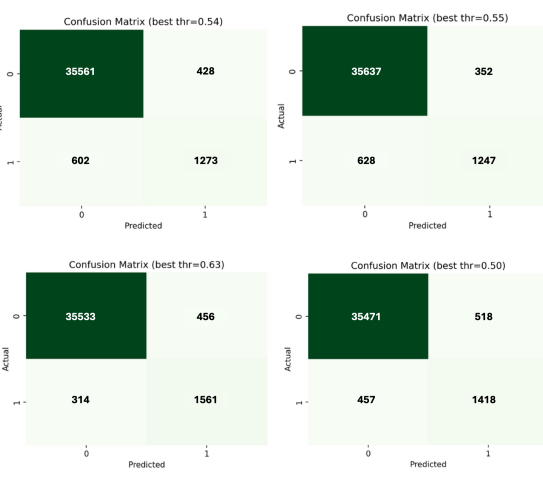
Comparative analysis of BiLSTM, TCN, ST-Transformer, and Medformer models indicates varying capabilities in representing the processes driving hypoxia formation. While all models demonstrated predictive ability, the ST-Transformer consistently outperformed others, achieving Area Under the Receiver Operating Characteristic curve (AUC-ROC) values between 0.982 and 0.992 when evaluated on independent test datasets from 2020, 2022, 2023, and 2024. This suggests superior performance in capturing the complex spatiotemporal interactions critical to accurate hypoxia prediction, although specific strengths and weaknesses related to individual hypoxia-inducing mechanisms require further investigation to fully characterize the differences between the models.
Beyond Prediction: Robustness and the Weight of Evidence
The accurate prediction of rare but critical events, such as hypoxia, is often hampered by class imbalance – where the instances of the rare event are significantly outnumbered by normal conditions. To counteract this, techniques like Weighted Random Sampling and Synthetic Minority Oversampling Technique (SMOTE) are proving valuable. Weighted Random Sampling adjusts the probability of selecting instances during model training, giving greater weight to the minority class and ensuring it isn’t overshadowed. SMOTE, conversely, creates synthetic examples of the minority class based on existing ones, effectively augmenting the dataset and providing the model with more representative data. By employing these strategies, researchers are demonstrably improving the ability of forecasting models to identify and predict these infrequent, yet potentially dangerous, hypoxia events, moving beyond simple accuracy metrics to focus on the reliable detection of critical conditions.
A thorough evaluation of predictive model performance demands more than simple accuracy scores; instead, a suite of metrics provides a nuanced understanding of strengths and weaknesses. Area Under the Receiver Operating Characteristic curve (AUC-ROC) assesses a model’s ability to distinguish between classes, while Area Under the Precision-Recall curve (AUC-PR) focuses on positive predictive value, particularly crucial when dealing with imbalanced datasets. However, these are complemented by the Brier Score, which measures the calibration of probabilistic predictions – how well predicted probabilities align with observed frequencies – and Log Loss, a stricter metric penalizing confident but incorrect predictions. Utilizing these complementary measures allows for a comprehensive appraisal, revealing not just if a model predicts accurately, but how well its probabilities reflect true uncertainty and providing a more robust basis for model selection and refinement.
Rigorous statistical comparison of forecasting models is crucial for determining the most effective approach, and McNemar’s Test provides a powerful method for achieving this. This test focuses on identifying where models disagree in their predictions, revealing statistically significant differences beyond overall accuracy. Analyses utilizing McNemar’s Test demonstrated substantial performance distinctions between models; for instance, pairwise comparisons between the ST-Transformer and the TCN consistently yielded p-values less than 0.001. These highly significant results indicate that the observed differences in predictive capability were unlikely due to random chance, bolstering confidence in the ST-Transformer’s superior forecasting ability and highlighting the value of statistically-driven model selection.
Advancements in forecasting accuracy directly empower more effective management of critical systems, particularly when anticipating rare but impactful events. Recent studies demonstrate the ST-Transformer model achieves a substantial improvement in predictive capability, exhibiting a large effect size – Cohen’s w ranging from 1.5288 to 1.5922 between 2022 and 2024 – when contrasted with the BiLSTM model. This considerable effect suggests the ST-Transformer not only predicts with greater accuracy, but that this improvement is meaningful and unlikely due to chance. Consequently, organizations can leverage these enhanced predictions to implement proactive mitigation strategies, optimize resource allocation, and make more informed decisions, ultimately leading to improved outcomes and reduced risk.
The pursuit of predictive accuracy in coastal hypoxia forecasting, as detailed in this study, echoes a fundamental truth about complex systems. One might observe, as John von Neumann did, “In the past, we thought that if we had enough computers, we could solve any problem. Now we realize that the problem is not solving it, but in choosing the right problem.” This paper doesn’t merely present a solution – a Spatio-Temporal Transformer model achieving improved accuracy – but implicitly acknowledges the iterative nature of problem selection. Each refinement of the forecasting model is a prophecy of future failure, demanding continuous adaptation as environmental conditions shift and data patterns evolve. The model isn’t static; it’s a growing ecosystem, mirroring the very coastal environment it attempts to predict.
What Lies Ahead?
The pursuit of daily hypoxia forecasting, as evidenced by this work, is not a march toward prediction, but the cultivation of a responsive system. Improved accuracy in modeling – even with architectures as nuanced as Spatio-Temporal Transformers – merely reveals the limitations of the questions asked. A perfect forecast is a static thing, blind to the inevitable shifts in forcing functions, the emergent behaviors of the ecosystem itself. The model, in its success, begins to define the boundaries of its own failure.
Future effort will inevitably focus on incorporating higher-resolution data, more complex physical and biological models, and perhaps even attempts at causal inference. These are, however, incremental adjustments. The true challenge lies not in building a more complete representation of the Gulf of Mexico, but in accepting the inherent incompleteness. A system that never breaks is, after all, a dead system – incapable of adaptation, of learning from the very events it attempts to foresee.
The value of this work, then, resides not in its predictive power, but in its capacity to generate controlled failures. Each missed forecast is a data point, a refinement of the boundaries within which the system operates. It is a slow, iterative process, less akin to engineering and more to gardening – tending a complex, evolving ecosystem, recognizing that control is an illusion, and resilience the only true measure of success.
Original article: https://arxiv.org/pdf/2602.05178.pdf
Contact the author: https://www.linkedin.com/in/avetisyan/
See also:
- United Airlines can now kick passengers off flights and ban them for not using headphones
- Crimson Desert: Disconnected Truth Puzzle Guide
- The Boys Season 5 Spoilers: Every Major Character Death If the Show Follows the Comics
- All 9 Coalition Heroes In Invincible Season 4 & Their Powers
- Mewgenics vinyl limited editions now available to pre-order
- Invincible Season 4 Episode 6 Release Date, Time, Where to Watch
- Grok’s ‘Ask’ feature no longer free as X moves it behind paywall
- Assassin’s Creed Shadows will get upgraded PSSR support on PS5 Pro with Title Update 1.1.9 launching April 7
- Grey’s Anatomy Season 23 Confirmed for 2026-2027 Broadcast Season
- Nintendo Officially Rewrites Princess Peach After 41 Years
2026-02-07 18:15