I’ve been tracking Midnight (NIGHT), and it’s currently trading at $0.0455, which represents a 1.52% increase for the day. We saw a dip earlier this week to $0.043, but it’s recovered nicely. I’m particularly interested in the recent partnership between Monument Bank and the Midnight Foundation, as this represents a major step forward in terms of institutional adoption for the project.
This partnership is happening at a potentially risky time. The stock chart currently shows a pattern called an inverted cup and handle, which often indicates a likely price decrease after a short-term rise.
Monument Bank Partnership Expands Network Reach — But Market Timing Is Delicate
Monument, a financial institution supervised by the Bank of England and holding around £7 billion ($9 billion) for 100,000 customers, is planning to move everyday savings onto blockchain technology in three steps. First, they’ll start with up to £250 million in digital versions of deposits. Next, they’ll offer investment products like private equity and commodity funds as tokens. Finally, they’ll allow customers to borrow money using these digital holdings as collateral.
Charles Hoskinson, the founder of Cardano ($ADA), recently announced a major partnership for Midnight. He stated it’s the biggest deal Cardano has made so far and has the potential to bring hundreds of millions, or even billions, of dollars worth of value to the Midnight platform.
— The Wolf Of All Streets (@scottmelker) March 26, 2026
Charles Hoskinson highlighted a major new agreement for Midnight, predicting it could attract hundreds of millions, or even billions, of dollars worth of assets to the platform. This deal significantly supports the long-term potential of the NIGHT token.
Even if the underlying reasons for a price increase are strong, the current market conditions might not cause an immediate jump. The way prices are moving suggests a quick rise is more likely to be followed by a fall, rather than a lasting increase.
Sentiment Spike Suggests Optimism
Santiment’s analysis of NIGHT’s sentiment between February 26th and March 25th shows it was largely negative for most of the period. During the biggest price drops in late February and early March, sentiment consistently stayed between -0.628 and -0.893.
On March 25th, positive feelings about the market jumped dramatically to a peak of 4.502 – the highest point shown in the data. This jump happened right after Monument Bank made its announcement. Although positive news usually leads to increased optimism, historically, unusually large spikes like this have often been followed by price drops, not continued growth.
Interested in more crypto analysis? Subscribe to Editor Harsh Notariya’s daily newsletter here.
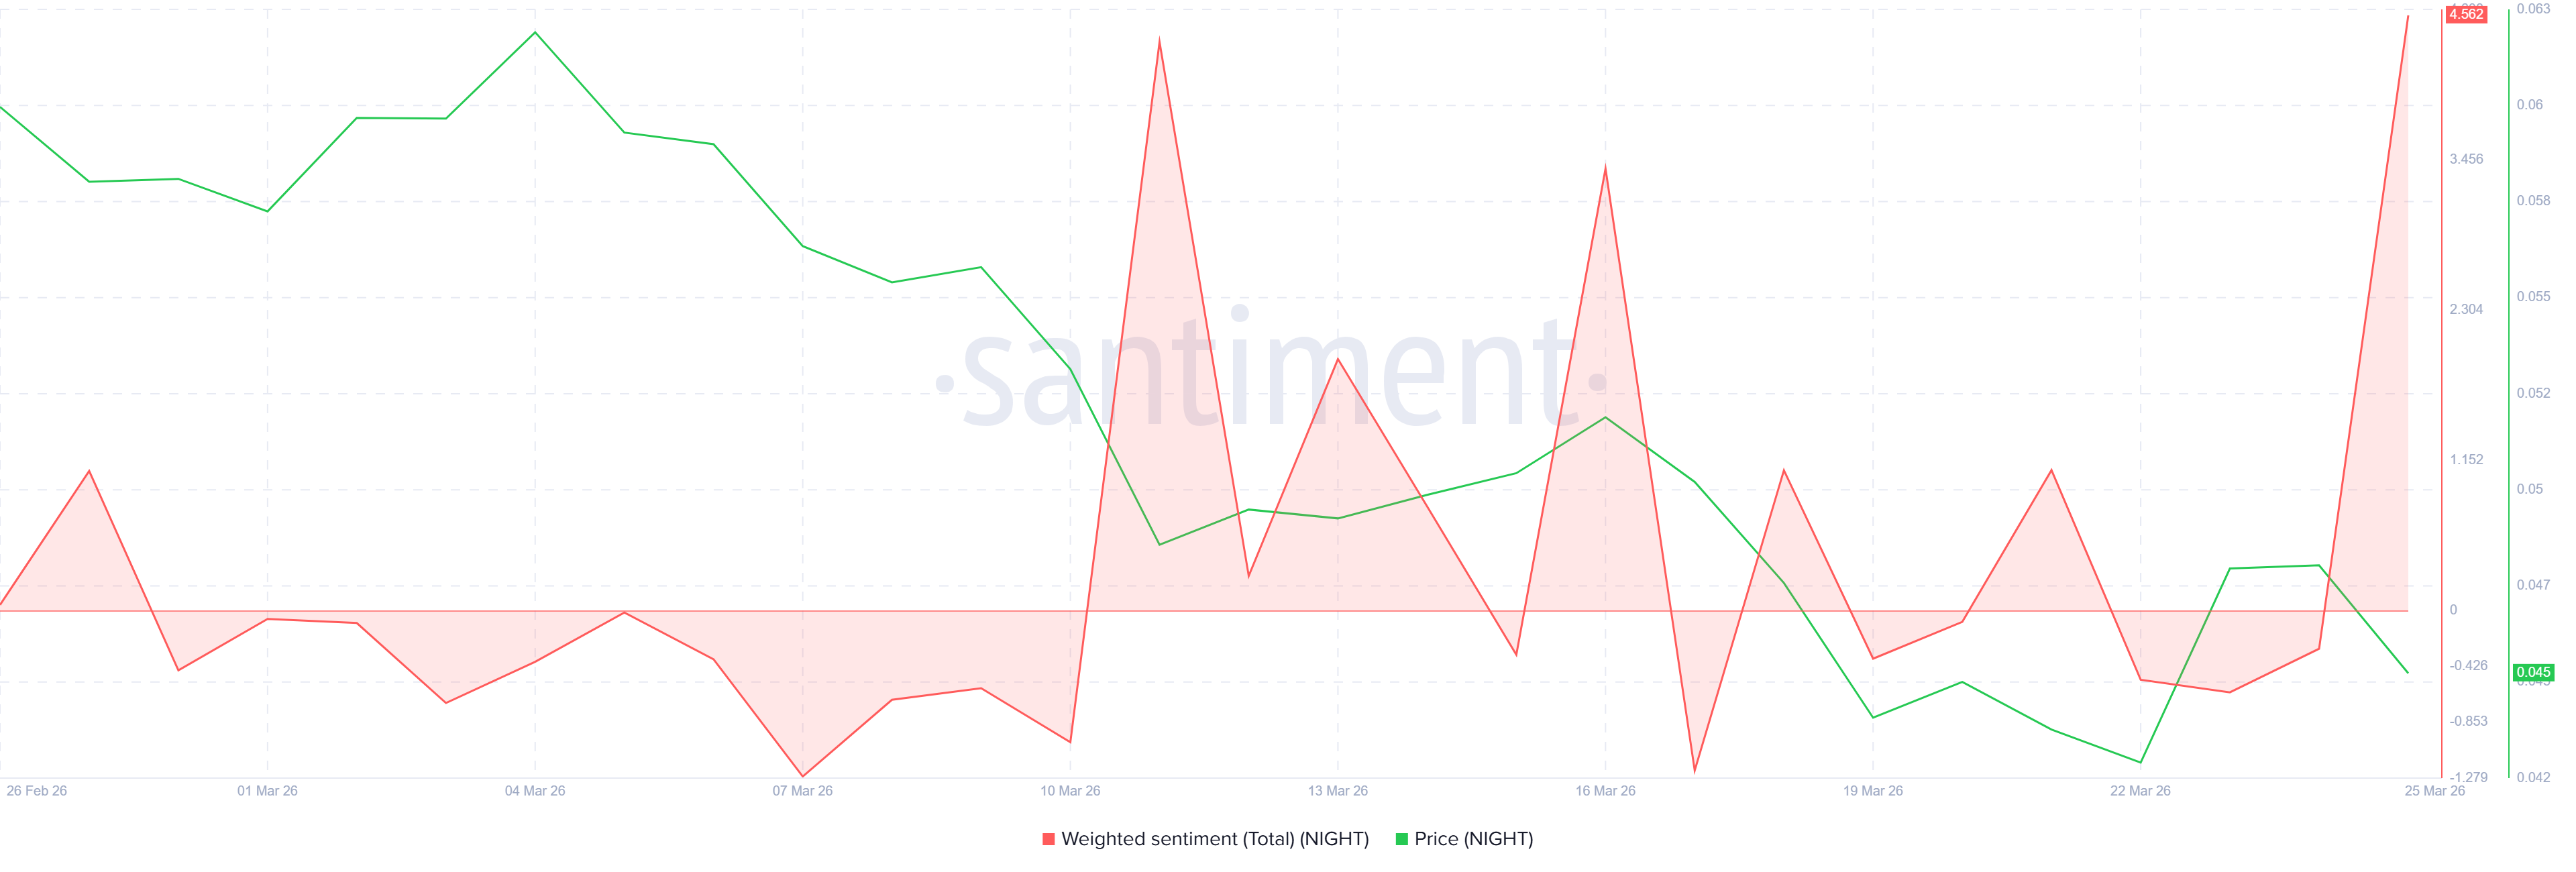
Looking at the chart, NIGHT was priced at $0.045 on March 25th, which is significantly lower than its peak around $0.083 in mid-February. Currently, there’s a lot of positive feeling about NIGHT that isn’t reflected in its price – a common situation that usually means enthusiasm will decrease before the price goes up.
NIGHT Price Might Be Looking At Correction
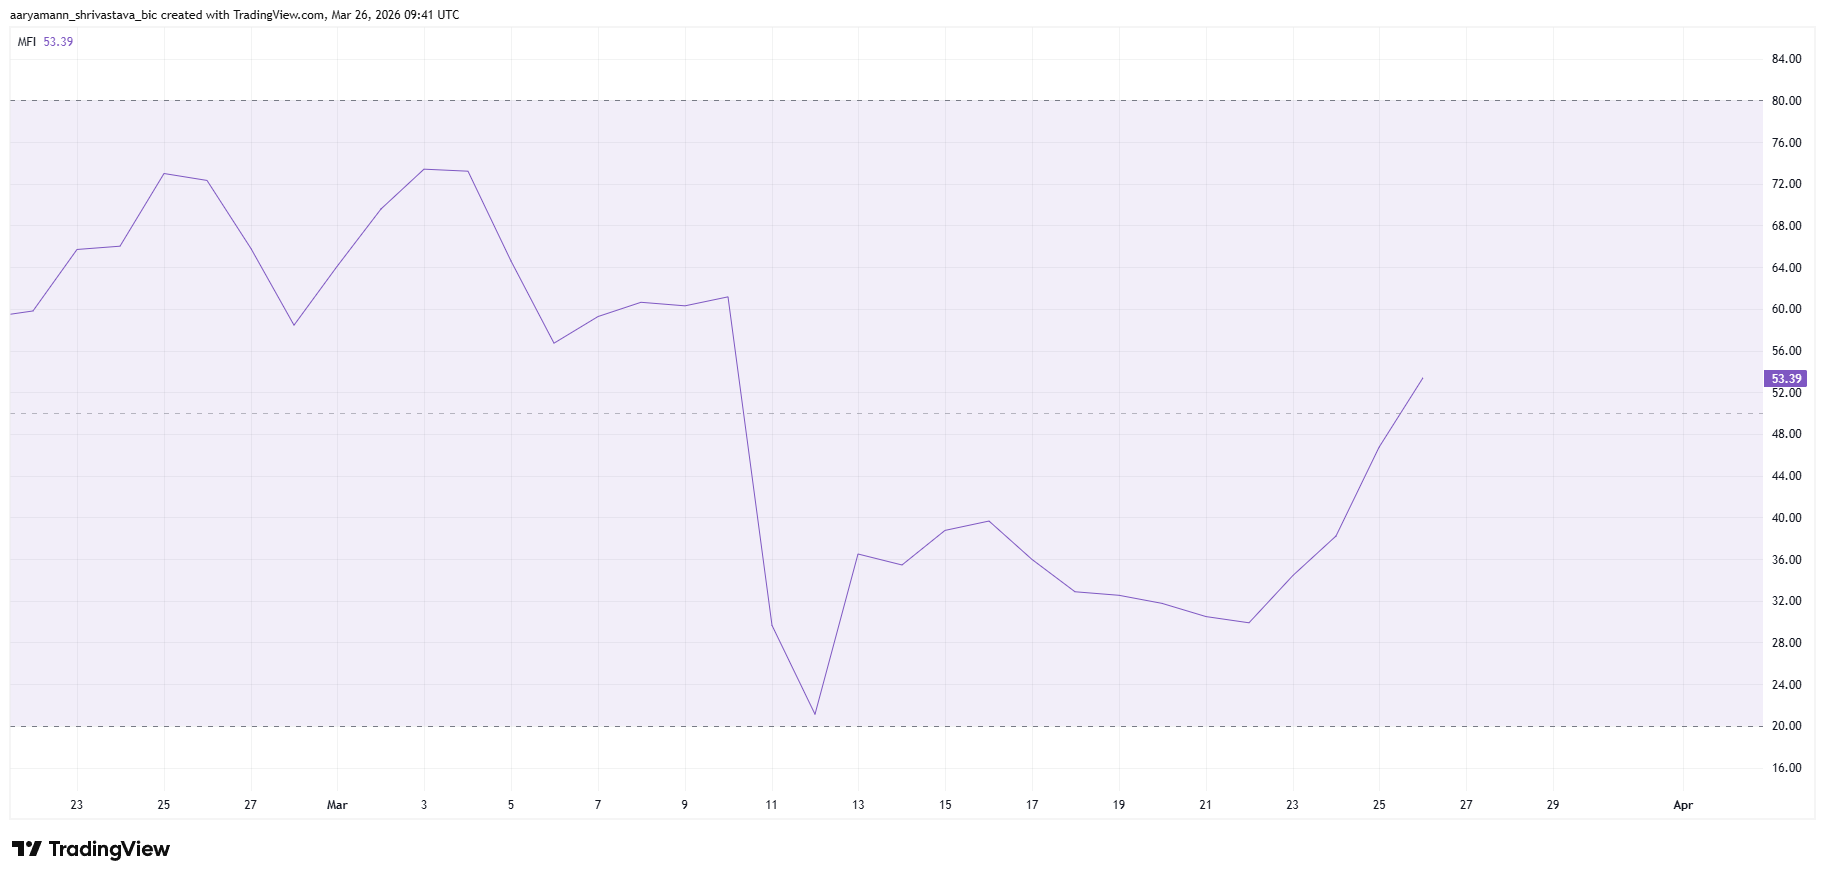
As of March 26th, the Money Flow Index (MFI) is at 53.39. After a sharp drop from over 72 in late February to around 24 in mid-March, the MFI has been consistently increasing over the last two weeks. This neutral, but rising, reading suggests a potential short-term price increase, fitting with the expected upward movement within an inverted cup and handle pattern.
Between February 10th and March 10th, the price action created a pattern resembling an inverted cup, with its peak around $0.056 to $0.062. The price then dropped quickly and is now forming a small, upward-sloping handle. This handle usually rises slightly before the price breaks down through a key support level.
As I’m looking at the chart, the pattern’s neckline lines up almost perfectly with the Fibonacci zero level, both hitting around $0.041 – that’s the red line at the bottom. If the price closes below that level on a daily basis, it would confirm a downward break and suggest a significant price drop is likely.
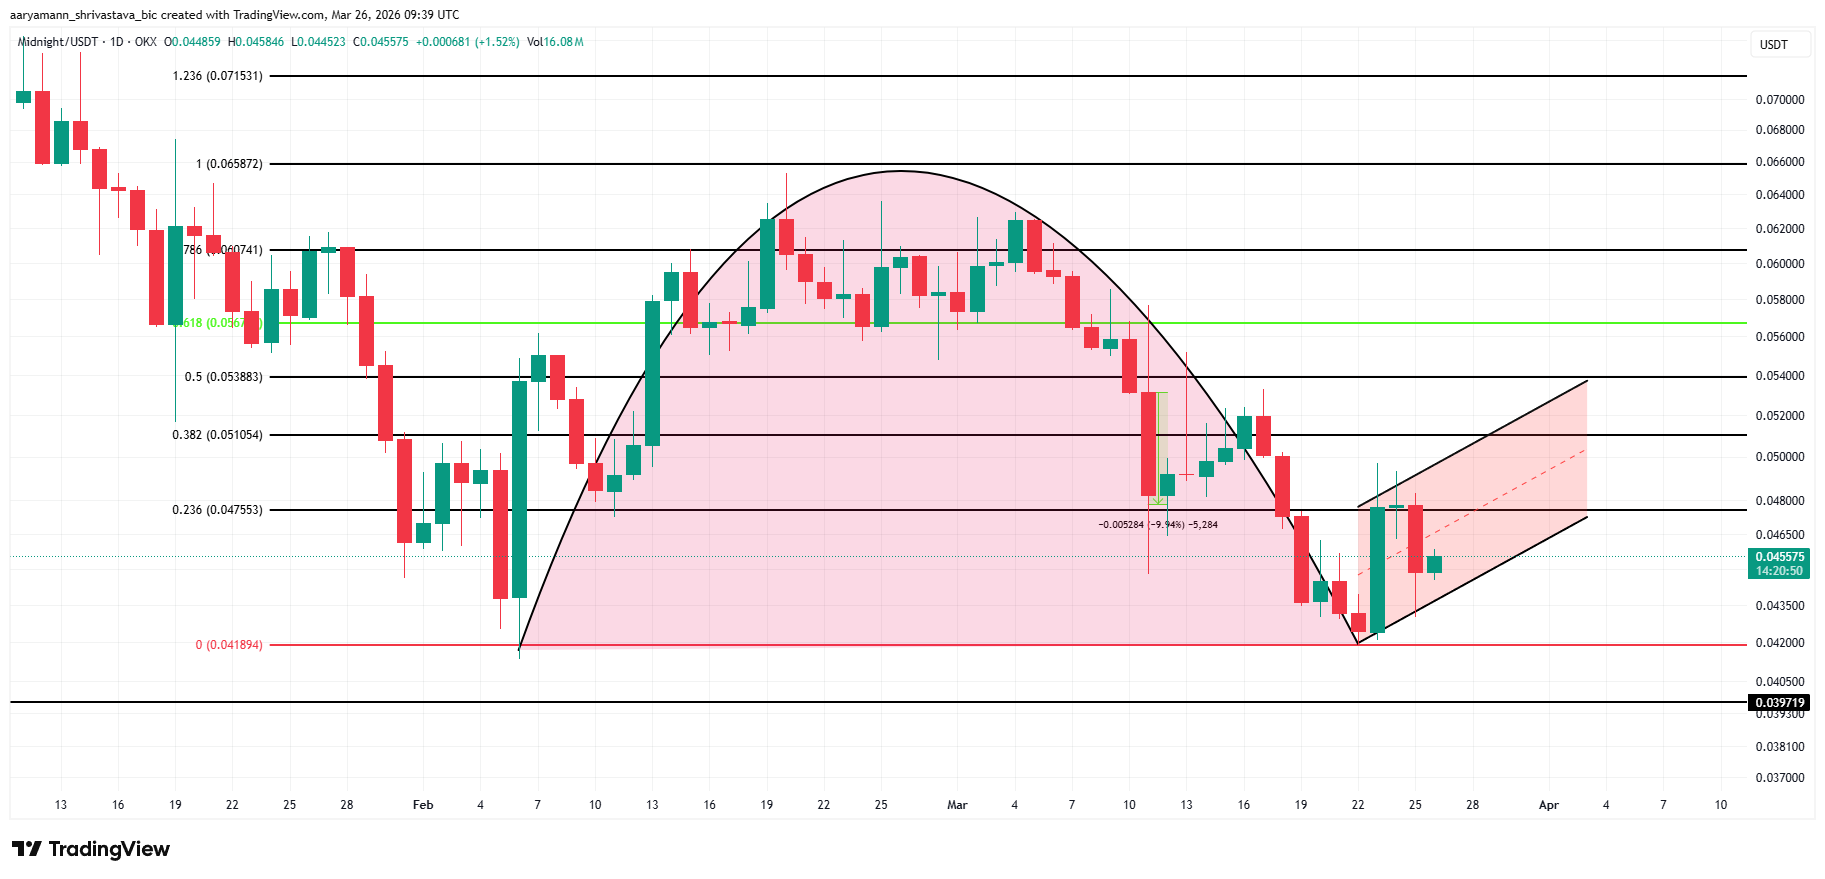
If the price closes above $0.056 on a daily chart – marked by the green line – it would invalidate the current bearish pattern and suggest a potential rise to $0.060, and possibly even $0.065.
Read More
- United Airlines can now kick passengers off flights and ban them for not using headphones
- How to Complete Bloom of Tranquility Challenge in Infinity Nikki
- Gold Rate Forecast
- How to Solve the Glenbright Manor Puzzle in Crimson Desert
- 8 Actors Who Could Play Blackbeard In One Piece Live-Action Season 3
- All Itzaland Animal Locations in Infinity Nikki
- All Golden Ball Locations in Yakuza Kiwami 3 & Dark Ties
- A Dark Scream Theory Rewrites the Only Movie to Break the 2-Killer Rule
- DC Comics’ Absolute Two-Face and Absolute Penguin Confirmed
- All 10 Potential New Avengers Leaders in Doomsday, Ranked by Their Power
2026-03-26 18:58