Author: Denis Avetisyan
New research leverages artificial intelligence and social media data to pinpoint the geographic connections between climate vulnerability and well-being across the United States.
Generative AI and structural equation modeling are used to analyze spatial heterogeneity in the relationship between climate risk and multidimensional human flourishing at the U.S. county level.
Despite growing recognition of climate change impacts, quantifying the nuanced relationship between environmental risk and human well-being remains a significant challenge. This is addressed in ‘Spatial Heterogeneity in Climate Risk and Human Flourishing: An Exploration with Generative AI’, which develops a novel spatial framework integrating high-resolution climate hazard data with a geographically-indexed measure of human flourishing derived from 2.6 billion geotagged tweets analyzed using Large Language Models. The study reveals spatially heterogeneous associations between cumulative climate risk and diminished human flourishing across U.S. counties, highlighting distinct patterns linked to specific hazards. Can these findings inform more targeted and holistic adaptation strategies that prioritize both environmental resilience and human well-being?
Whispers of Convergence: Beyond Isolated Hazards
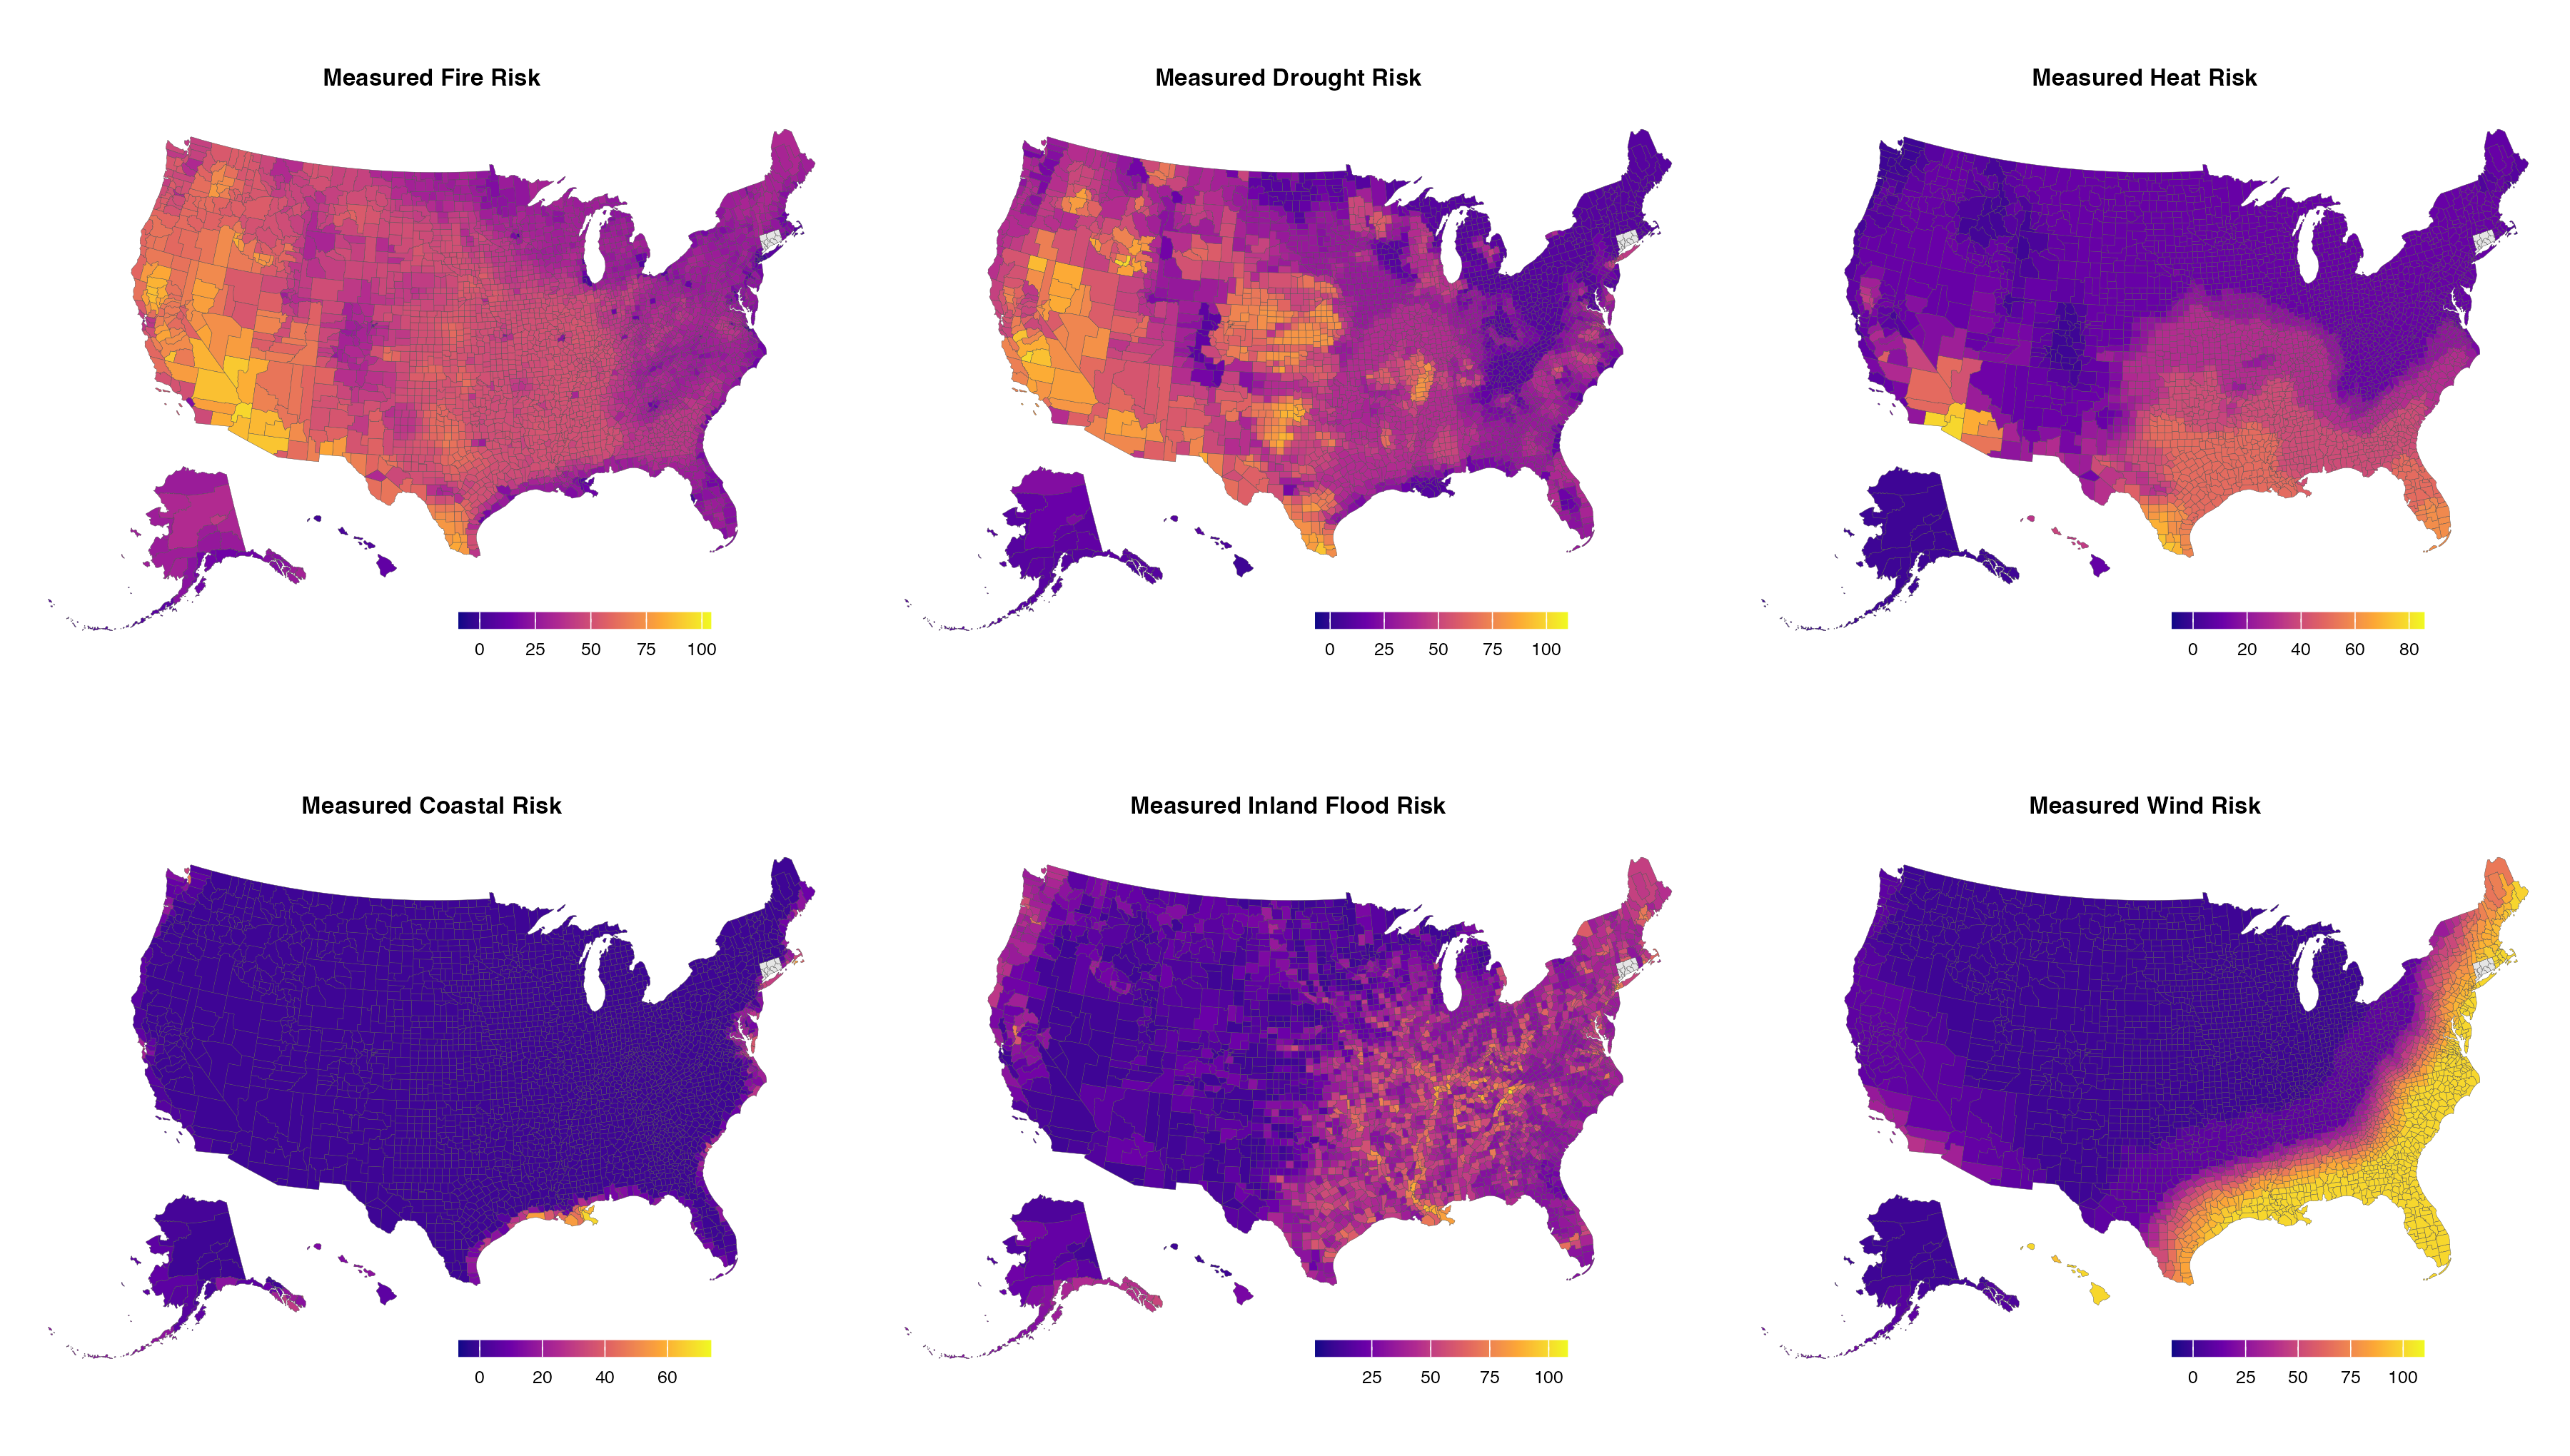
Historically, evaluations of climate risk have largely proceeded by assessing threats in isolation – a flood here, a heatwave there – neglecting the crucial reality that these events rarely occur in a vacuum. This fragmented approach overlooks the potential for compounding impacts, where the simultaneous or sequential occurrence of multiple hazards amplifies overall risk far beyond what single-hazard assessments predict. For instance, a region experiencing prolonged drought may become exceptionally vulnerable to wildfire, or a heatwave combined with high humidity can create dangerously high heat indices, exceeding thresholds for human health. Consequently, traditional risk models often underestimate the true extent of climate vulnerability, failing to account for complex interactions and cascading failures that emerge when multiple stressors converge on a single community or ecosystem.
Communities globally are no longer facing climate risks as isolated incidents; instead, they increasingly experience multi-hazard exposure, a convergence of events that dramatically amplifies overall impact. This phenomenon moves beyond simply adding the probabilities of individual hazards like flooding or drought; the combined effect creates a synergistic risk where one event exacerbates the consequences of another. For example, prolonged drought can heighten wildfire risk, while subsequent heavy rainfall on burn scars increases the likelihood of devastating landslides and flooding. This compounding effect significantly diminishes a community’s capacity to respond and recover, leading to far greater social, economic, and ecological consequences than would be predicted by assessing each hazard in isolation. Understanding this interconnectedness is crucial for developing effective adaptation strategies and building true climate resilience.
Climate risk assessment is evolving beyond isolated hazard analysis to recognize the critical interplay of concurrent events. Recent research highlights that simply adding the probabilities of individual threats – such as heat waves, wildfires, flooding, and drought – significantly underestimates the true level of danger faced by communities. This study demonstrates a statistically significant association between the cumulative exposure to these climate hazards and measurable declines in human well-being, encompassing economic stability, public health, and social cohesion. The findings emphasize that the combined effect of these stressors is not merely additive; rather, the synergistic impacts create a cascading series of vulnerabilities that demand a more integrated and holistic approach to risk management and resilience planning.
Digital Echoes: Mapping Experience Through Trace Data
Digital trace data, in the form of geo-located social media posts, is utilized to assess public perceptions of climate-related impacts as they occur. This methodology captures immediate, self-reported experiences regarding hazards such as flooding, extreme temperatures, and air quality events. By analyzing the geographic coordinates associated with these posts – specifically tweets – researchers can map the spatial distribution of perceived impacts and identify areas where communities report heightened vulnerability. This approach offers a complementary data source to traditional reporting mechanisms, which may have limitations in timeliness or granularity, and provides insights into the subjective experience of climate change.
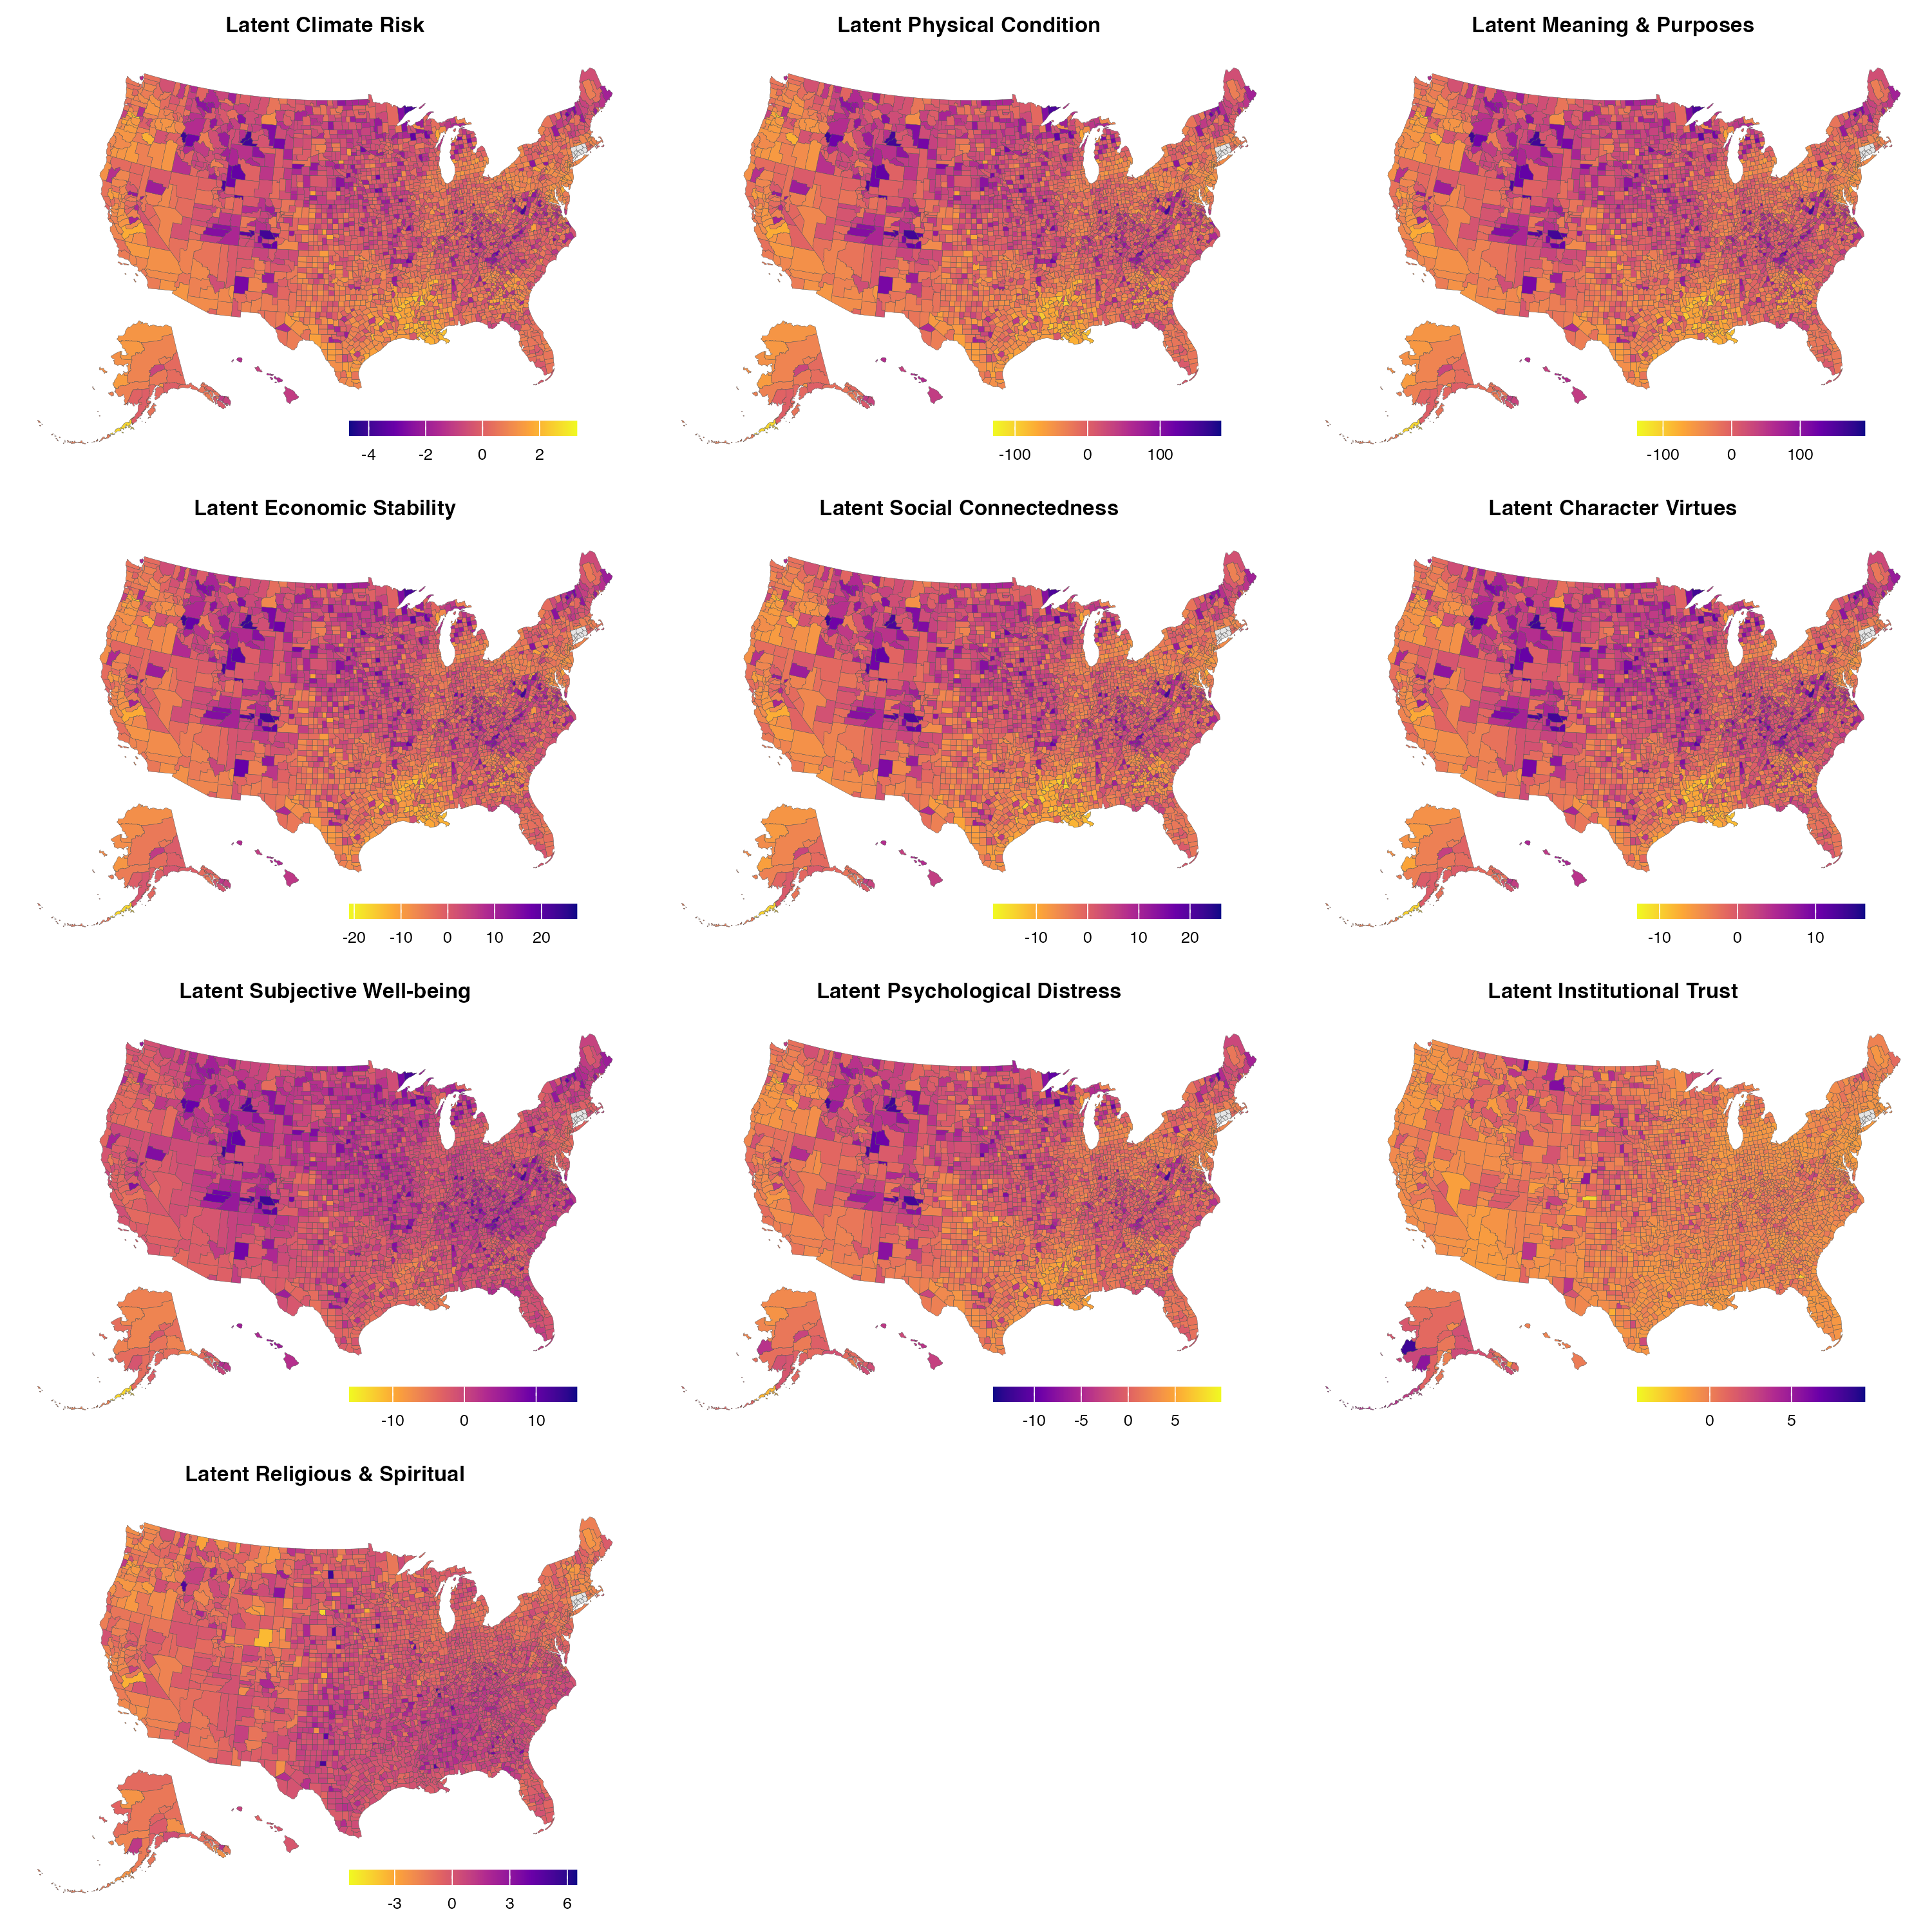
The Human Flourishing Geographic Index (HFGI) is constructed utilizing a dataset of 2.6 billion geo-located tweets, providing a geographically granular understanding of community experiences with hazards. This approach moves beyond traditional data sources by capturing real-time, localized perceptions directly from social media users. Each geo-tweet is associated with a specific location, enabling the aggregation of sentiment and topic analysis at a highly localized level. The resulting index complements official reporting by identifying areas where reported hazards intersect with expressed human needs and concerns, offering a more nuanced picture of vulnerability and resilience than aggregate statistics alone.
Traditional statistical analysis often relies on aggregated data, which can obscure significant variations in impact and vulnerability at the local level. By analyzing granular, geographically-referenced data – such as geo-located social media posts – it becomes possible to identify specific communities disproportionately affected by hazards or lacking access to resources. This localized understanding facilitates the development of targeted interventions, allowing for the efficient allocation of aid and the implementation of tailored resilience-building strategies. The ability to pinpoint vulnerabilities beyond broad statistical trends improves the effectiveness of disaster response and long-term planning efforts, moving beyond generalized approaches to address specific community needs.
The Language of Hazard: LLMs as Sentinels
Generative AI, utilizing Large Language Models (LLMs), is employed to process geolocated social media posts – specifically geo-tweets – and automatically identify and quantify hazard indicators. This process involves analyzing textual content to extract information pertaining to potentially damaging events or conditions, such as floods, landslides, or outbreaks of disease. By automatically assessing these reports and linking them to specific geographic locations, the system generates indicators representing the presence, intensity, and frequency of hazards, enabling scalable monitoring of risk across large areas.
The hazard indicator derivation process centers on Llama 3.2, a Large Language Model that has undergone fine-tuning for this specific application. This LLM is utilized to process geo-located Twitter data (geo-tweets) and identify mentions of potential hazards. Extraction focuses on both geographic information – identifying locations referenced in the tweets – and hazard characteristics. The intensity of a reported hazard is quantified based on linguistic cues within the text, while frequency is determined by counting the number of relevant tweets within a defined time period and geographic area. This automated extraction allows for the creation of quantifiable hazard indicators derived directly from user-reported information.
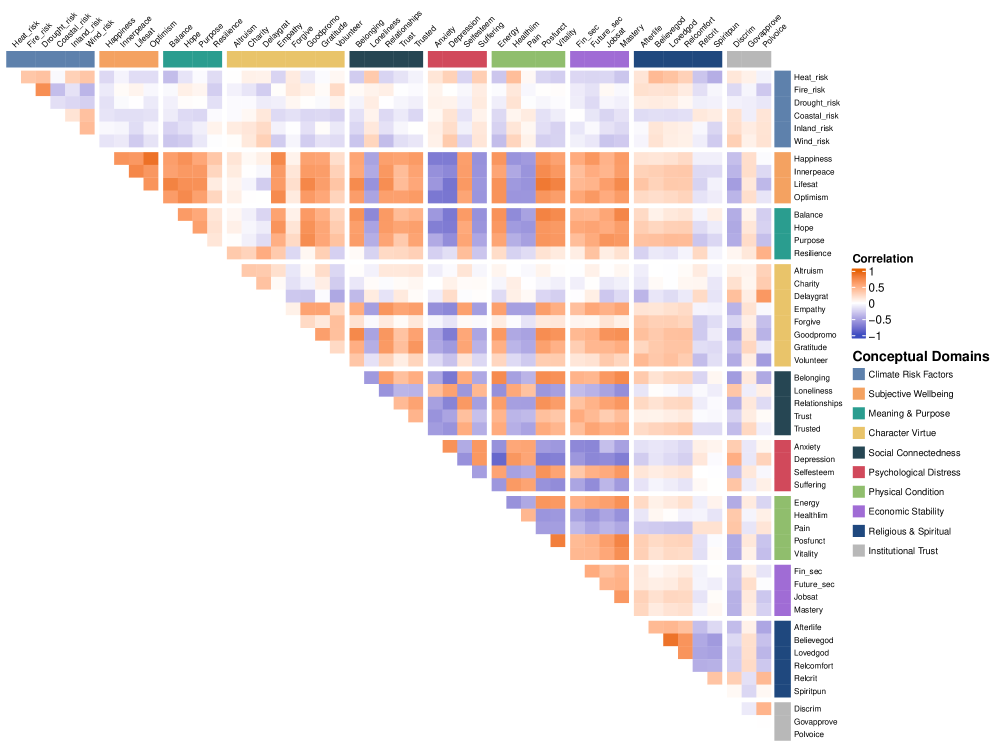
The automated hazard indicator generation process, leveraging generative AI and LLMs, demonstrates significant scalability for monitoring risk across large geographic regions with minimal latency. This efficiency is achieved through the automated analysis of geo-located social media data, enabling near real-time hazard assessment. Statistical analysis reveals a strong correlation between the derived hazard indicators and established measures of human flourishing, specifically subjective well-being. Factor loadings consistently range from 0.82 to 0.85, indicating a substantial shared variance and validating the utility of these indicators as proxies for population welfare.
Weaving the Threads: A Holistic View of Vulnerability
A refined understanding of climate risk emerges from the synthesis of large language model (LLM)-derived hazard indicators with established climate datasets. Traditionally, climate risk assessment relied heavily on physically-modeled data, often lacking the nuance to capture localized or rapidly evolving threats. The integration of LLM insights, extracted from sources like news reports and social media, provides a complementary layer of information, revealing hazards that might otherwise go unnoticed. This combined approach doesn’t simply add data points; it creates a more holistic picture, identifying complex interactions between climate stressors and societal vulnerabilities. Consequently, risk profiles become more precise, allowing for targeted interventions and a more effective allocation of resources towards building climate resilience.
An integrated assessment of climate risk reveals strong connections to human well-being, allowing for targeted support of vulnerable populations. Statistical analysis, utilizing path coefficients, demonstrates a significant association – ranging from -0.99 to 0.93 – between climate risk and multiple facets of human flourishing, encompassing areas like health, security, and economic stability. This robust correlation enables a prioritization of adaptation strategies, directing resources to interventions that demonstrably improve resilience for those most susceptible to climate impacts and fostering a more equitable approach to climate action. The ability to pinpoint these connections facilitates proactive measures, shifting the focus from reactive disaster relief to preventative support and long-term community empowerment.
Detailed monitoring of multi-hazard exposure, achieved through advanced data analysis, fundamentally shifts climate adaptation from broad strategies to targeted interventions. This granular approach moves beyond simply identifying regions at risk to pinpointing specific vulnerabilities within communities – factoring in localized conditions and exposure to overlapping hazards like flooding, drought, and extreme heat. Consequently, communities are empowered to proactively build resilience by prioritizing resources for the most pressing threats and implementing tailored mitigation measures, such as reinforcing critical infrastructure or developing early warning systems. This level of precision not only maximizes the effectiveness of adaptation efforts but also fosters a sense of ownership and agency within communities, allowing them to actively participate in safeguarding their future against the escalating impacts of climate change.
The study’s mapping of climate risk and human flourishing across U.S. counties feels less like statistical validation and more like an elaborate act of persuasion. It’s a spell woven from digital trace data, attempting to coax order from inherent chaos. This pursuit echoes the sentiment of Richard Feynman, who once said, “The first principle is that you must not fool yourself – and you are the easiest person to fool.” The models presented don’t reveal truth, they construct a narrative, carefully calibrated to minimize the dissonance between observation and expectation. Each correlation, however strong, remains provisional, a temporary truce in the ongoing war against entropy, and the inherent fragility of any attempt to predict complex systems.
What Lies Beyond the Map?
The exercise, naturally, has not tamed the chaos. This mapping of climate risk to the nebulous construct of ‘human flourishing’-gleaned from the digital effluvia of geo-located signals-reveals less a predictive power than a complex topography of correlated anxieties. The ingredients of destiny, while illuminated, remain stubbornly resistant to precise dosage. The model does not learn; it simply ceases to listen to certain dissonances within the data stream. Future iterations will undoubtedly refine the rituals-the hyperparameters-but a fundamental uncertainty persists: are these patterns emergent properties of genuine systemic vulnerability, or merely echoes of algorithmic bias amplified across the landscape?
The real challenge, predictably, lies not in scaling the model, but in acknowledging its inherent limitations. To treat these digital traces as objective proxies for lived experience is a convenient fiction. The next step requires a deliberate embrace of mixed-methods approaches-ground truthing the algorithmic whispers with the messy, irreducible reality of human agency.
Ultimately, this work proposes a method for observing the unfolding of vulnerability, not for preventing it. Perhaps the most fruitful path forward involves shifting the focus from prediction to adaptation-designing systems that are resilient not to specific threats, but to the inevitable emergence of unforeseen consequences. The map, after all, is not the territory, and even the most meticulously crafted spell is susceptible to the whims of fate.
Original article: https://arxiv.org/pdf/2601.20880.pdf
Contact the author: https://www.linkedin.com/in/avetisyan/
See also:
- United Airlines can now kick passengers off flights and ban them for not using headphones
- Crimson Desert: Disconnected Truth Puzzle Guide
- Katanire’s Yae Miko Cosplay: Genshin Impact Masterpiece
- How to Get to the Undercoast in Esoteric Ebb
- All Golden Ball Locations in Yakuza Kiwami 3 & Dark Ties
- All Itzaland Animal Locations in Infinity Nikki
- Zendaya’s 4 Big 2026 Movies Could Beat Brie Larson’s Box 2019 Office Record
- Gold Rate Forecast
- Fox McCloud Actor Announced as Glen Powell Joins The Super Mario Galaxy Movie
- Australia’s New Crypto Law: Can They Really Catch the Bad Guys? 😂
2026-01-30 18:05