Author: Denis Avetisyan
A novel algorithm accurately pinpoints key spreaders within a population during an ongoing epidemic, offering a faster and more efficient method for targeted intervention.
This study introduces a technique for estimating high-degree vertices in Susceptible-Infected-Susceptible (SIS) epidemic models using constant observation time, independent of network size.
Controlling epidemic spread often relies on identifying and targeting high-risk individuals, yet complete knowledge of contact networks is rarely available. This work, ‘Finding Super-spreaders in SIS Epidemics’, addresses this challenge by demonstrating that accurate estimation of high-degree vertices – potential super-spreaders – does not require full network reconstruction. Specifically, the authors develop an algorithm to identify these critical nodes from the dynamics of a Susceptible-Infected-Susceptible (SIS) process in O(1/α) time, where α defines the degree threshold, a significant improvement over methods requiring observation windows proportional to network size. Could this efficient identification of super-spreaders revolutionize real-time epidemic control strategies?
The Delicate Web: Modeling Epidemic Spread Through Network Analysis
Traditional epidemiological models often rely on the assumption of homogeneous mixing, envisioning a population where every individual has an equal chance of contacting any other. However, real-world disease transmission is profoundly shaped by the complex structure of contact networks – the intricate web of interactions that define how individuals connect. These networks aren’t random; they exhibit patterns of clustering, where individuals are more likely to interact with their immediate contacts, and degree distribution, reflecting varying levels of connectivity. Consequently, a shift towards network-based modeling is crucial for accurately predicting epidemic spread. By representing populations as networks – with nodes representing individuals and edges representing contacts – researchers can account for these crucial structural features. This allows for a more nuanced understanding of how diseases propagate, highlighting the disproportionate role certain individuals – so-called ‘super-spreaders’ – can play and enabling the design of targeted intervention strategies that focus on disrupting transmission within the most critical network connections.
The Susceptible-Infected-Susceptible (SIS) model offers a powerful computational lens through which to examine epidemic propagation. This dynamic process simulates disease spread across a population by categorizing individuals into one of three states: susceptible to infection, currently infected, and recovered, with the crucial distinction being the potential for reinfection. Unlike models assuming lifelong immunity, the SIS framework acknowledges that recovery does not necessarily preclude future infection, making it particularly relevant for diseases like the common cold or influenza. By adjusting parameters such as β – the infection rate – and γ – the recovery rate – researchers can explore how different transmission dynamics impact the size and duration of outbreaks. This allows for the virtual testing of intervention strategies – vaccination campaigns, social distancing measures, or targeted treatments – before implementation, providing valuable insights into the most effective methods for controlling disease spread and mitigating public health crises.
The progression of an epidemic within a network model is profoundly shaped by two key parameters: the infection rate, denoted as β, and the recovery rate, γ. β quantifies the probability of disease transmission upon contact between a susceptible and infected individual, effectively dictating how quickly the disease initially spreads through the population. Conversely, γ represents the rate at which infected individuals recover and gain immunity (or, in the case of a Susceptible-Infected-Susceptible model, return to being susceptible again), thus reducing the number of active infections. The ratio of these rates, often referred to as the basic reproduction number R_0 = \beta / \gamma, provides a critical threshold: if R_0 is greater than one, each infected person, on average, infects more than one other, leading to sustained outbreaks; if less than one, the disease will eventually die out. Therefore, precise calibration of β and γ, informed by real-world data, is essential for accurately simulating epidemic dynamics and evaluating the potential impact of interventions aimed at reducing transmission or accelerating recovery.
Mapping the Invisible: The Challenge of Network Reconstruction
Complete enumeration of contacts within a population is frequently impractical due to privacy concerns, logistical constraints, and the dynamic nature of human interaction. Consequently, researchers often rely on ‘structure learning’ techniques to infer network topology from incomplete data such as epidemic case reports, symptom surveys, or limited contact tracing. These methods utilize statistical inference and computational algorithms to estimate the underlying network structure – including the presence of connections and the distribution of node degrees – based on observed patterns of disease transmission or contact information. The accuracy of these inferred networks is directly dependent on the quantity and quality of the available epidemic data, as well as the assumptions made by the structure learning algorithm.
Traditional network reconstruction methods frequently encounter computational bottlenecks due to the combinatorial nature of the problem; the number of potential network structures grows factorially with the number of vertices. Specifically, algorithms requiring exhaustive search or iterative refinement become intractable for networks exceeding a few hundred nodes. This scalability issue stems from the need to evaluate a vast search space of possible connections, often requiring O(n!) or O(n^k) complexity, where ‘n’ represents the number of vertices and ‘k’ is a constant greater than 2. Consequently, these approaches are often limited to analyzing small, artificially constructed networks or require substantial computational resources and time for even moderately sized real-world datasets.
Identifying high-degree vertices, or super-spreaders, is critical in understanding and mitigating epidemic propagation because their numerous connections facilitate disproportionately large contributions to disease transmission. While the precise degree distribution varies by population and context, these individuals, possessing a significantly higher number of contacts than the network average, accelerate infection rates. Consequently, targeting interventions – such as vaccination or behavioral modification – towards high-degree vertices yields a greater reduction in overall epidemic spread compared to random targeting. Network reconstruction techniques often prioritize identifying these vertices to improve the accuracy of epidemic models and the effectiveness of control strategies; however, accurately determining vertex degree from limited data remains a substantial computational challenge.
Algorithm II-C: A Refined Approach to Estimating High-Degree Vertices
Algorithm II-C estimates high-degree vertices in a network by analyzing the time intervals between successive re-infections during a Susceptible-Infected-Susceptible (SIS) process. This method departs from traditional network inference techniques that require complete network reconstruction. By monitoring when previously infected nodes become susceptible and are re-infected, the algorithm infers the likelihood of a node being highly connected, as high-degree vertices exhibit increased probabilities of contact with infected neighbors and, consequently, faster re-infection rates. This approach offers a novel means of identifying influential nodes without requiring knowledge of the full network topology, focusing instead on dynamic infection patterns.
Algorithm II-C achieves computational efficiency by directly analyzing the time intervals between successive infections of nodes within the Susceptible-Infected-Susceptible (SIS) process, thereby avoiding the computationally expensive step of reconstructing the entire network topology. Traditional network inference methods require identifying all edges and node connections, scaling with the number of nodes n. In contrast, Algorithm II-C focuses solely on the re-infection times, allowing it to estimate high-degree vertices without a complete network representation. This approach significantly reduces processing demands, particularly in large-scale networks where full reconstruction is impractical or prohibitively time-consuming.
Algorithm II-C represents a significant advancement in computational efficiency due to its constant time complexity, denoted as O(1). Traditional methods for estimating network properties, particularly those reliant on observing infection cascades, typically exhibit observation time complexity of O(n), where ‘n’ represents the number of nodes in the network. This linear relationship means processing time increases proportionally with network size. In contrast, Algorithm II-C’s execution time remains independent of network size, allowing for rapid analysis of even very large networks. This constant time performance is achieved through the algorithm’s utilization of re-infection times, bypassing the need for iterative observation of the entire network structure.
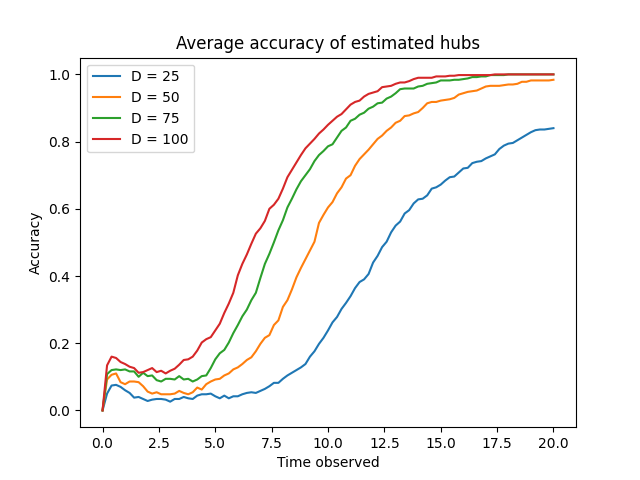
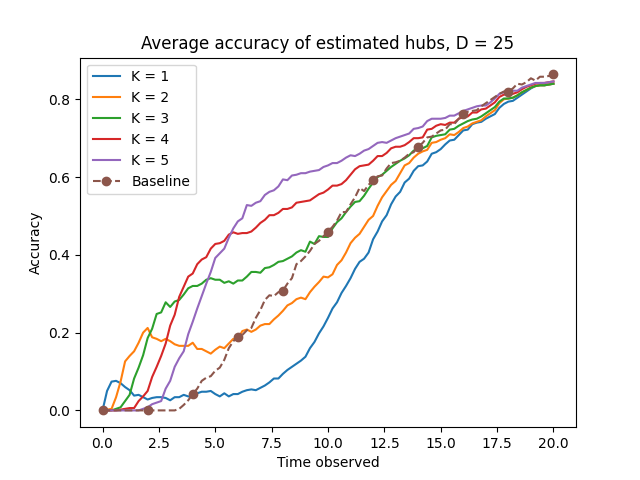
Algorithm II-C demonstrates increasing accuracy in estimating high-degree vertices as the observation period is extended. Empirical results indicate that the algorithm’s accuracy converges towards a value of 1.0 across a range of degree distributions, specifically those defined by D \in \{25, 50, 75, 100\}. This convergence suggests that, given sufficient observation time, the algorithm reliably identifies high-degree vertices, irrespective of the specific network’s degree distribution within the tested parameter space. The observed trend supports the algorithm’s robustness and effectiveness in approximating high-degree vertices within the Susceptible-Infected-Susceptible (SIS) model.
Validating the Approach: Benchmarking and Performance Analysis
The algorithm’s performance is supported by theoretical guarantees derived from graph spectral analysis and percolation theory. Specifically, the algorithm’s accuracy in identifying high-degree vertices – critical for intervention strategies – is demonstrably linked to the graph’s spectral gap; a larger spectral gap correlates with improved identification accuracy. These guarantees hold under conditions of graph regularity, specifically for 4-regular graphs as used in benchmarking, and establish bounds on the algorithm’s error rate. Furthermore, the mathematical foundation allows for predicting performance characteristics based on graph parameters, providing a quantifiable measure of expected effectiveness before empirical testing. \lambda_{2}(G) represents the second largest eigenvalue of the adjacency matrix, directly influencing the precision of the high-degree vertex estimation.
Evaluation of the algorithm utilized random 4-regular graphs as a benchmarking environment due to their defined properties. A 4-regular graph, by definition, has a degree of four for each node, meaning each node is connected to exactly four other nodes; this uniformity simplifies analysis and isolates the algorithm’s performance characteristics. The use of randomly generated graphs of this type ensures a consistent network structure across multiple trials, minimizing confounding variables and allowing for statistically significant comparisons. This controlled environment facilitates precise measurement of the algorithm’s ability to identify key spreaders and reduce infection rates, independent of specific network topologies or degree distributions found in real-world networks.
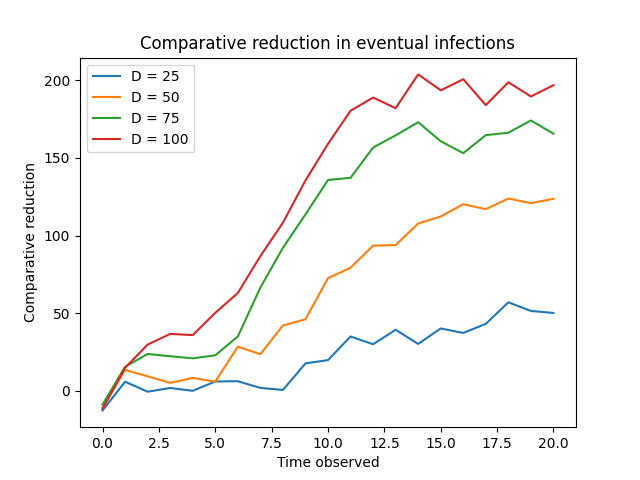
Targeted interventions, focusing on nodes estimated to have high degree, yielded substantial reductions in infection spread when compared to strategies involving random node removal. Analysis indicates this performance advantage becomes particularly pronounced after a time step of approximately T = 2.5. Quantitative results demonstrate that prioritizing high-degree vertices for intervention consistently minimizes cumulative infections, showcasing an increased effectiveness as the epidemic progresses beyond this threshold. This suggests that early interventions, while beneficial, are amplified in impact when directed toward nodes identified as likely super-spreaders as the infection establishes itself within the network.
Algorithm performance was validated by comparison to cumulative infection time, a baseline metric representing the total duration infections persist within the network. Results indicate the algorithm consistently outperforms this baseline, demonstrating a greater ability to identify and target key spreaders – nodes whose removal most effectively reduces the overall infection timeframe. Specifically, the algorithm achieves reductions in cumulative infection time across multiple trials and network configurations, signifying its efficacy in controlling disease propagation beyond random node removal strategies. This comparison confirms the algorithm’s value as a targeted intervention method for mitigating outbreaks.
Precision Public Health: Targeted Intervention and Future Directions
Network analysis reveals that a surprisingly small number of individuals-those with the most connections, termed high-degree vertices-disproportionately drive disease transmission. Consequently, directly targeting these individuals with interventions like vaccination or strategic isolation offers a highly efficient means of curtailing epidemics. Simulations demonstrate that focusing limited resources on immunizing or temporarily removing just a fraction of these key spreaders can yield substantial reductions in overall infection rates, often exceeding the impact of randomly distributed interventions. This focused approach represents a shift from broad, population-wide strategies toward precision public health, maximizing the return on investment in disease control and potentially preventing widespread outbreaks before they escalate.
Public health strategies often operate under constraints of limited resources, necessitating a prioritization of interventions. Recent research demonstrates that a disproportionate amount of disease transmission is driven by a small subset of individuals within a population – those with a high degree of connectivity. By strategically allocating resources – such as vaccinations, targeted information campaigns, or focused isolation measures – to these ‘super-spreaders’, the overall impact on disease control can be dramatically amplified. This approach shifts the focus from broad, population-wide interventions to a more precise and efficient method, maximizing the reduction in infection rates with a minimal investment of time and materials. The optimization offered by identifying and influencing these key individuals represents a paradigm shift in proactive epidemic management, promising a more effective and sustainable approach to safeguarding public health.
Researchers anticipate extending this algorithmic approach beyond simulations to analyze genuine epidemic datasets, offering a practical validation of its effectiveness in diverse outbreak scenarios. Current investigations also center on refining the model to accommodate the intricacies of real-world social networks, which often deviate significantly from simplified representations; this includes incorporating factors like varying contact rates, dynamic network topologies, and heterogeneous mixing patterns. Adapting the algorithm to handle these complex network structures promises to yield even more precise identification of high-degree vertices and, consequently, more targeted and efficient public health interventions, ultimately enhancing preparedness for future outbreaks and potentially mitigating their impact on global health.
The pursuit of identifying super-spreaders within the SIS model, as detailed in the research, echoes a fundamental principle of systemic understanding. Just as infrastructure inevitably succumbs to the forces of decay, so too does the stability of an epidemic within a network. Max Planck observed, “A new scientific truth does not triumph by convincing its opponents but by the opponents dying out.” This holds true for epidemic control; inaccurate methods of identifying high-degree vertices-the network’s ‘opponents’ to effective control-will ultimately be superseded by more precise algorithms capable of reconstructing the contact network. The algorithm’s efficiency in estimating these critical nodes, independent of network size, represents not a victory of persuasion, but the natural consequence of a superior approach to understanding a decaying system.
What Lies Ahead?
The pursuit of identifying influential spreaders within a network, as demonstrated by this work, is less about conquering epidemics and more about understanding how systems distribute influence – a process inherent to all complex arrangements. The algorithm’s efficiency, its independence from network size in observational time, is notable, but it addresses a symptom, not the underlying decay. Networks shift, connections fray and reform, and the ‘super-spreaders’ of one moment are rarely those of the next. Systems learn to age gracefully, and attempting to freeze a moment in time, even with increased precision, feels increasingly like a category error.
Future investigations might well focus on the rate of change in these influential positions, rather than the positions themselves. Modeling the dynamics of influence, acknowledging that networks are not static entities, may prove more fruitful than striving for ever-sharper snapshots. The question isn’t simply ‘who spreads the most,’ but ‘how does influence redistribute itself over time?’
Perhaps, ultimately, the most valuable outcome of this line of inquiry will not be improved epidemic control, but a deepened appreciation for the ephemeral nature of influence itself. Sometimes observing the process is better than trying to speed it up, and a patient understanding of network evolution may yield insights beyond the reach of any predictive algorithm.
Original article: https://arxiv.org/pdf/2602.12568.pdf
Contact the author: https://www.linkedin.com/in/avetisyan/
See also:
- United Airlines can now kick passengers off flights and ban them for not using headphones
- Katanire’s Yae Miko Cosplay: Genshin Impact Masterpiece
- All Itzaland Animal Locations in Infinity Nikki
- How to Complete Bloom of Tranquility Challenge in Infinity Nikki
- How to Get to the Undercoast in Esoteric Ebb
- Gold Rate Forecast
- A Dark Scream Theory Rewrites the Only Movie to Break the 2-Killer Rule
- All Golden Ball Locations in Yakuza Kiwami 3 & Dark Ties
- BloxStrike codes (March 2026)
- Fire Force Season 3 Part 2 Episode 24 Release Date, Time, Where to Watch
2026-02-17 05:27